



The average Instagram account grows about 1% a month. We read the follower counts of 126,356 public Instagram accounts twice, a median of 18 days apart, between August and October 2026. The median account gained 0.93% followers per 30 days. One in four (24.2%) had fewer followers at the second read than at the first. Small accounts grow faster in percent: 1.21% a month at 1K to 10K followers, against 0.03% at 1M+. Accounts that post 3 to 7 times a week grew 2.72% a month, and accounts that posted nothing in 8 weeks grew 0.19%.
Most pages that rank for this question quote one average from their own tool users or from brand pages. Buffer gives an average of 36.8% a month across its users' accounts, including accounts under 1,000 followers. Hootsuite gives 1.82% a week for brand accounts. A few accounts that double pull a mean up, so it says little about a normal account. In our data the mean is 6.63% a month and the median is 0.93%. This study reports medians, by size and by habit, and counts the accounts that shrink.
0.93%
Median account
24.2%
Lost followers
3.1%
Jumped 20%+
The median account grows 0.93% a month
We took every account our crawler read twice, at least 10 days apart, and turned the change into a 30-day rate. An account read 18 days apart that went from 10,000 to 10,060 followers grew 0.6% in 18 days, or 1.0% per 30 days.
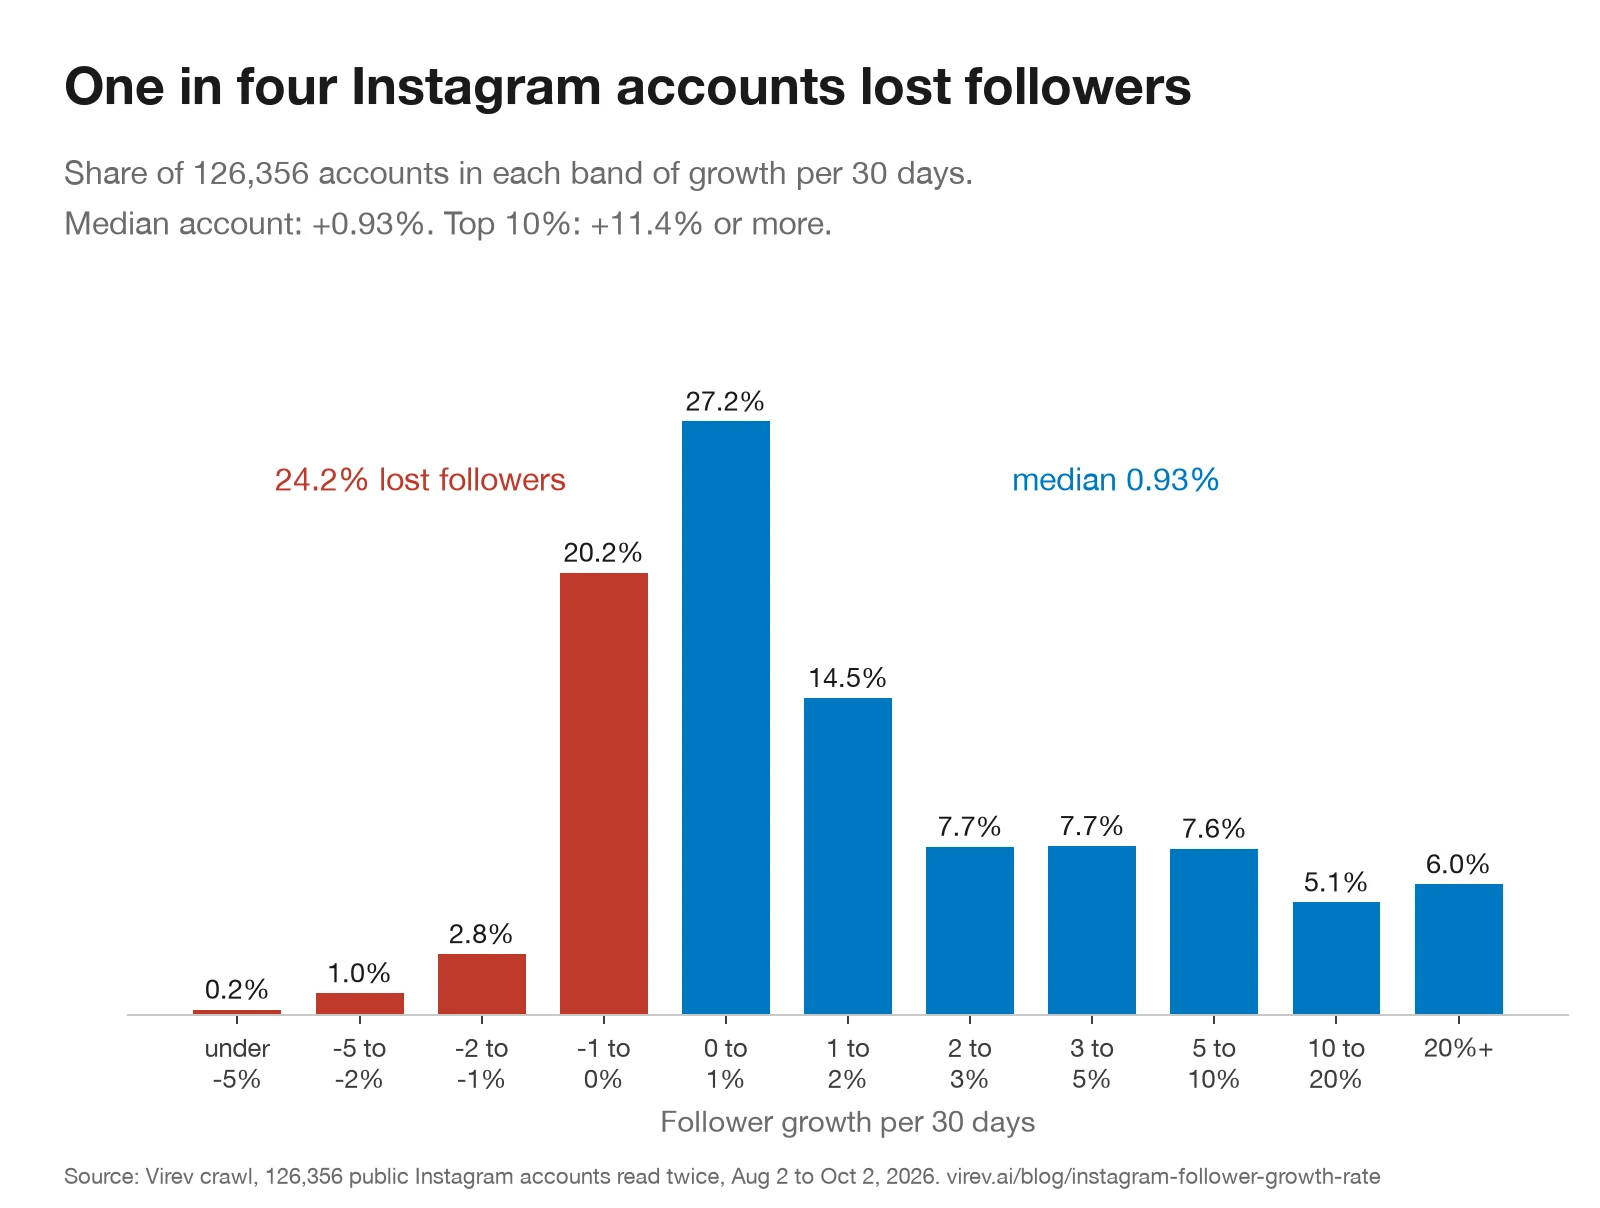
Almost half (47%) sit between a 1% loss and a 1% gain. 75.2% grew between the reads, 24.2% shrank and 0.6% did not move. The top 10% grew 11.4% a month or more. That long right tail is why the mean (6.63%) is seven times the median. If you see an "average growth" figure of 5% or more a month, it is a mean, or it comes from users of a growth tool.
In followers, the median account gained 155 followers per 30 days. The median account in the sample has 28,417 followers.
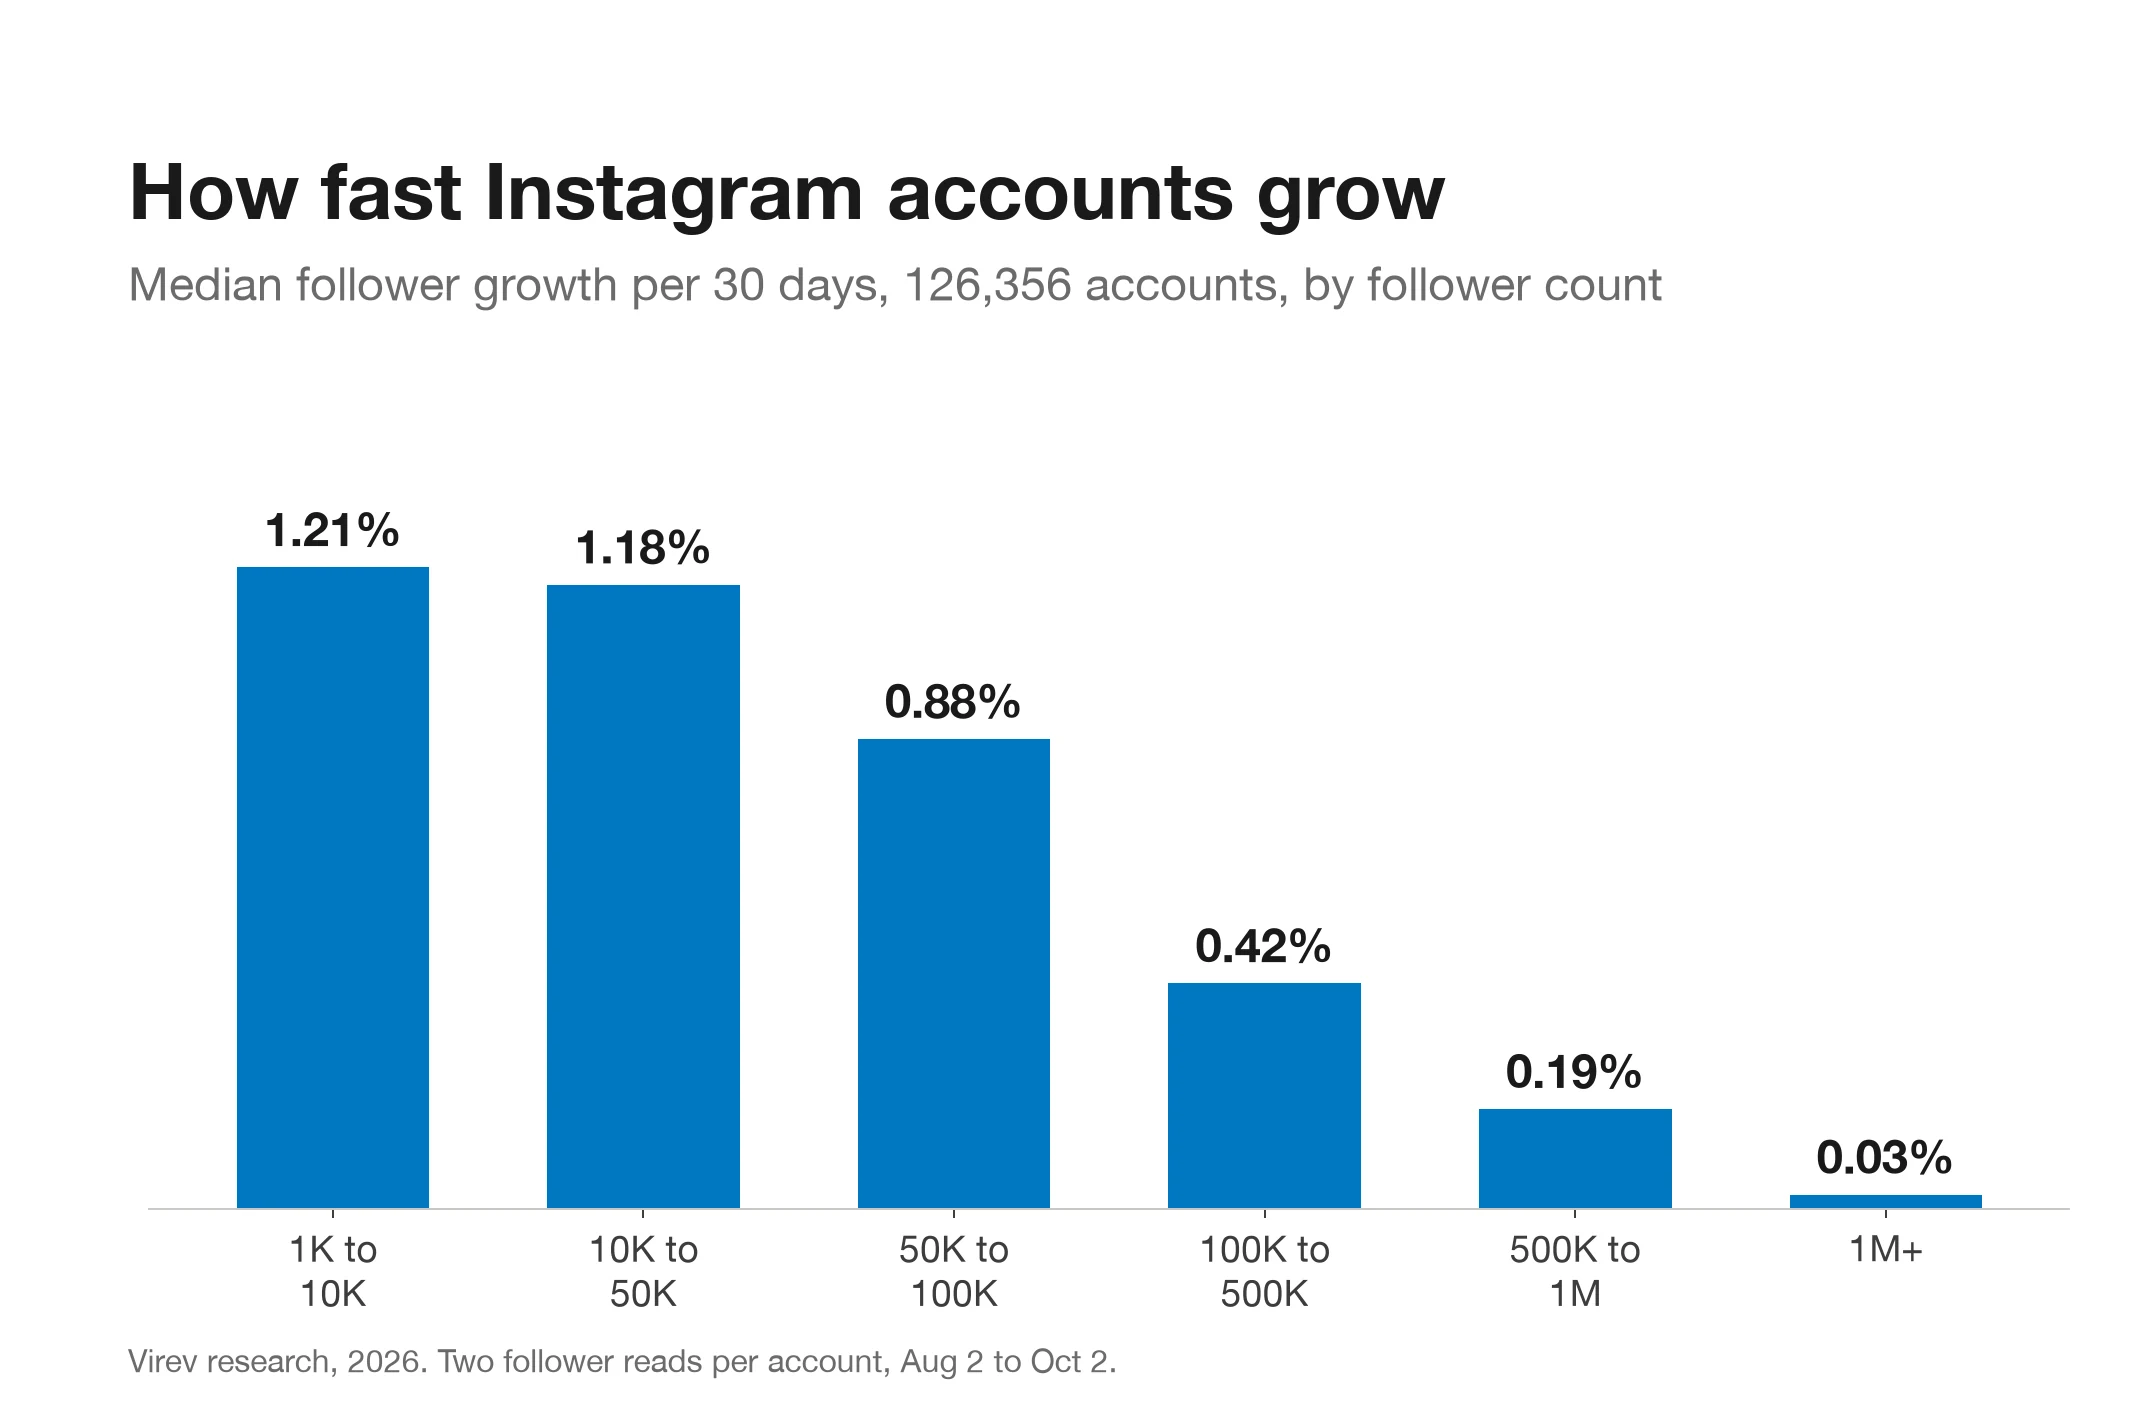
Small accounts grow faster in percent
| Followers | Accounts | Median growth, 30 days | Top 10% | Shrank |
|---|---|---|---|---|
| 1K to 10K | 34,592 | 1.21% | 10.88% | 14.5% |
| 10K to 50K | 46,196 | 1.18% | 16.18% | 21.0% |
| 50K to 100K | 20,607 | 0.88% | 12.46% | 26.8% |
| 100K to 500K | 9,950 | 0.42% | 7.72% | 37.3% |
| 500K to 1M | 8,526 | 0.19% | 4.23% | 40.9% |
| 1M+ | 6,485 | 0.03% | 2.57% | 48.5% |
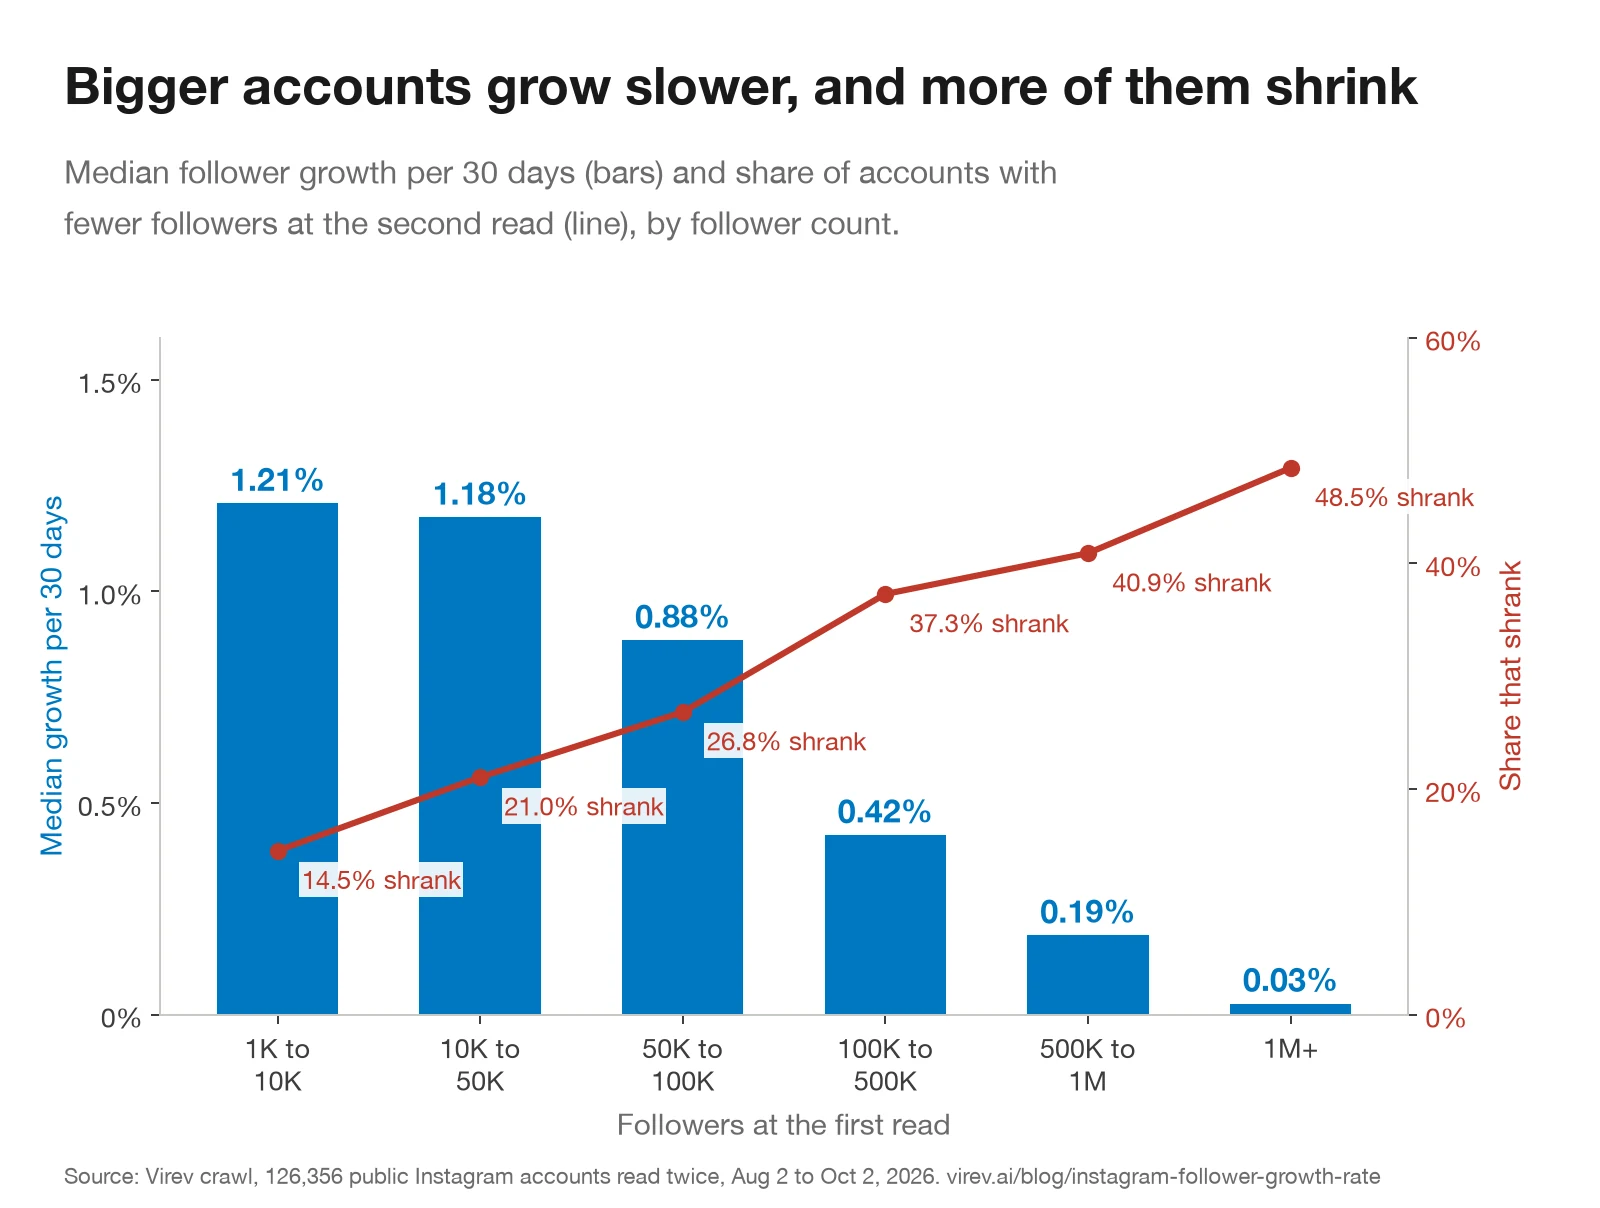
Growth in percent falls with size. A 1K to 10K account grows about 1.2% a month, which is 44 followers on a 4,000-follower account. In followers, the median 100K to 500K account gained 871 a month and the median 500K to 1M account 1,449. A 1M+ account is flat: the median grew 0.03% a month, and almost half (48.5%) lost followers between the reads. Above 100K, more than a third of accounts shrank between the reads.
For a brand, this changes how to read a creator's follower count. A large account with a flat or falling count is normal. A small account that grows 1% a month is normal too. A creator who grows faster than the top 10% of their tier is worth a second look, for a good reason or a bad one. The spike section below shows how rare that is.
Accounts that post more grow faster
We matched 71,441 of the accounts to their posts from August 1 to September 25, 2026, and counted posts per week.
| Posts per week | Accounts | Median growth, 30 days | Top 25% | Shrank |
|---|---|---|---|---|
| None in 8 weeks | 9,285 | 0.19% | 1.31% | 40.4% |
| Under 1 | 33,703 | 0.98% | 3.13% | 20.0% |
| 1 to 3 | 19,702 | 1.72% | 5.25% | 10.8% |
| 3 to 7 | 5,943 | 2.72% | 10.33% | 8.3% |
| 7 to 14 | 2,695 | 4.24% | 17.68% | 8.0% |
| 14+ | 113 | 2.11% | 10.65% | 10.6% |
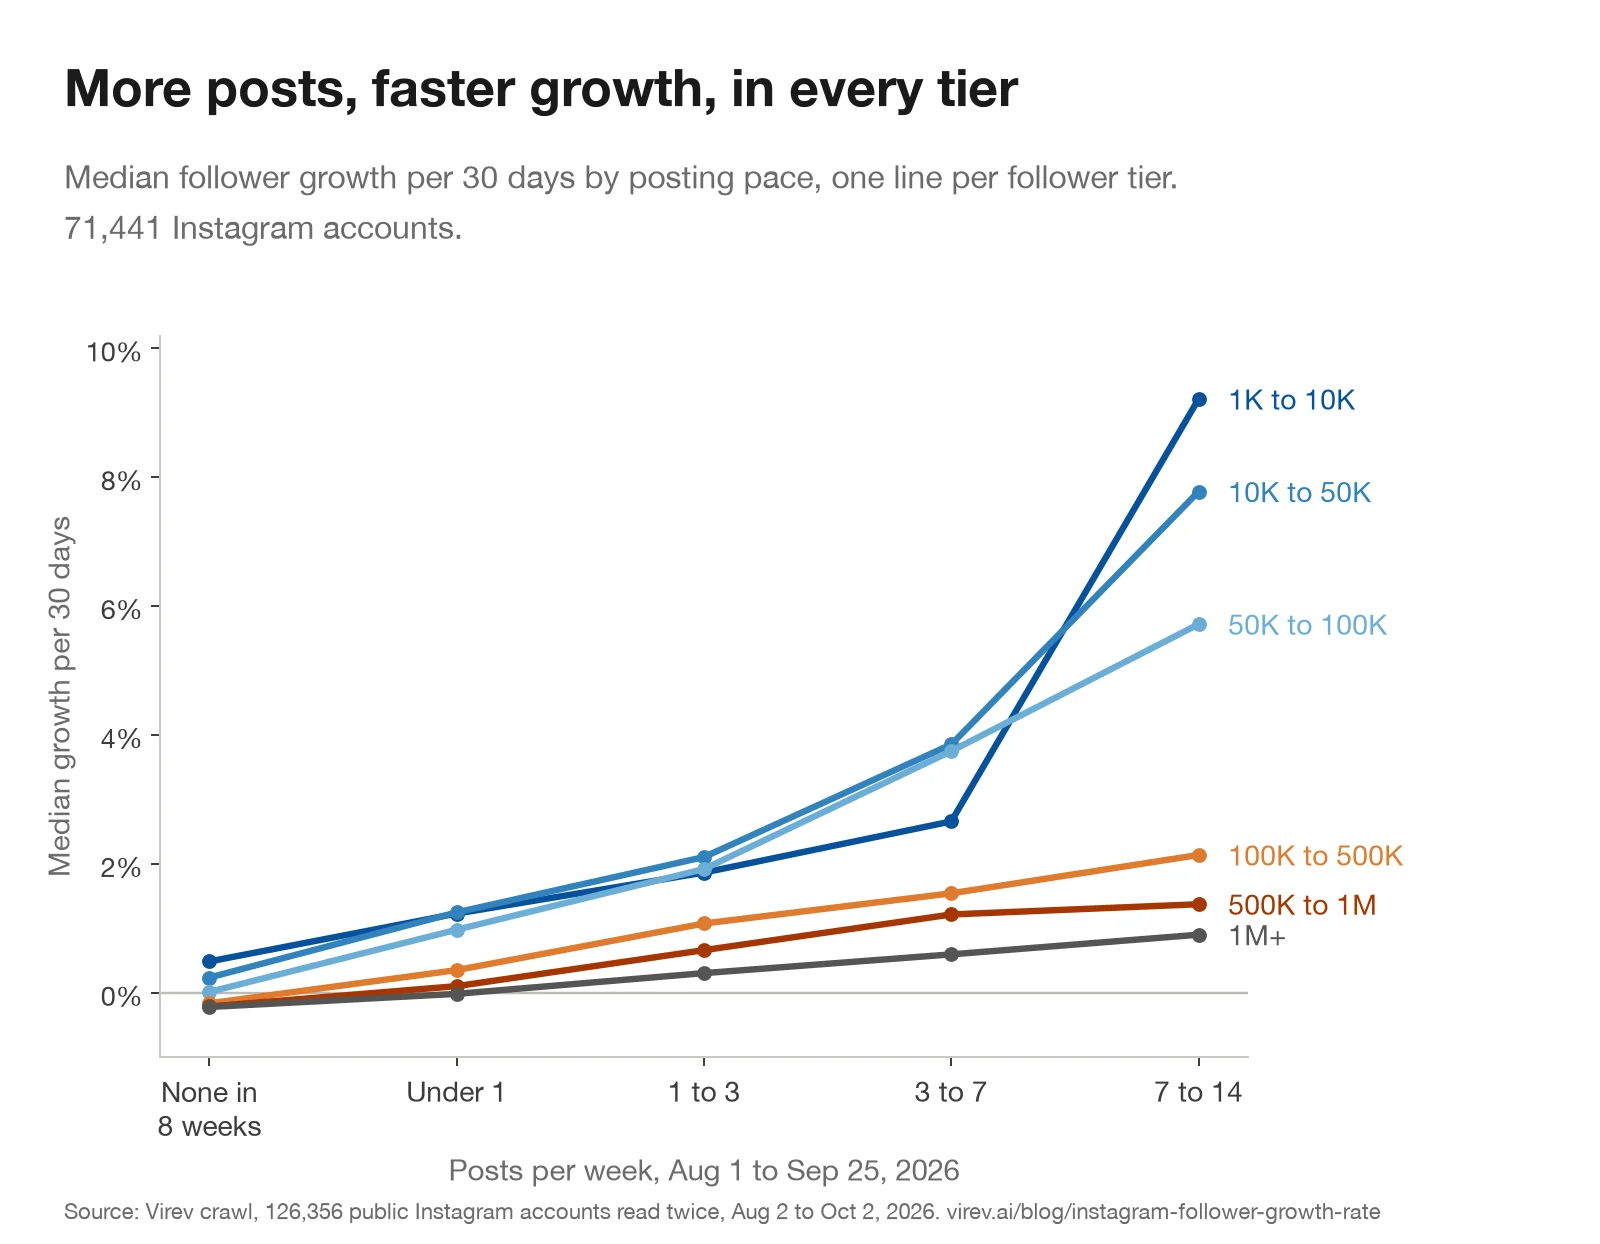
Accounts that stopped posting shrink most often: 40.4% of them lost followers, and their median growth was 0.19% a month. Posting 3 to 7 times a week goes with 2.72% a month, about 14 times the growth of an account that went quiet.
The order holds inside every tier. Among 1K to 10K accounts, growth goes from 0.49% (no posts) to 1.23%, 1.87%, 2.66% and 9.21% (7 to 14 posts a week). Among 1M+ accounts, it goes from -0.22% to 0.90%. So the pattern does not come from big accounts posting less.
This is a correlation. An account that is growing has a reason to post more, and a creator who posts daily often has a team. Posting more is not a promise of growth. It does show that quiet accounts lose followers more often.
Reels-heavy accounts grow faster
| Reels as share of posts | Accounts | Median growth, 30 days | Top 10% |
|---|---|---|---|
| 0 to 25% | 23,645 | 1.11% | 8.03% |
| 25 to 50% | 10,843 | 1.25% | 9.42% |
| 50 to 75% | 7,451 | 1.52% | 14.04% |
| 75 to 100% | 20,217 | 2.34% | 29.90% |
Accounts whose posts are mostly reels grew 2.34% a month, against 1.11% for accounts that post mostly photos and carousels. Reels-heavy accounts also post more, so we checked inside the same posting pace. At 1 to 3 posts a week, mostly-reel accounts grew 3.09% and mostly-photo accounts 1.37%. At 3 to 7 posts a week it was 6.39% against 1.74%. The reel gap holds at the same pace.
Reels reach people who do not follow you, which is the likely reason. Our Instagram algorithm study measures reel views against follower counts.
Category and verification
Instagram lets accounts pick a category label. 32% of the accounts with post data have one. Among labels with 400 or more accounts:
| Instagram category | Accounts | Median growth, 30 days | Shrank |
|---|---|---|---|
| Reel creator | 1,986 | 1.97% | 24.4% |
| Fan page | 889 | 1.96% | 24.6% |
| Digital creator | 4,455 | 1.65% | 25.3% |
| Blogger | 923 | 1.53% | 26.5% |
| Education | 600 | 1.44% | 17.5% |
| Personal blog | 1,119 | 1.34% | 28.0% |
| Musician/band | 809 | 1.11% | 16.8% |
| Artist | 2,408 | 0.74% | 28.3% |
| Athlete | 683 | 0.41% | 36.3% |
| Public figure | 880 | 0.37% | 33.5% |
| Actor | 707 | 0.32% | 37.1% |
Accounts that make content for the feed (reel creators, digital creators, bloggers) grow faster than accounts known for something outside Instagram (actors, athletes, public figures). Part of that is size: the median actor or public figure here has about 270,000 followers, against about 55,000 for reel and digital creators. Athletes are the same size as reel creators (median 57,280) and still grew at a fifth of the rate. Their counts move with matches and news more than with their posts.
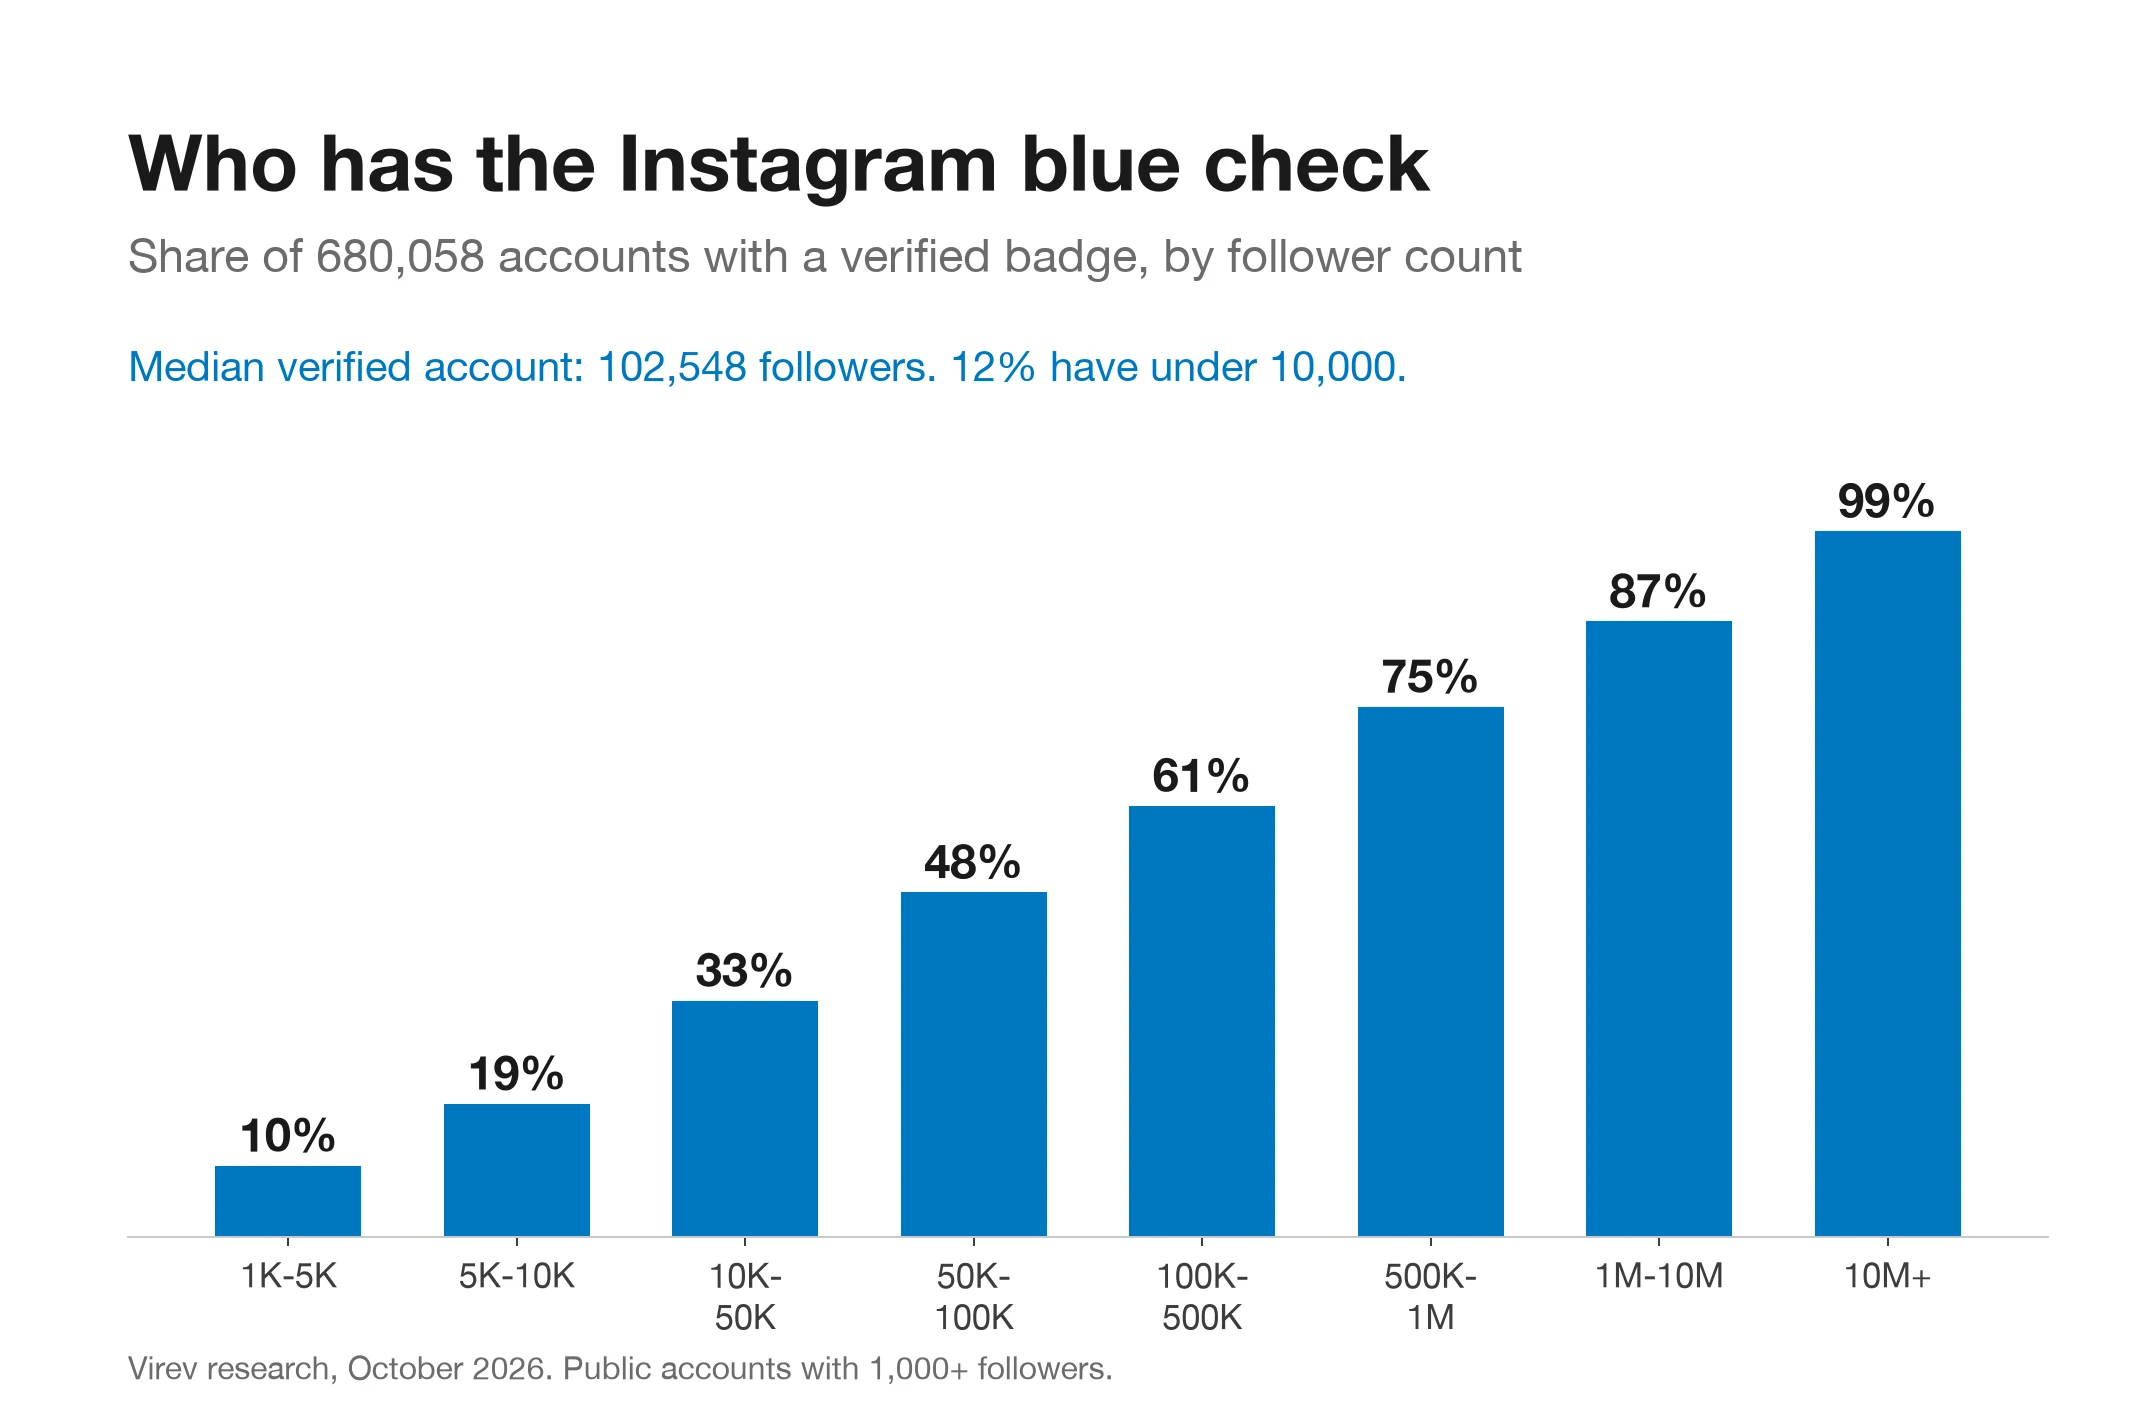
Verified accounts grew 0.91% a month and unverified ones 1.34%. That is mostly size: verified accounts are bigger. Inside the same tier the gap is small and goes both ways. At 1K to 10K, the 2,111 verified accounts grew faster (2.19% against 1.31%). Above 50K, verified accounts grew a little slower.
How long it takes to get from 1,000 to 10,000 followers
At the median pace of a 1K to 10K account, 1.21% a month, an account needs about 192 months, or 16 years, to go from 1,000 to 10,000 followers. Most small accounts are not on a path to 10K at all.
| Pace (growth per 30 days) | Rate | Months from 1K to 10K |
|---|---|---|
| Median 1K to 10K account | 1.21% | about 192 (16 years) |
| Median 1K to 10K account posting 3 to 7 a week | 2.66% | about 88 (7 years) |
| Top 25% of 1K to 10K accounts | 3.27% | about 72 (6 years) |
| Median 1K to 10K account posting 7 to 14 a week | 9.21% | about 26 (2 years) |
| Top 10% of 1K to 10K accounts | 10.88% | about 22 (2 years) |
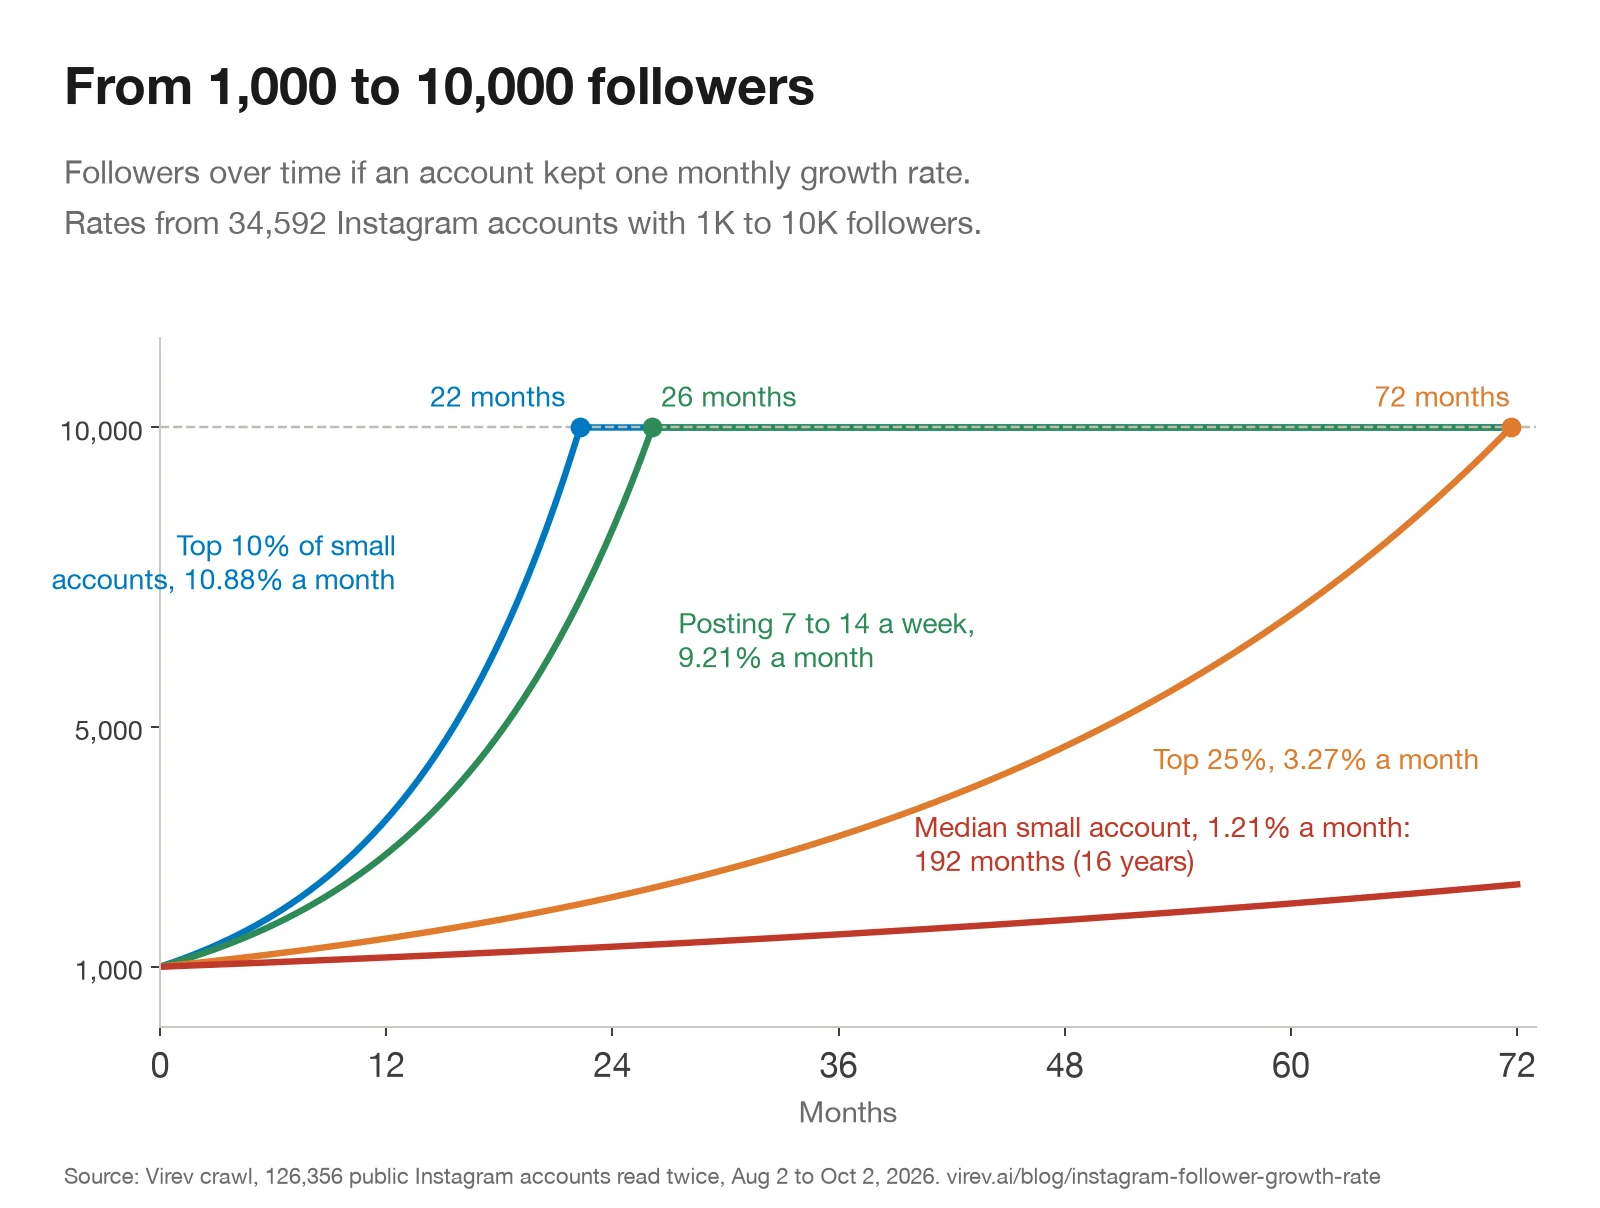
These months assume an account keeps the same rate every month, which no account does. Growth comes in bursts: one reel that travels can add a year of followers in a week. So read the table as a guide to the pace you need. To reach 10K in two years, an account needs to grow about 10% a month, which puts it in the top 10% of small accounts. Among small accounts that did grow that fast, 47% post mostly reels, against 17% of all small accounts, and 23% post 3 or more times a week, against 9%.
A 20% jump in one month is rare
Follower spikes get attention because bought followers arrive in one block. We counted how often a jump happens on its own. Among 126,022 accounts read up to 30 days apart:
| Followers | Accounts | Gained 10%+ | Gained 20%+ |
|---|---|---|---|
| 1K to 10K | 34,570 | 6.7% | 3.3% |
| 10K to 50K | 46,108 | 9.2% | 4.5% |
| 50K to 100K | 20,553 | 6.6% | 2.7% |
| 100K to 500K | 9,835 | 3.5% | 1.2% |
| 500K to 1M | 8,500 | 1.4% | 0.4% |
| 1M+ | 6,456 | 0.5% | 0.1% |
| All | 126,022 | 6.7% | 3.1% |
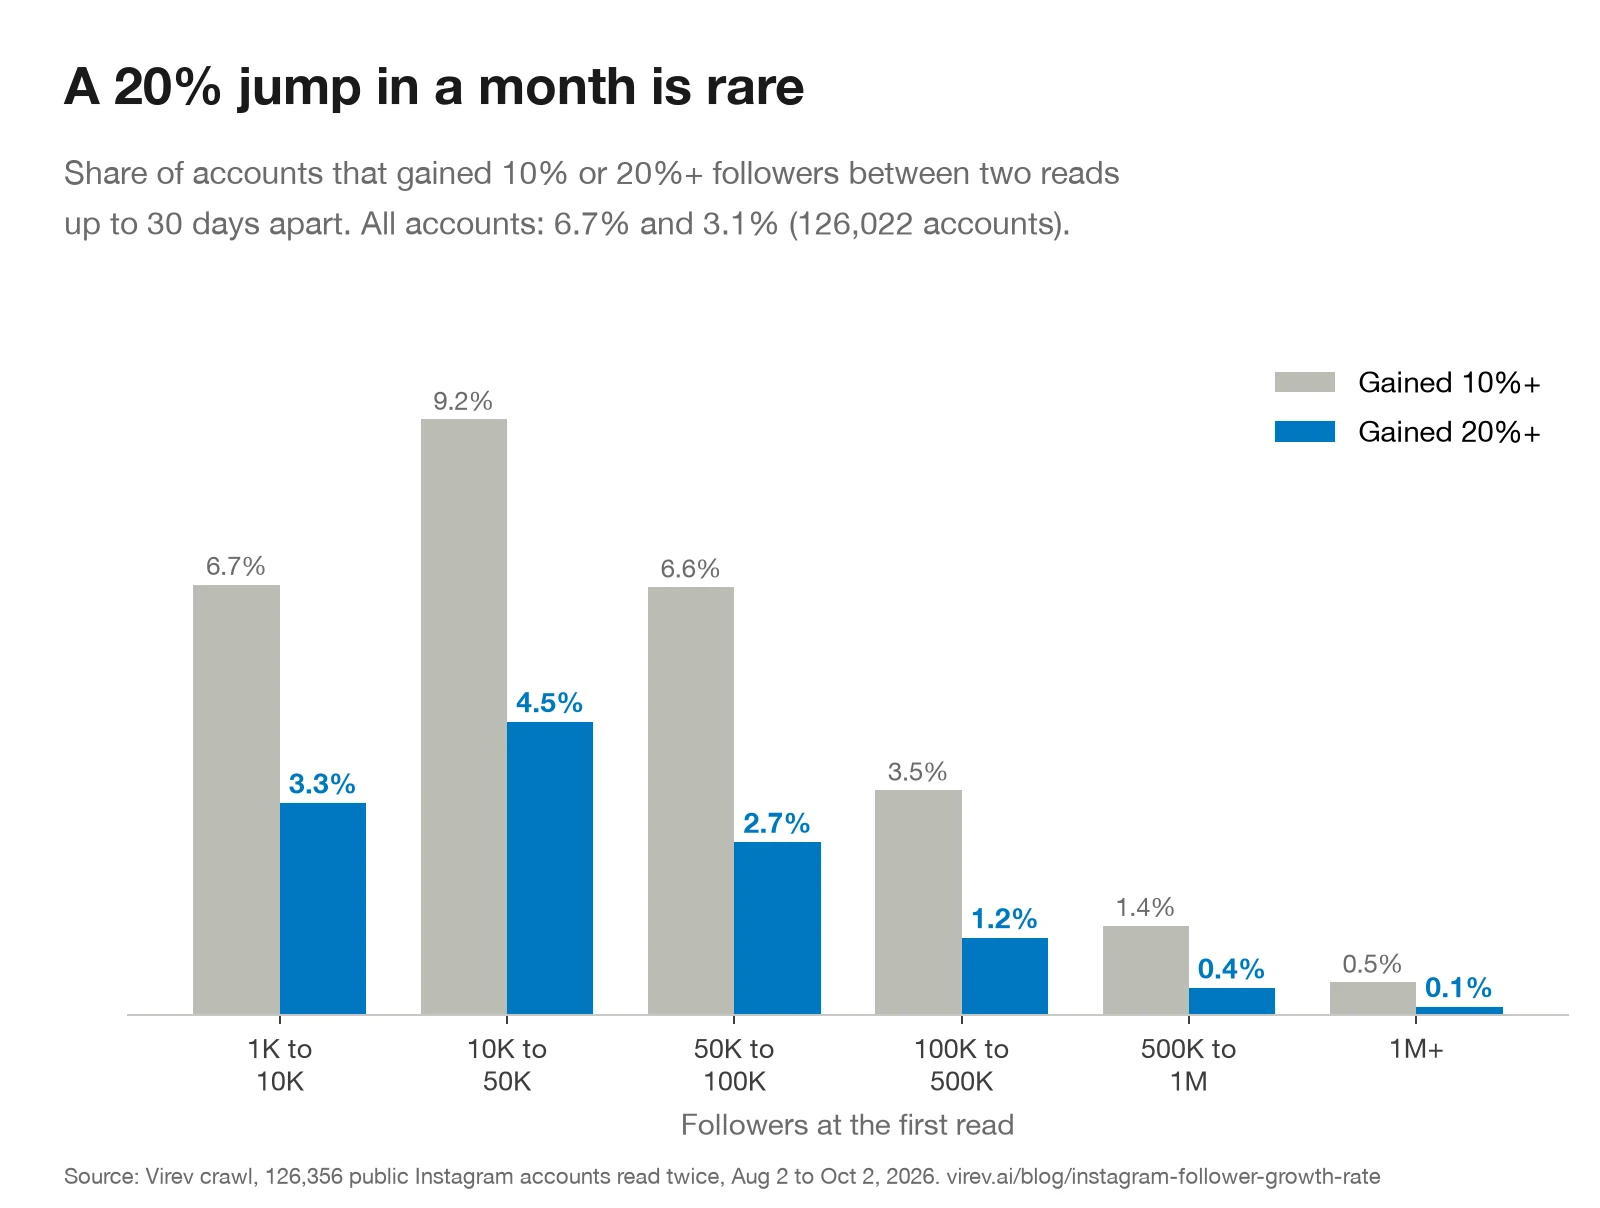
3.1% of accounts gained 20% or more in a month or less, and 0.9% gained 50% or more. Drops are rarer still: 0.03% lost 10% or more. Spikes cluster at 10K to 50K followers, where one viral reel can double an account. Above 500K a 20% jump almost never happens, because it would mean 100,000+ new followers.
A spike is a reason to look closer. Most real spikes have a cause you can find in a few minutes: a reel with many times the account's usual views, a press mention, a collab with a bigger account, or a TV appearance. Bought followers usually come with no such post, and with likes that stay flat while the count goes up. Our guide to reading follower growth without treating every spike as fraud walks through the checks. To run them on a real account, the free Instagram fake follower checker flags a 20% jump and compares likes and comments with the account's size.
Six accounts, checked live
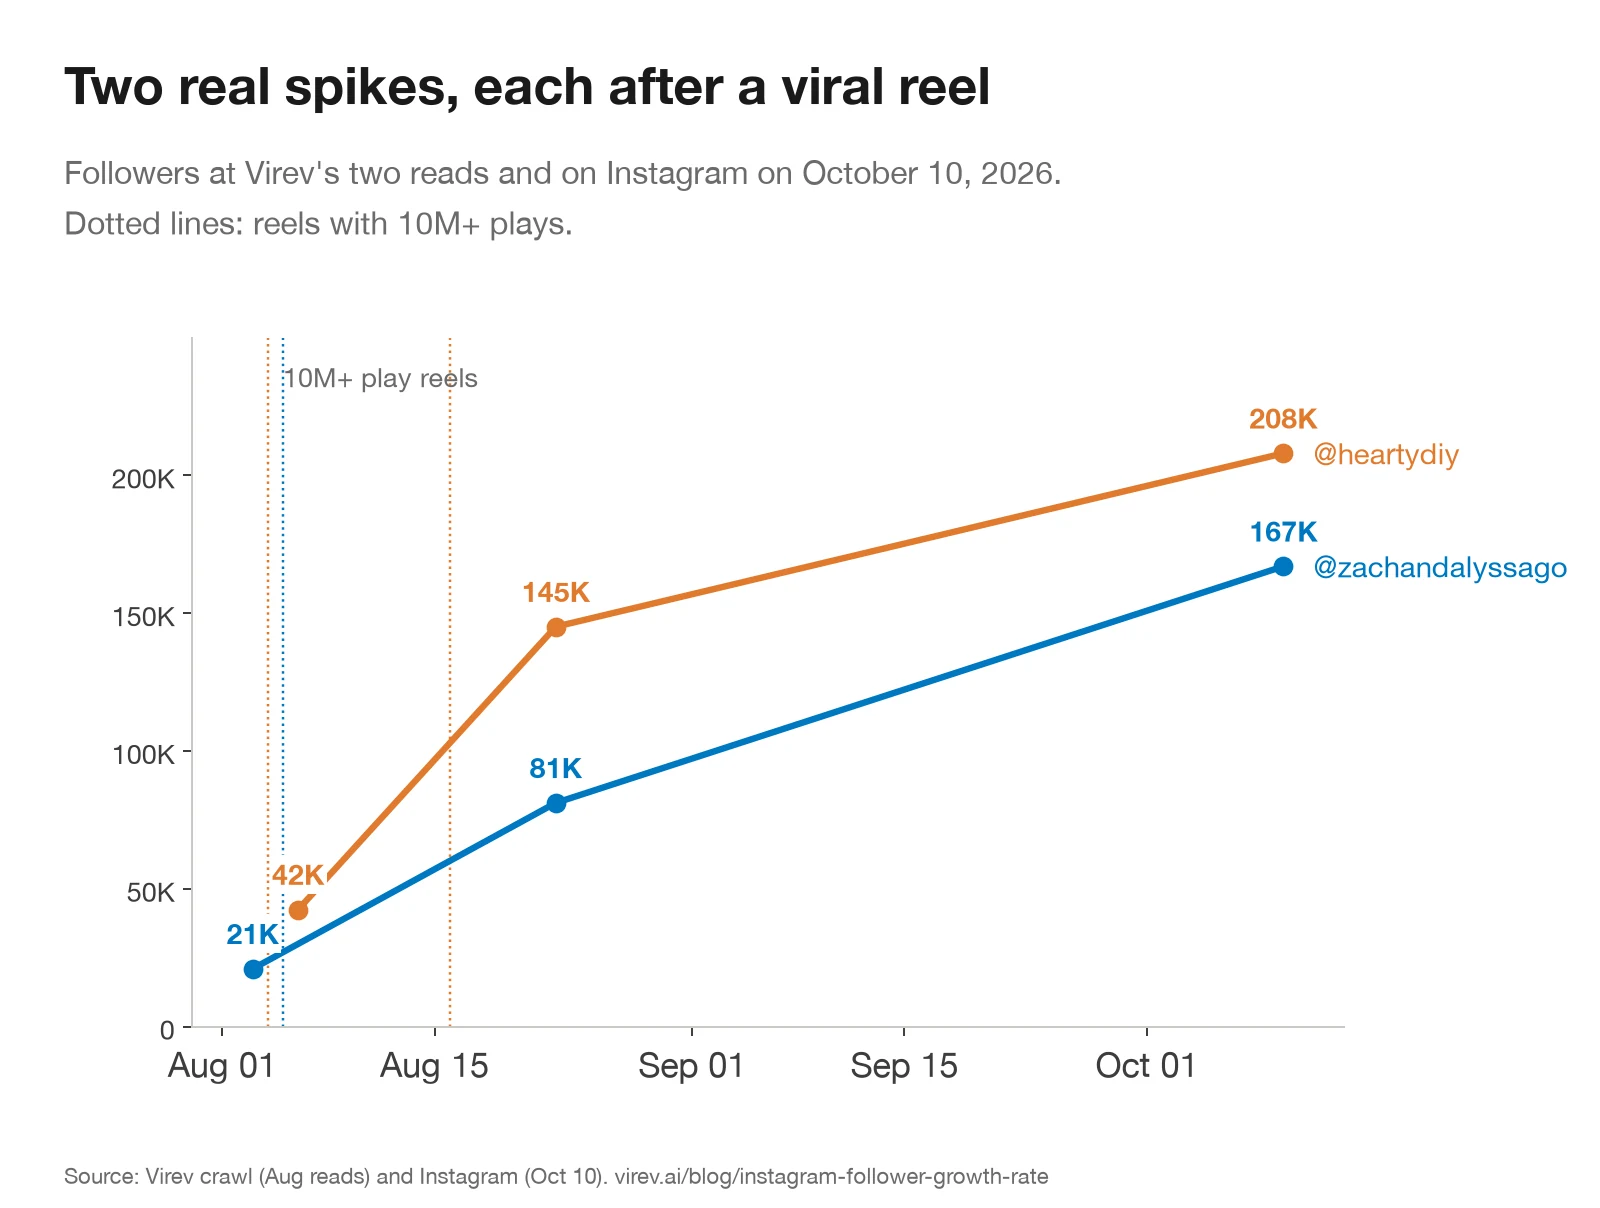
We checked these accounts on Instagram on October 10, 2026. The first two counts are our crawler's reads. The last is the count Instagram's public profile card showed on October 10, which Instagram rounds (167K, 15.9M).
Two mid-size spikes with a viral reel behind them
@zachandalyssago, a couple who live and travel in a motorhome, went from 20,984 to 81,187 followers between August 3 and August 23, a gain of 287% in 20 days. On August 5 they posted a reel titled "A rainy night living in our motorhome on a foggy peninsula". It had 12.9 million plays at our read. Their other reels from July and August had a median of about 106,000 plays. They posted 38 reels in those seven weeks, so the account was already posting daily when one reel took off. On October 10 the account had 167K followers.
@heartydiy, which turns plastic bottles into crafts, went from 42,475 to 145,106 followers between August 6 and August 23. Two reels did it: a turtle made from empty bottles on August 4 and glowing bottle ghosts on August 16, each with about 10.8 million plays at our read. Their usual reel had about 82,000 plays, and they posted close to two reels a day. On October 10 the account had 208K followers.
Both jumps would trip any spike check, and both have a reel you can open and watch. This is what a real spike looks like: a post with 100 times the account's usual plays, then more followers.
Two large accounts that grew fast
Actor Jung Hae-in (@holyhaein) went from 14.56 million to 15.28 million followers between August 3 and August 22. That is 7.6% per 30 days, three times the top 10% of 1M+ accounts (2.57%). Netflix released his series "Our Sticky Love" on August 7. His posts from August 8 to 14, tagged #ourstickylove, got 1.2 to 2.2 million likes at our read, against 0.5 to 0.9 million for his July posts. On October 10 he had 15.9M followers.
Singer Karan Aujla (@karanaujla) went from 14.36 million to 15.00 million between August 3 and August 23, or 6.5% per 30 days. His August 14 reel, a promo for a show in Adelaide, had 18.1 million plays at our read. On October 10 he had 15.2M.
Two large accounts that shrank
Musician Talwiinder (@talwiinder) went from 5.72 million to 5.61 million followers between August 3 and August 23, a loss of 1.9%. Our crawl holds no post of his dated July to September. On October 10 Instagram showed 5.3M, so the decline continued.
@anurag_dobhal, a moto vlogger, went from 7.95 million to 7.87 million in the same weeks, while his reels still got 9 million to 37 million plays each. On October 10 he had 7.6M. A large account can keep high views and still lose followers, which is why almost half of 1M+ accounts shrank in our data.
TikTok accounts grow faster
As a side check, we ran the same method on 6,967 TikTok accounts with 1,000+ followers, read twice between August and October 2026 (median gap 11 days).
| TikTok followers | Accounts | Median growth, 30 days | Shrank |
|---|---|---|---|
| 1K to 10K | 2,024 | 6.21% | 13.5% |
| 10K to 50K | 1,641 | 4.94% | 15.7% |
| 50K to 100K | 589 | 3.85% | 12.9% |
| 100K to 500K | 1,688 | 1.65% | 18.7% |
| 500K to 1M | 466 | 1.24% | 16.7% |
| 1M+ | 559 | 0.40% | 29.9% |
| All | 6,967 | 2.75% | 16.8% |
The median TikTok account grew 2.75% a month, three times the Instagram median, and fewer TikTok accounts shrank (16.8% against 24.2%). The TikTok sample is small and the gaps are shorter, so treat it as a side table. For TikTok engagement by tier, see our TikTok engagement rate benchmarks.
What to do with this
For brands and agencies
- Use the median for your tier as the baseline. A 50K creator growing 0.9% a month is normal, and one at 4% is in the top 25% of that tier.
- Do not mark a big account down for a flat count. Almost half of 1M+ accounts lost followers in a month.
- Check whether a creator still posts. Accounts with no posts in 8 weeks grew 0.19% a month, and 40% of them shrank.
- When a creator shows a spike, find the post behind it before you judge it. The fake follower checker shows the jump and the engagement next to it.
- Track the count over time. Virev keeps each creator's follower history. Find creators in Virev creator search, save them to a list, and the creator card shows their last 30 days of follower counts, so you see a spike before you pitch. Sign up to search creators by niche and size.
For creators
- Compare yourself with the median for your tier. At 1K to 10K, 1.2% a month is the median and 3.3% puts you in the top 25%.
- Post every week. The gap between no posts and 1 to 3 posts a week is 0.19% against 1.72% a month.
- Lean on reels. At the same posting pace, mostly-reel accounts grew about twice as fast.
- Expect growth in bursts, because one reel can bring a small account a year of followers.
How we measured, and what can be wrong
- The sample is 126,356 public Instagram accounts with 1,000+ followers at the first read, whose follower count Virev's crawler read twice, 10 to 61 days apart, between August 2 and October 2, 2026.
- The median gap between reads was 18 days, and three in four gaps were 17 to 19 days.
- Growth per 30 days is (followers at the second read / followers at the first read) raised to the power of 30 / days, minus one, and the tables report the median across accounts.
- The sample holds accounts the crawler read twice in 61 days, and the crawler returns more often to active accounts, so the sample leans toward accounts that post.
- That bias is one reason the 3.1% spike rate here is higher than the 1.0% our fake follower checker measured on 375,540 accounts, a broader population.
- Most gaps are 17 to 19 days and we scale them to 30 days, so one viral week moves an account's rate a lot.
- Accounts with a gap of 20 to 30 days give about the same median (1.00%) as accounts with a gap of 10 to 20 days (0.93%).
- Posting pace counts the posts our crawler read for each account from August 1 to September 25, 2026, so an account with no posts in our data may have posts we did not read.
- Posting pace and growth are a correlation, and this study cannot show that posting causes growth.
- The time to 10K holds one month's rate constant, while real accounts grow in bursts and change pace.
- Our country and niche labels cover about 1% of this sample, so there is no country table.
- Category is Instagram's own label, set by the account, and covers 32% of the accounts with post data.
- We checked every named account live on Instagram on October 10, 2026, and a spike in this study is not a claim of bought followers.
For engagement by tier, see our Instagram engagement rate benchmarks and the engagement rate calculator. For what tier size means for brand deals, see how many followers you need to get sponsored.
Download the data
The tier, posting pace, tier by posting pace, reel share, category, verified, spike and TikTok tables are in one CSV: instagram-follower-growth-2026.csv. It has one row per group with the number of accounts, the median growth per 30 days, the 25th, 75th and 90th percentile, the share that shrank and the median followers gained. Please cite "Virev, October 2026" and link this page.
Sources
- Instagram Benchmarks by Buffer
- Social media benchmarks: 2026 data + tips
- Instagram Growth Rate Benchmark
- Average Instagram Follower Growth Rate in 2026
- Jung Hae-in Proves Acting Range in 'Our Sticky Love'
- A rainy night living in our motorhome on a foggy peninsula
- Glowing ghost lights from plastic bottles