



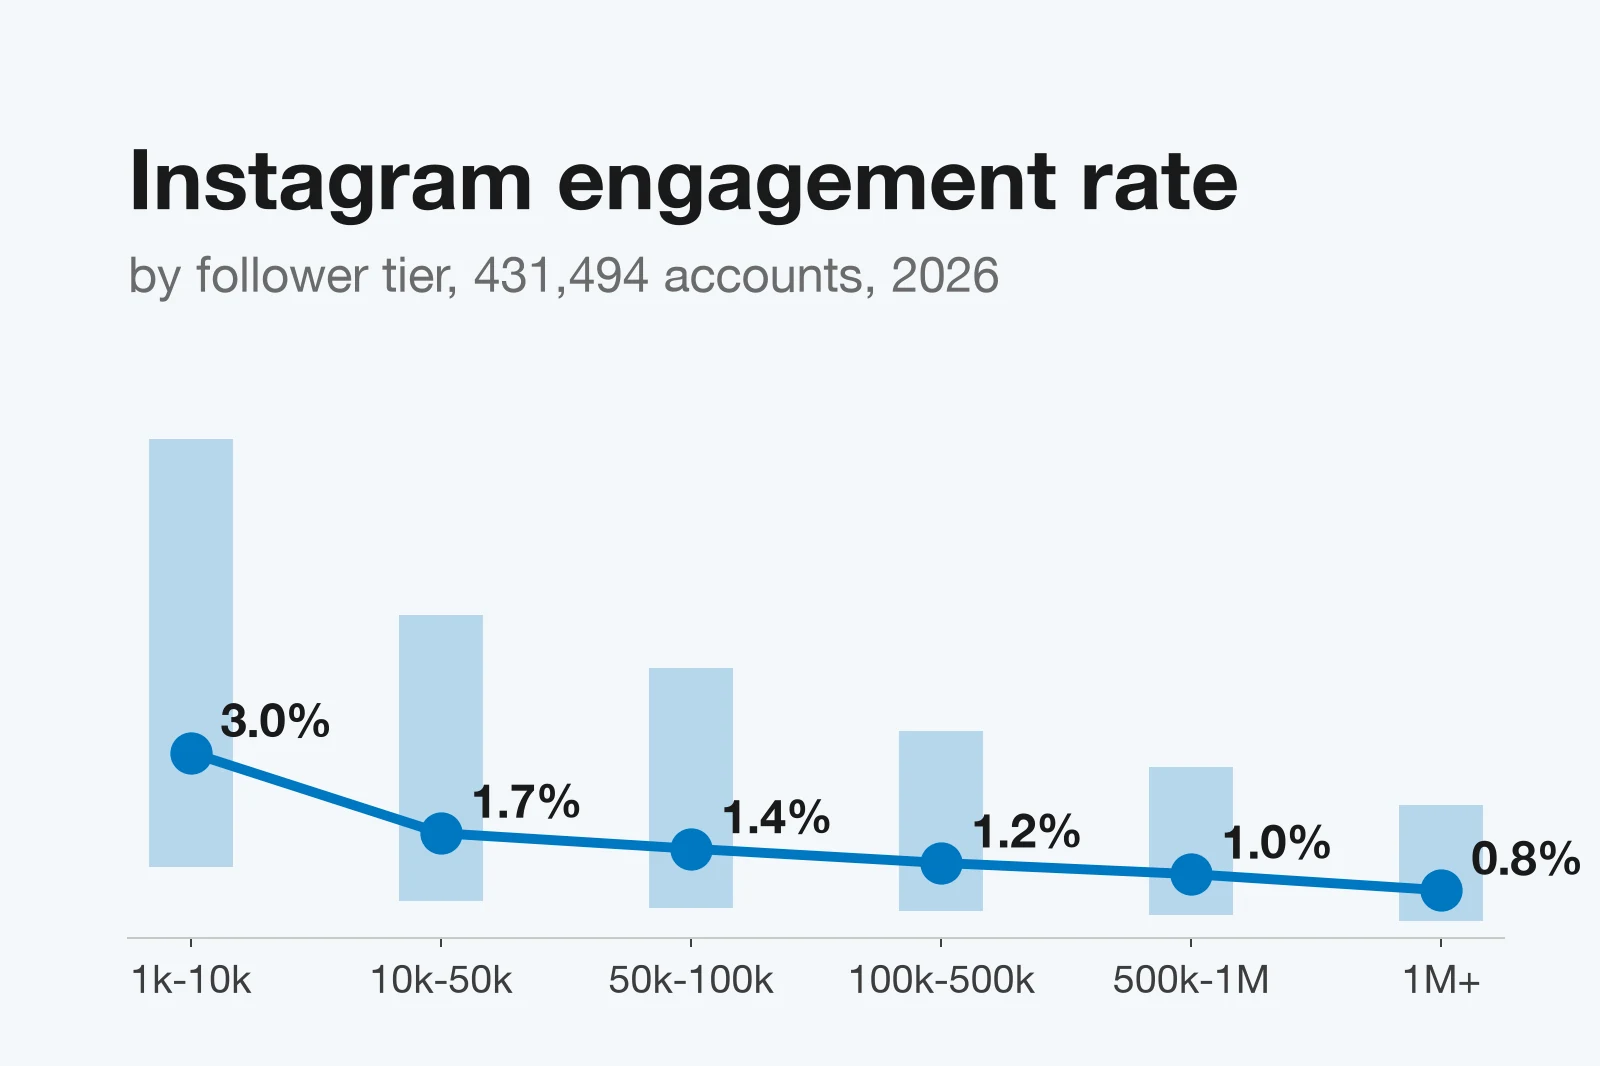
The median Instagram engagement rate is 1.89% for public accounts with 1,000 or more followers. We measured it on 431,494 accounts that Virev's crawler read between July and October 2026, using likes plus comments on each account's 12 most recent posts, divided by followers. The rate falls as accounts grow: 2.99% for accounts with 1k to 10k followers, 0.77% for accounts above 1 million.
A good engagement rate depends on the tier. An account above its tier median is ahead of half its peers. An account above the 75th percentile is in the top quarter. Both lines are in the table below.
431,494
Instagram accounts
4.8M
Posts measured
1.89%
Median engagement rate
Instagram engagement rate by follower count
| Followers | Accounts | 25th percentile | Median | 75th percentile | Share above 3% |
|---|---|---|---|---|---|
| 1k to 10k | 159,262 | 1.15% | 2.99% | 8.04% | 50% |
| 10k to 50k | 126,791 | 0.59% | 1.69% | 5.21% | 36% |
| 50k to 100k | 47,735 | 0.48% | 1.44% | 4.36% | 33% |
| 100k to 500k | 63,461 | 0.43% | 1.21% | 3.33% | 27% |
| 500k to 1M | 17,467 | 0.37% | 1.03% | 2.76% | 23% |
| 1M+ | 16,778 | 0.27% | 0.77% | 2.14% | 18% |
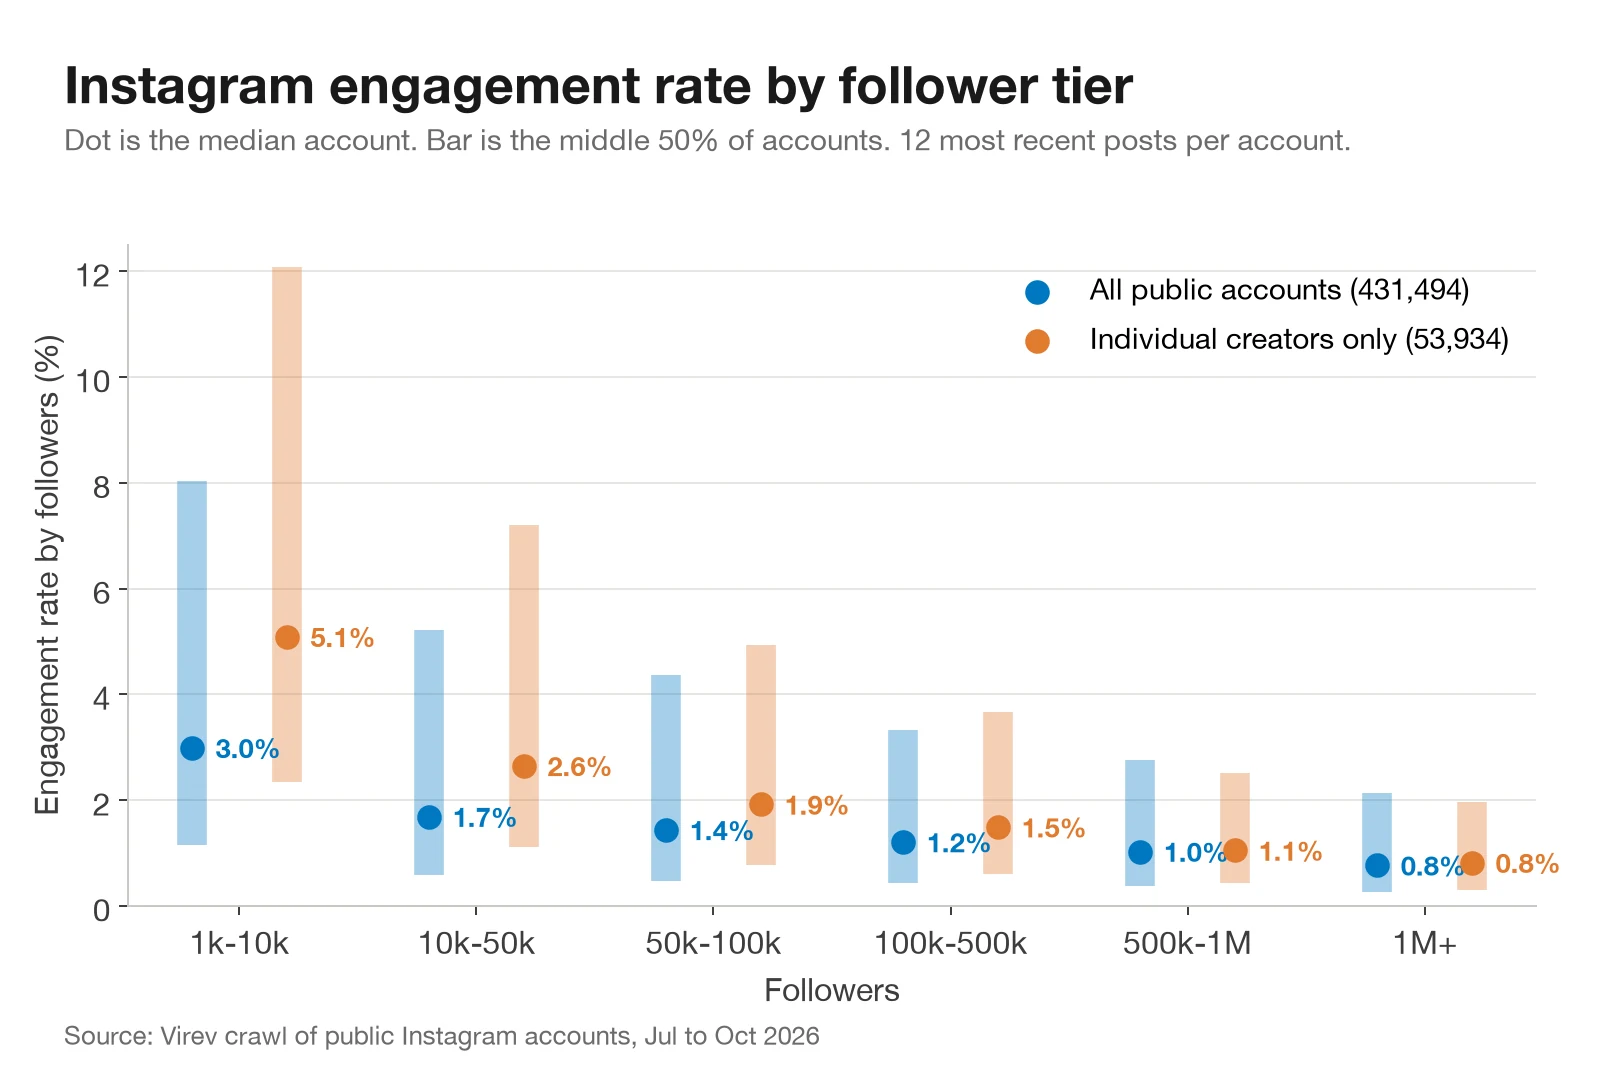
The spread inside each tier is wide. At 10k to 50k followers, the middle half of accounts runs from 0.59% to 5.21%, a factor of nine. A single average hides that. Published "average engagement rate" figures also disagree with each other, partly because each one averages a different mix of accounts.
Those other numbers come from other samples. Sprout Social's tier table (2.19% for 1k to 10k, 0.94% above 1 million) gives one number per tier, with no spread. Buffer's 27 million posts come from 273,000 accounts that publish through Buffer's scheduling tool. Rival IQ's widely quoted 0.36% median is for brand accounts only. Our sample is every public account the Virev crawler read in the window, creators and brands together, and we can split them.
Creators against brand accounts
Of the 431,494 accounts, 106,824 have a Virev creator profile that says what kind of account it is. Individual creators earn 2.4 times the rate of brand and business accounts at 1k to 10k followers, and 5 times the rate above 1 million.
| Followers | Individual creators, median | Brands and businesses, median |
|---|---|---|
| 1k to 10k | 5.09% | 2.15% |
| 10k to 50k | 2.65% | 0.92% |
| 50k to 100k | 1.92% | 0.57% |
| 100k to 500k | 1.49% | 0.41% |
| 500k to 1M | 1.05% | 0.26% |
| 1M+ | 0.82% | 0.16% |
The creator rows come from 53,934 individual creators and the brand rows from 37,728 brand and business accounts. If you compare an influencer against brand benchmarks such as Rival IQ's 0.36%, almost every creator looks excellent. Compare creators with creators.
Average post against typical post
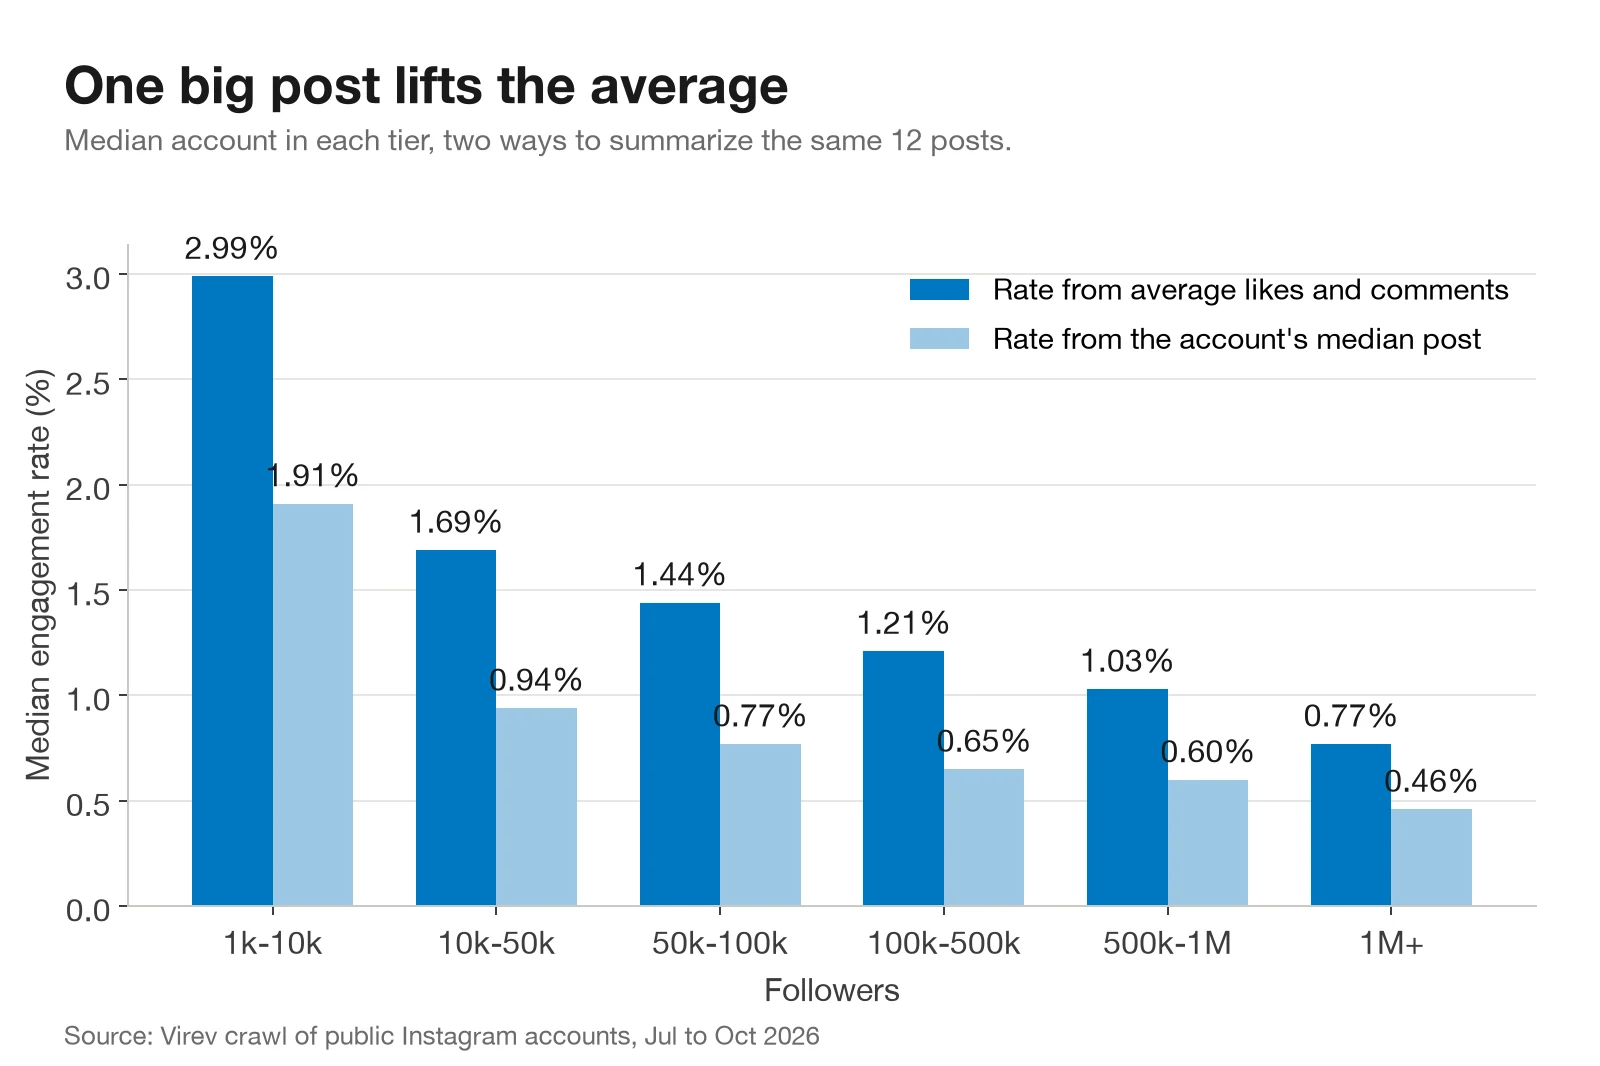
The standard formula averages likes and comments across recent posts. One post that spreads far beyond the account's followers pulls that average up. In every tier, the rate built from the account's median post is 53% to 64% of the rate built from the average.
Worked example: Khaby Lame
Khaby Lame (@khaby00) had 78,071,087 Instagram followers when we read the account on August 31, 2026. His 12 most recent posts at least three days old were all Reels, posted between July 9 and August 25.
- Add the likes on the 12 posts: 14,642,665. Divide by 12: 1,220,222 average likes.
- Add the comments: 106,044. Divide by 12: 8,837 average comments.
- Add the two averages: 1,229,059 interactions per post.
- Divide by followers and multiply by 100: 1,229,059 / 78,071,087 × 100 = 1.57%.
That puts him at the 69th percentile of accounts above 1 million followers. Now look at the posts one by one. The Reel from August 25 earned 6,466,226 likes and 204 million views, more than the next three posts together. Drop it and the average for the other 11 posts gives 0.96%. The median post gives 0.79%.
Both numbers are correct. They answer different questions. The average tells you what the account produced over the period. The median tells you what one sponsored post is likely to get if it does not break out. When you price one post, the median is closer to what you will receive.
Engagement rate by category
Virev's creator profiles assign each creator a primary niche. We grouped them into 19 categories and compared creators with 10k to 100k followers, so every row covers the same follower band.
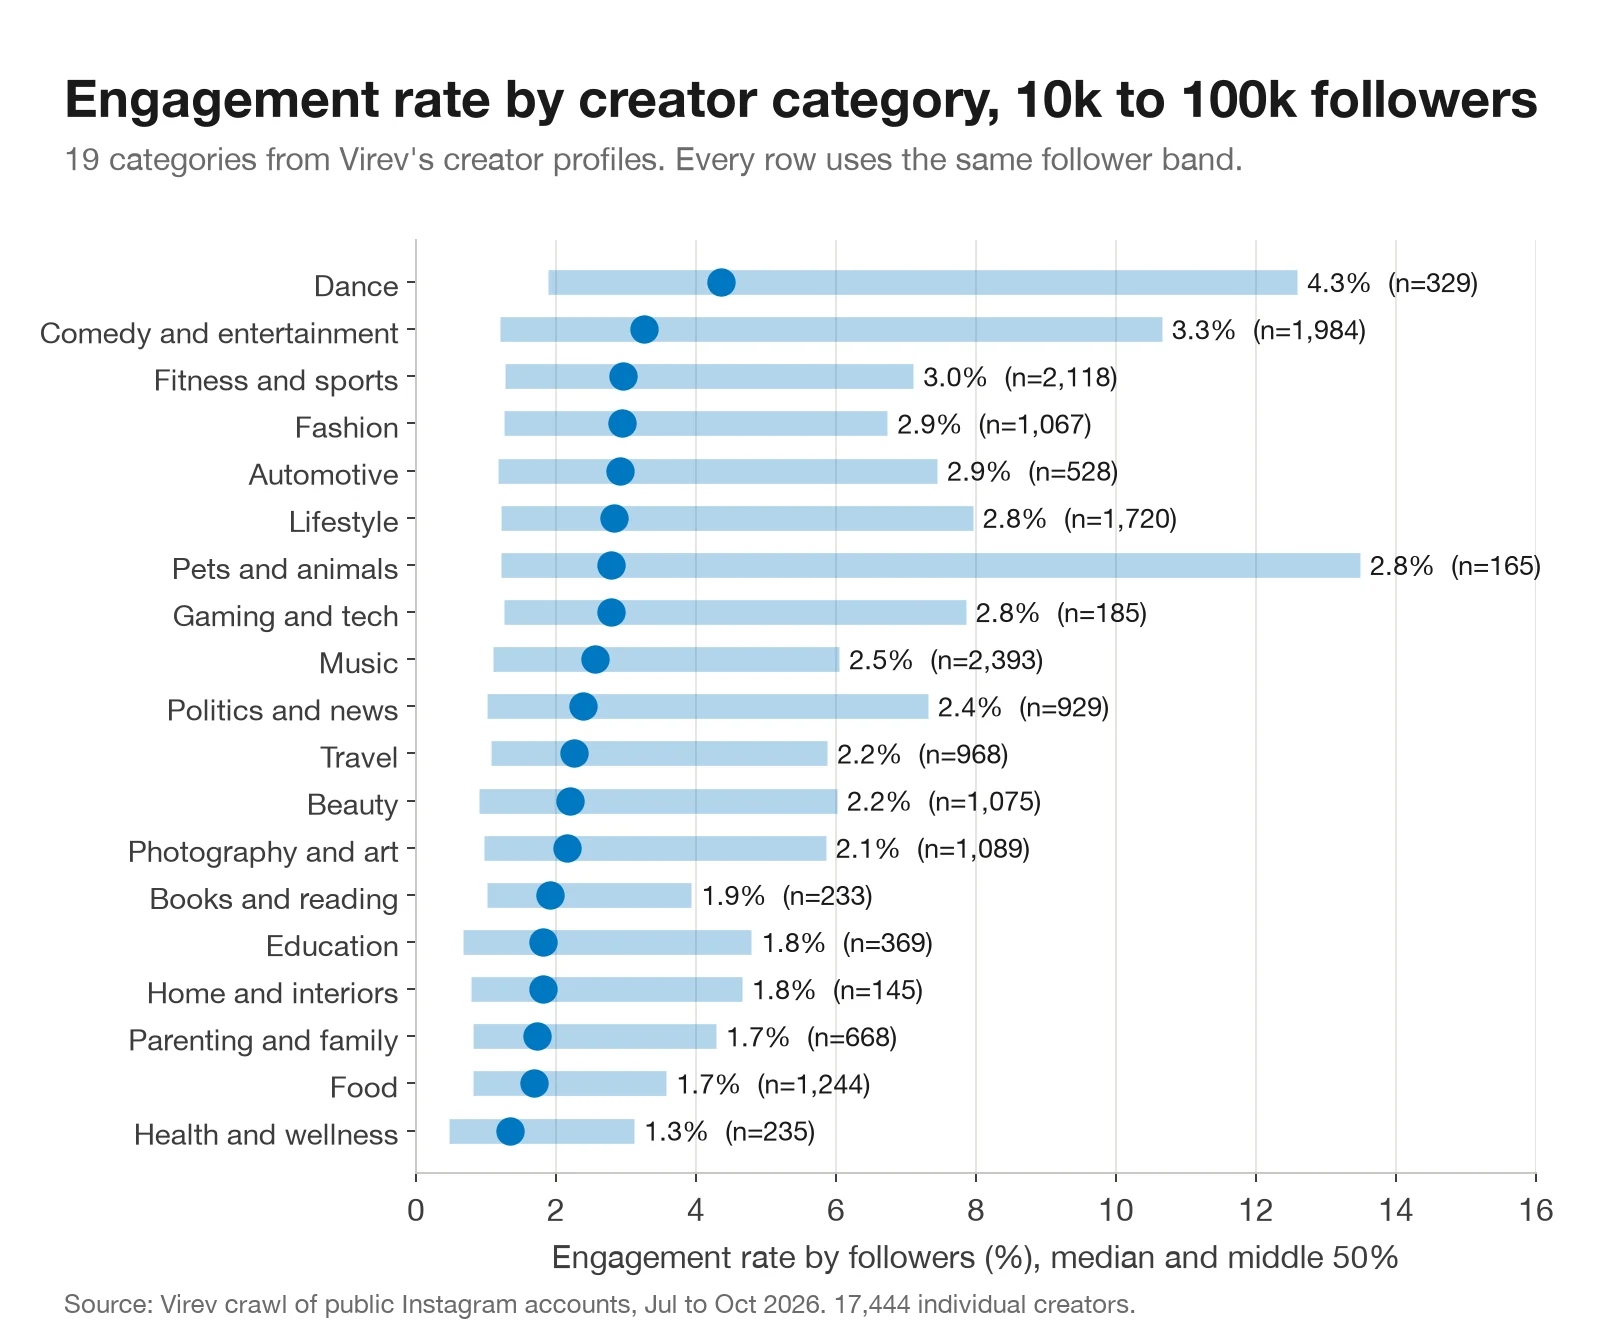
Dance, comedy and fitness creators sit at the top. Food, parenting, home and health creators sit at the bottom, at less than half the rate of dance creators. Beauty, at 2.20%, is close to the middle. The order holds in the 1k to 10k band too: dance 9.92%, health and wellness 2.93%.
This matters when a brief mixes categories. A food creator at 1.7% is at the category median. A dance creator at 1.7% is in the bottom quarter of dance creators.
Reels views against likes
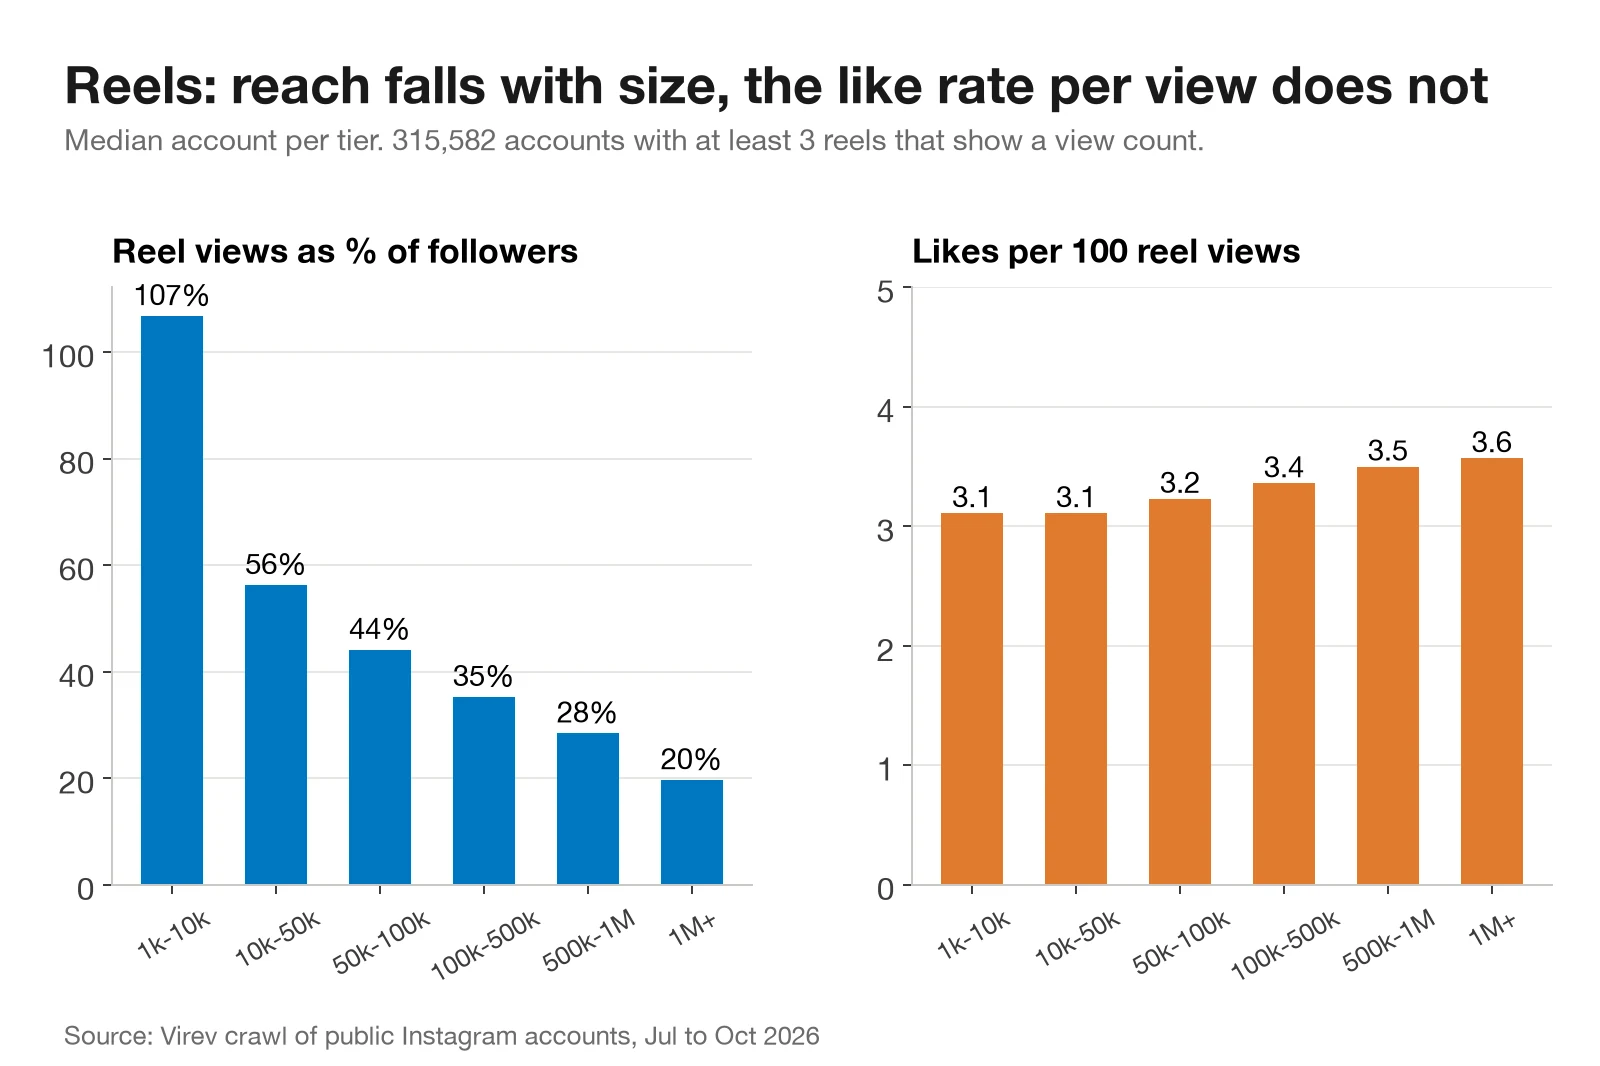
For 315,582 accounts with at least three Reels that show a view count, we compared Reel views with followers and with likes.
Two patterns stand out:
- Reach per follower falls with size. The median account with 1k to 10k followers gets 107 Reel views for every 100 followers. Above 1 million followers it gets 20.
- The like rate per view barely moves. The median Reel gets 3.1 likes per 100 views at 1k to 10k followers and 3.6 above 1 million.
So a large account's lower engagement rate is mostly a reach effect: a smaller share of followers sees each Reel. People who do see it like it at about the same rate. Reel view counts are public, so you can check likes per view yourself before you ask for insights. About 3 likes per 100 views is the median. Khaby Lame's Reels ran at 3.3.
Named accounts against their tier
All of these accounts have more than 1 million followers, where the tier median is 0.77% and the top quarter starts at 2.14%. Numbers are from our crawl in July to September 2026, 12 recent posts each.
| Account | Followers | Engagement rate | Percentile in the 1M+ tier |
|---|---|---|---|
| Lionel Messi (@leomessi) | 516.3M | 2.77% | 80th |
| Cristiano Ronaldo (@cristiano) | 679.7M | 1.89% | 72nd |
| Khaby Lame (@khaby00) | 78.1M | 1.57% | 69th |
| Zach King (@zachking) | 31.7M | 1.21% | 62nd |
| Kylie Jenner (@kyliejenner) | 381.3M | 0.63% | 44th |
| Gordon Ramsay (@gordongram) | 19.5M | 0.16% | 15th |
Follower count does not predict where an account lands. Cristiano Ronaldo has 35 times Gordon Ramsay's followers and 12 times his engagement rate. Gordon Ramsay's rate also fits the category pattern above: food creators sit near the bottom in both follower bands we compared.
TikTok engagement rate by follower count
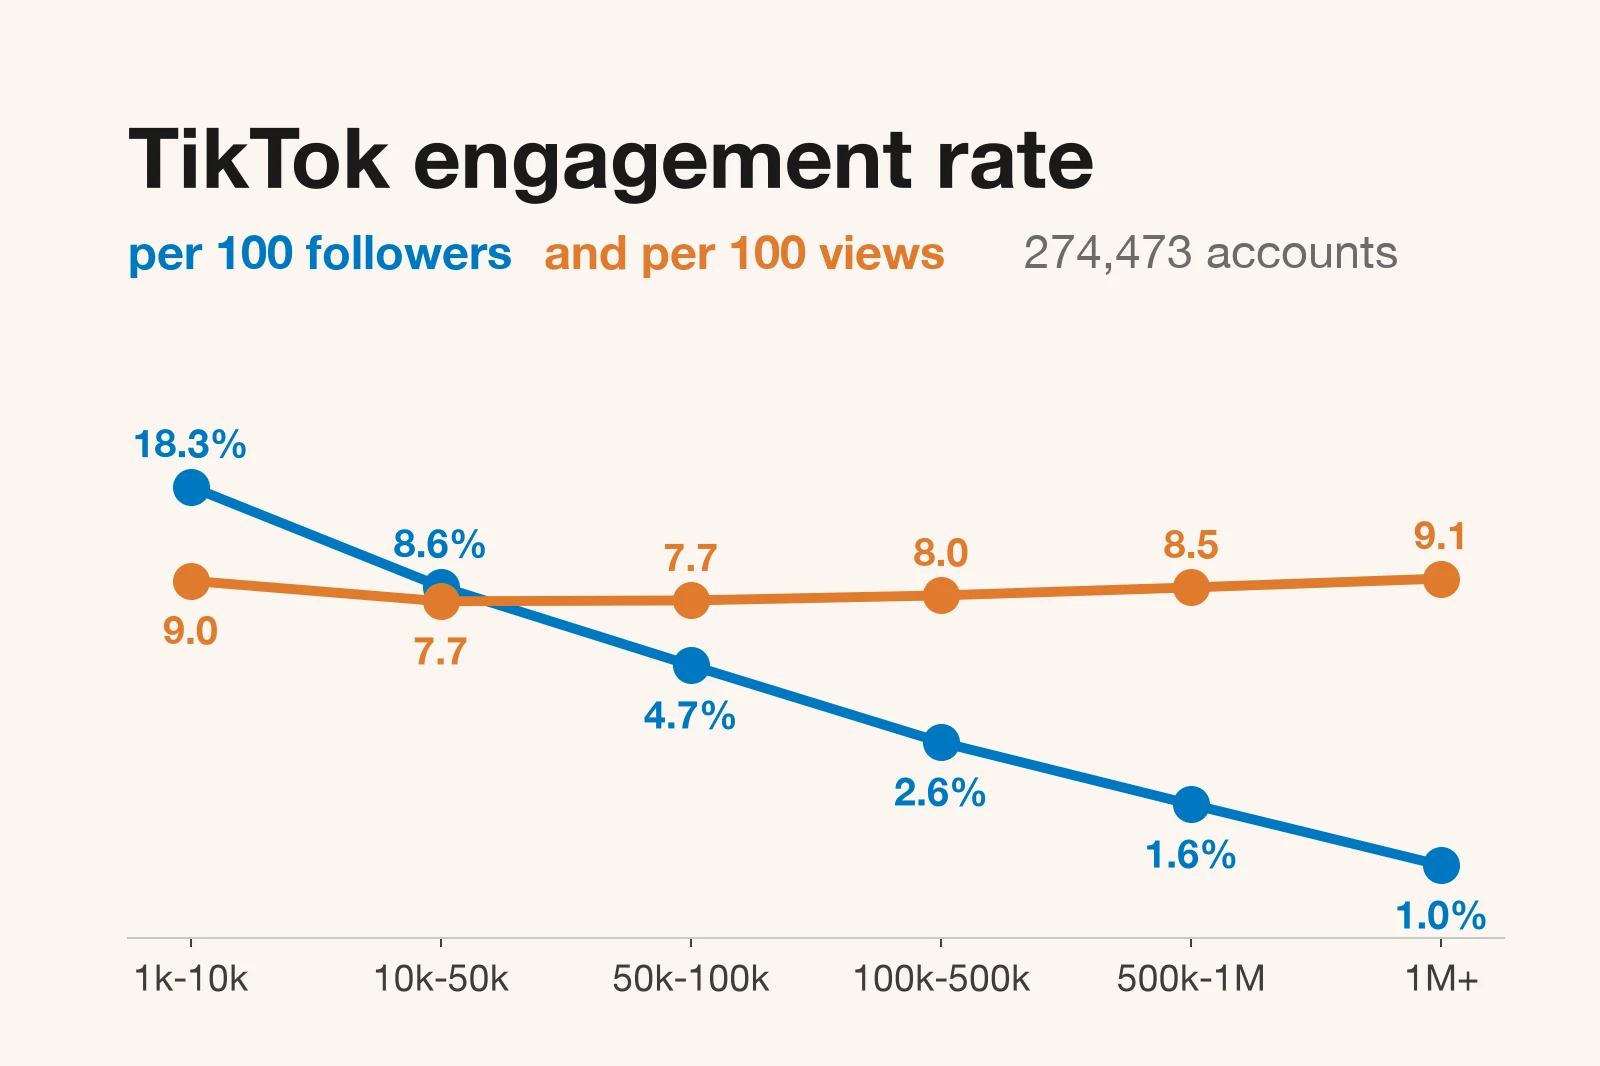
We ran the same method on 274,473 public TikTok accounts with 1,000 or more followers, read in the same window: up to 12 videos per account, at least three days old, 3.2 million videos in total. TikTok shows shares publicly, so the TikTok rate is likes plus comments plus shares, divided by followers.
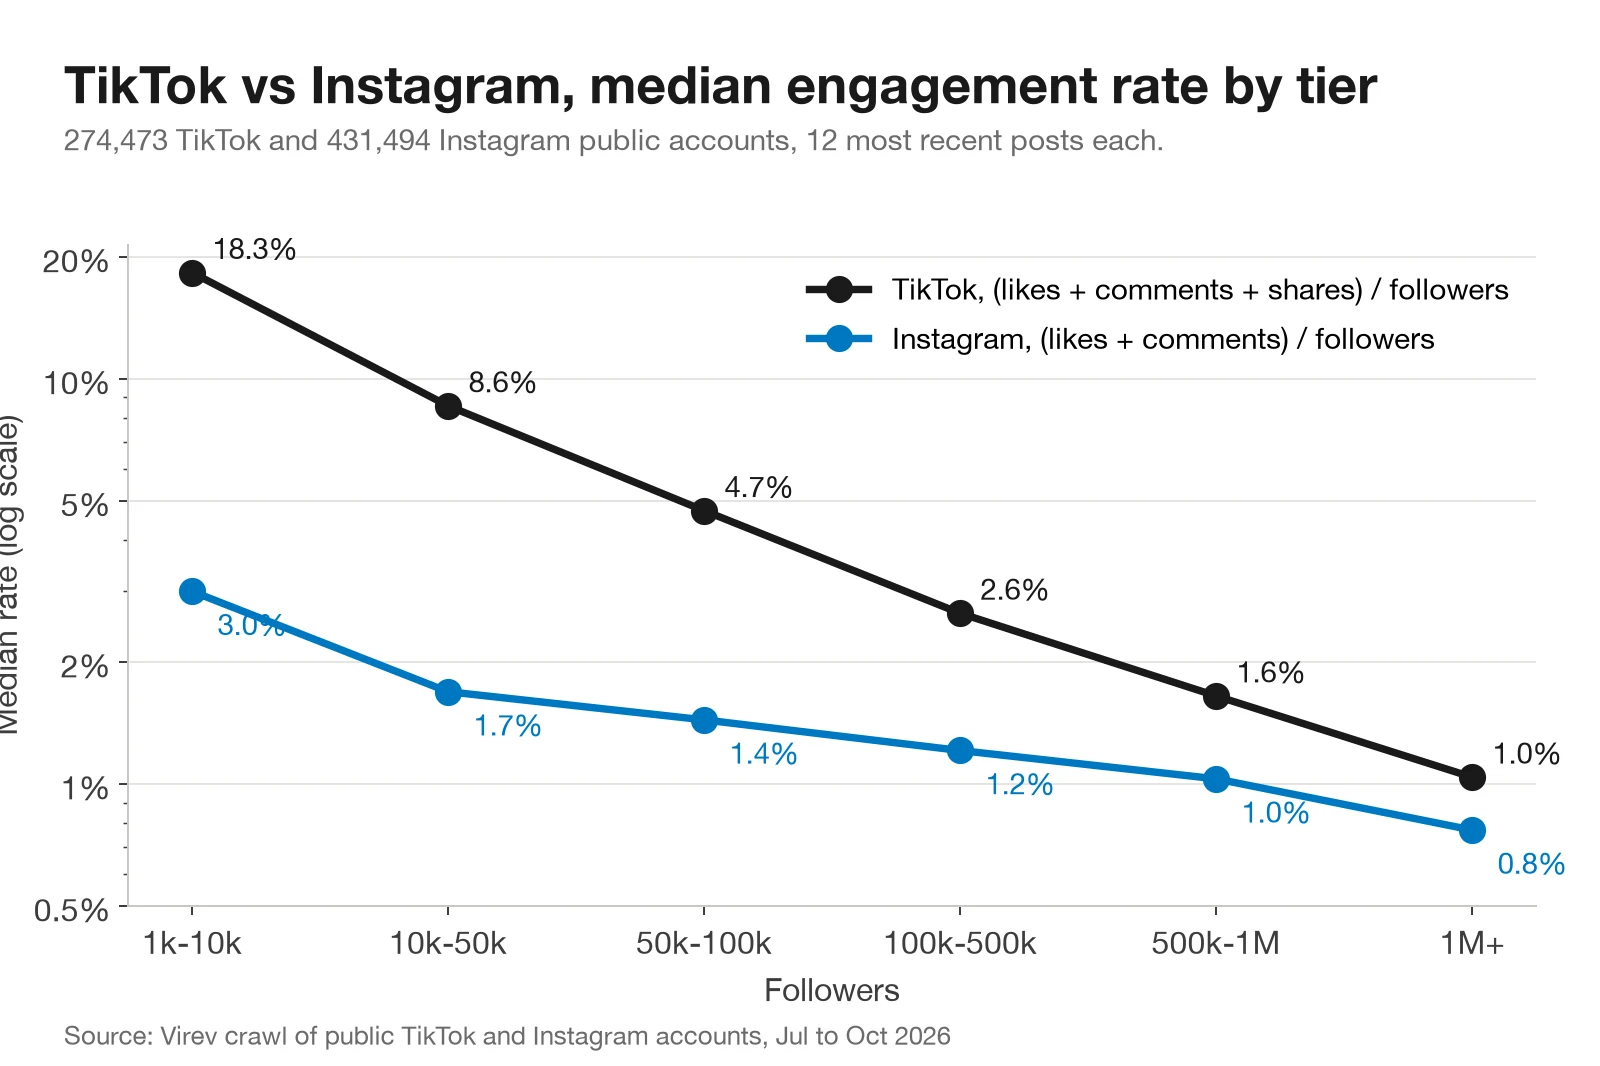
| Followers | Accounts | Median rate | Views per 100 followers | Engagements per 100 views |
|---|---|---|---|---|
| 1k to 10k | 95,719 | 18.30% | 61 | 9.0 |
| 10k to 50k | 67,857 | 8.58% | 32 | 7.7 |
| 50k to 100k | 26,420 | 4.73% | 20 | 7.7 |
| 100k to 500k | 50,600 | 2.64% | 13 | 8.0 |
| 500k to 1M | 14,496 | 1.65% | 8 | 8.5 |
| 1M+ | 19,381 | 1.04% | 6 | 9.1 |
All three columns are medians across accounts. The views column uses each account's median video, not its average.
On TikTok, a follower-based rate tells you less. The For You feed shows videos to people who do not follow the account, so a small account with one viral video can post a rate above 100%. A quarter of 1k to 10k accounts were above 144%. Engagement per view is the steadier measure: the median sits between 7.7 and 9.1 engagements per 100 views in every tier.
Averages mislead even more on TikTok. Gordon Ramsay's account (@gordonramsayofficial, 40.7M followers) averaged 11.5 million plays across 12 videos, but the median video had 466,250. One video from June 19 shows 127.2 million plays and 40,300 likes, 0.03 likes per 100 plays, while his other 11 videos ran between 2.1 and 8.0. The public numbers do not say why that video's plays and likes diverge, so we do not guess. A view total of that shape is a reason to ask the creator for the video's analytics before you count it.
MrBeast (@mrbeast, 136.5M followers) is the high outlier: 6.04% by followers, above 90% of accounts with more than 1 million followers. For TikTok rates per view, the effect of viral videos, comment and share ratios and TikTok categories, see our TikTok engagement rate benchmarks.
What this means when you pick creators
- Compare within the tier. A 1.5% rate is below the median at 10k to 50k followers and in the top third above 1 million. Use the table at the top.
- Compare within the category. Food, parenting, home and health creators run at 40% to 55% of the rate of dance and comedy creators of the same size.
- Ask for the median post. If one post carries the average, price the deal on the typical post. Khaby Lame's 1.57% average rested on a 0.79% median post.
- Use views when you have them. For Reels, about 3 likes per 100 views is the median at every size. On TikTok, about 8 engagements per 100 views.
- Do not use brand benchmarks for creators. Brand accounts run at less than half of creator rates in the same tier, and at a fifth above 1 million followers.
For the formula choices behind these rules, see how to calculate engagement rate with the right denominator. For accounts with numbers that look wrong, see how to audit suspicious engagement.
Virev creator search shows these numbers for each creator, so you can filter Instagram and TikTok creators by follower count, category and engagement rate before you contact anyone.
How we measured
- Accounts. Every public Instagram account with at least 1,000 followers that the Virev crawler read between July 1 and October 1, 2026, and that had at least six usable posts. 431,494 accounts.
- Posts. Up to the 12 most recent posts per account from the account's own feed, posted within 180 days of the read and at least three days old when read, so likes had time to settle. Pinned posts and posts with hidden like counts were left out. 4,816,706 posts, published between February 20 and September 27, 2026.
- Formula. Engagement rate = (average likes + average comments) / followers × 100, per account. Tier figures are the median and quartiles across accounts, never a mean across accounts, because a few viral accounts would pull a mean far up. The mean for 1k to 10k accounts is 15.2%, five times the median.
- Creators and categories. Virev's creator profiles classify accounts as individual creators, brands, businesses or media, and assign a primary niche. 106,824 of the accounts have one. Unclassified accounts count in the all-accounts table only.
- Reels. View counts are Instagram's public play counts on Reels. Likes per view uses accounts with at least three Reels that show a count.
- TikTok. The same rules, using the account's read date for the three-day cut. Shares count as engagement.
- Limits. Saves and shares are not public on Instagram, so they are not in the Instagram rate. Follower counts are from the same read as the posts. The sample is the set of accounts Virev crawls, which leans toward accounts that brands search for and is not a random draw from all of Instagram.
Sources
- Instagram engagement rate: formula, tips and benchmarks
- What is a good Instagram engagement rate? Data from 27 million+ Instagram posts
- Average engagement rates for 12 industries
- What is a good engagement rate on Instagram?
- 2026 Instagram organic engagement benchmarks
- Instagram engagement rate, formula and benchmarks