



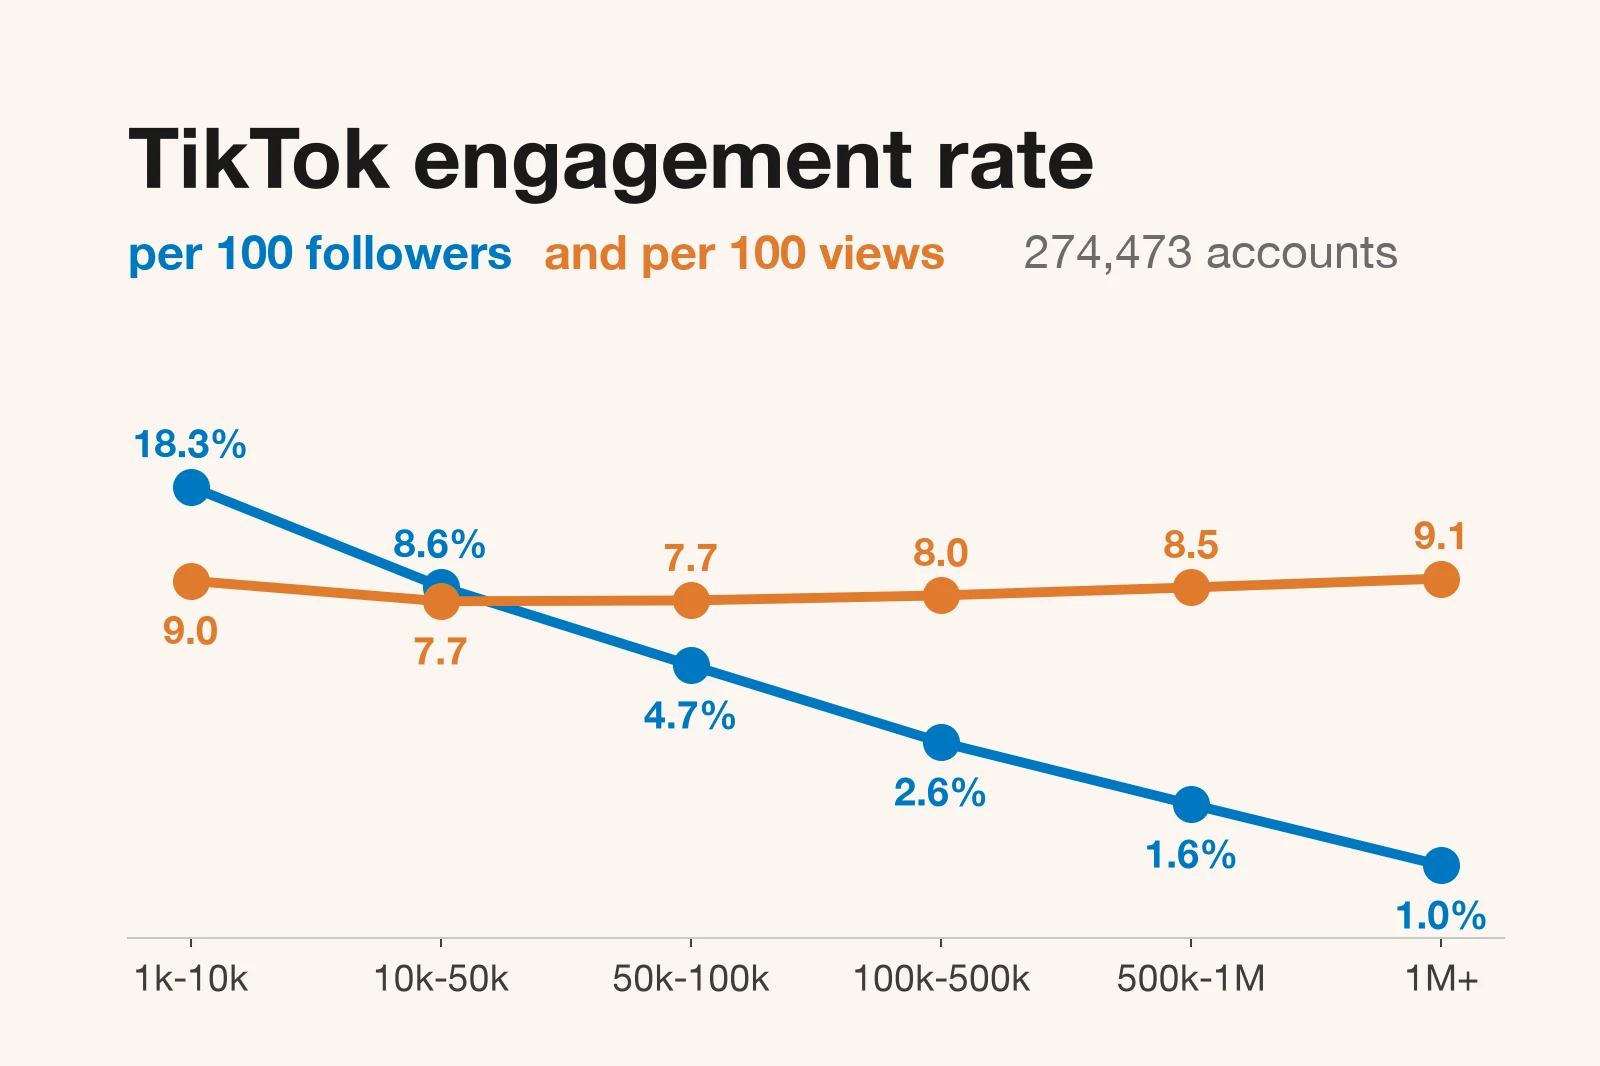
The median TikTok engagement rate is 5.70% for public accounts with 1,000 or more followers. We measured it on 274,473 accounts that Virev's crawler read between August 13 and October 1, 2026, using likes plus comments plus shares on each account's 12 most recent videos, divided by followers. The rate falls fast as accounts grow: 18.30% at 1k to 10k followers, 1.04% above 1 million.
Measured per view, the picture changes. The median account earns 8.3 likes, comments and shares for every 100 views, and every follower tier sits between 7.7 and 9.1. On TikTok most views come from the For You feed, not from followers, so the per-view rate is the steadier number to compare creators with.
274,473
TikTok accounts
3.2M
Videos measured
8.3
Engagements per 100 views
TikTok engagement rate by follower count
| Followers | Accounts | 25th pct | Median | 75th pct | Median video |
|---|---|---|---|---|---|
| 1k to 10k | 95,719 | 3.66% | 18.30% | 143.81% | 4.27% |
| 10k to 50k | 67,857 | 1.64% | 8.58% | 38.79% | 1.86% |
| 50k to 100k | 26,420 | 1.07% | 4.73% | 17.66% | 1.25% |
| 100k to 500k | 50,600 | 0.69% | 2.64% | 8.46% | 0.87% |
| 500k to 1M | 14,496 | 0.50% | 1.65% | 4.45% | 0.63% |
| 1M+ | 19,381 | 0.34% | 1.04% | 2.70% | 0.45% |
The first three rate columns use the standard formula, which divides average likes, comments and shares across 12 videos by followers. The last column uses each account's median video instead of the average. Both are medians across accounts.
A good TikTok engagement rate by followers is one above the median for the tier, and the top quarter starts at the 75th percentile. At 10k to 50k followers that means 8.58% to beat half the accounts and 38.79% to reach the top quarter. The spread is wide. At 1k to 10k followers, the middle half of accounts runs from 3.66% to 143.81%.
By followers or by views
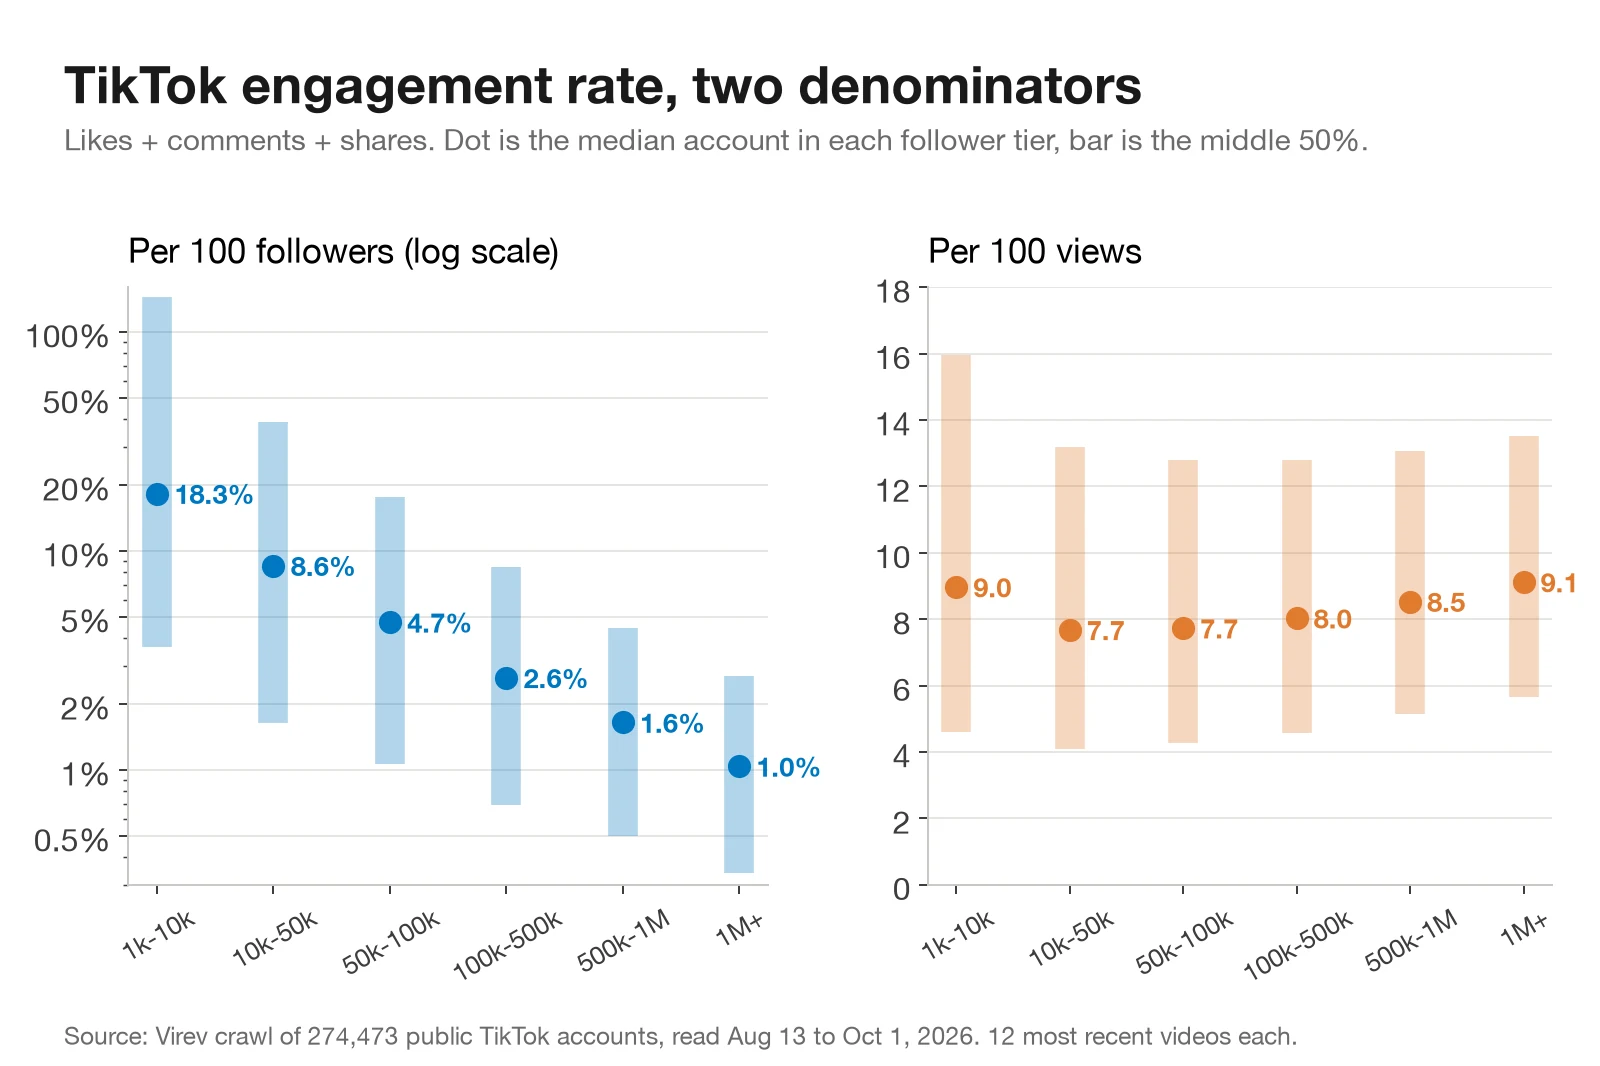
TikTok shows each video's view count, so you can divide engagement by views as well as by followers. The two methods give different answers.
| Followers | Views per 100 followers | 25th pct | Median | 75th pct |
|---|---|---|---|---|
| 1k to 10k | 61 | 4.6 | 9.0 | 16.0 |
| 10k to 50k | 32 | 4.1 | 7.7 | 13.2 |
| 50k to 100k | 20 | 4.3 | 7.7 | 12.8 |
| 100k to 500k | 13 | 4.6 | 8.0 | 12.8 |
| 500k to 1M | 8 | 5.1 | 8.5 | 13.1 |
| 1M+ | 6 | 5.7 | 9.1 | 13.5 |
The last three columns are engagements per 100 views. The views column uses each account's median video. The median account with 1k to 10k followers gets 61 views per 100 followers on a typical video. Above 1 million followers it gets 6. People who see a video engage with it at about the same rate at every size. What changes is how many of the followers see it.
This is why small TikTok accounts post follower-based rates that look impossible. 29% of accounts with 1k to 10k followers have a rate above 100%, and 77% of them had at least one video in their last 12 with more views than the account has followers. Above 1 million followers, 26% had such a video.
To compare any creator, use per-view numbers. About 8 engagements per 100 views is the median. Below about 4 to 6 is the bottom quarter, and above about 13 to 16 is the top quarter, depending on the tier.
How a few viral videos skew the average
The standard formula averages 12 videos. On TikTok, one video often gets more views than the other 11 together. In the median account, the most-viewed video holds 31% to 40% of all views across the 12 videos, depending on the tier. In 39% of accounts with 1k to 10k followers, one video holds more than half.
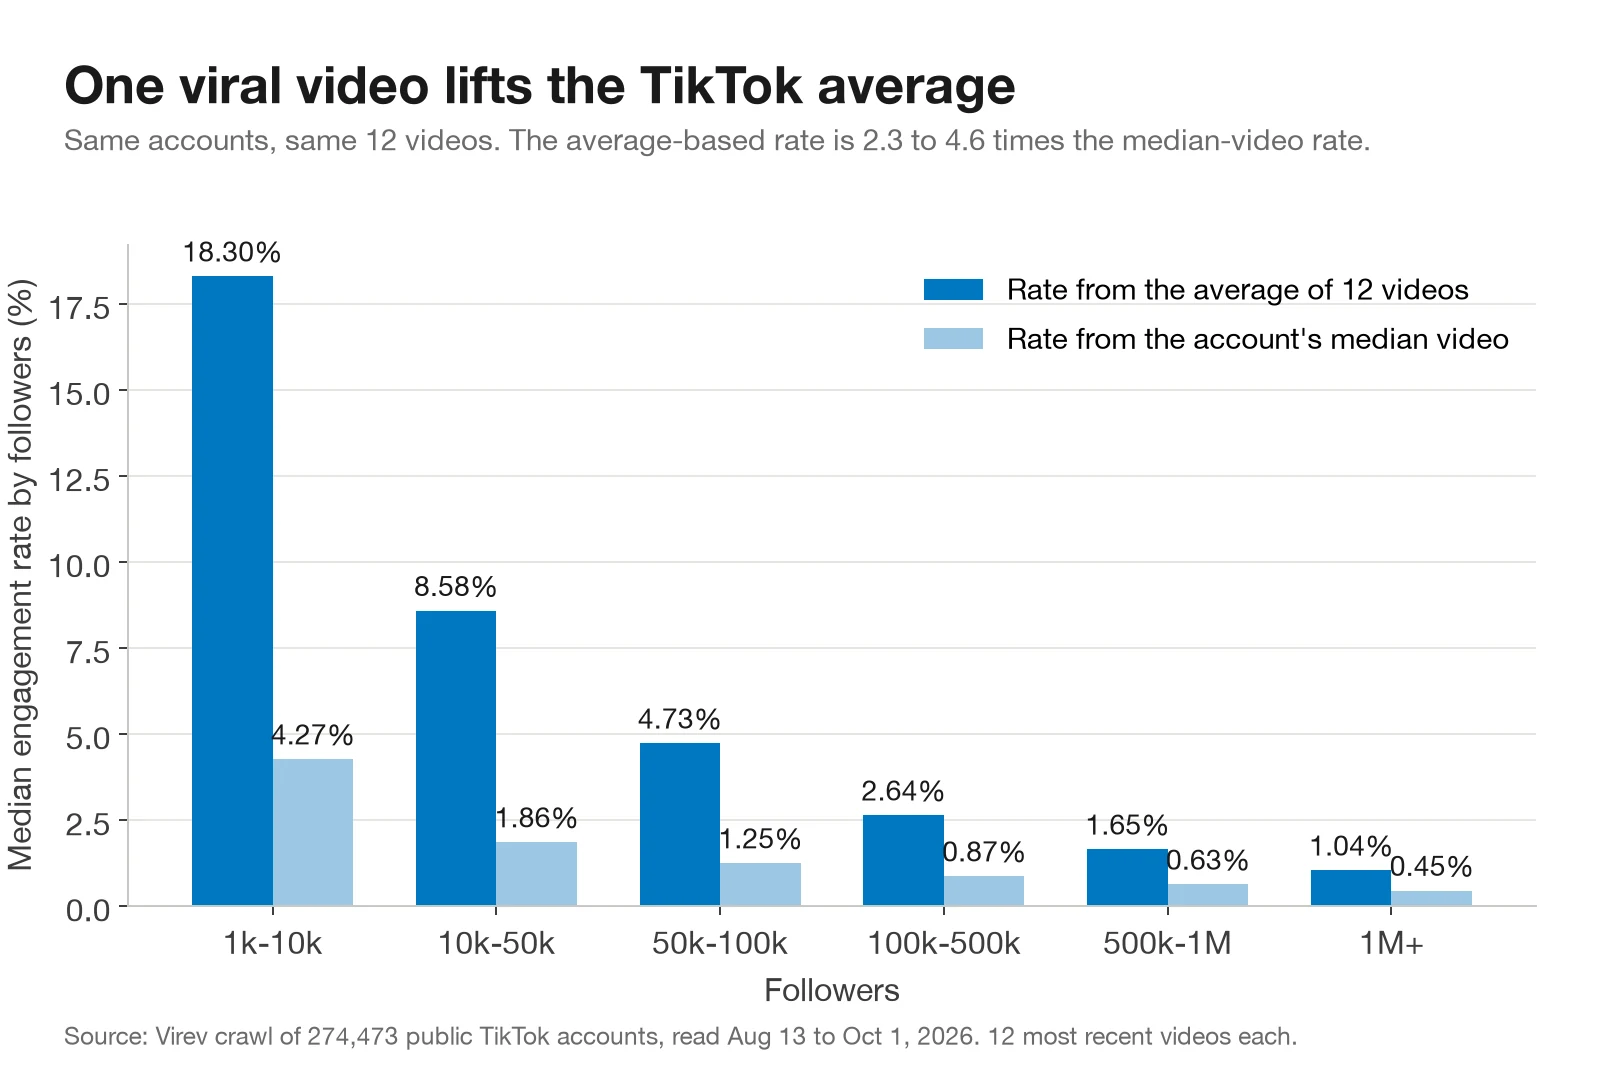
The same effect pulls up any mean across accounts. The mean follower-based rate for accounts with 1k to 10k followers is 283%, about 15 times the median. That is why this article reports medians and quartiles, never means.
MrBeast's 12 videos
MrBeast (@mrbeast) had 136,461,157 TikTok followers when we read the account on August 13, 2026. His 12 most recent videos at least three days old were posted between June 12 and August 9.
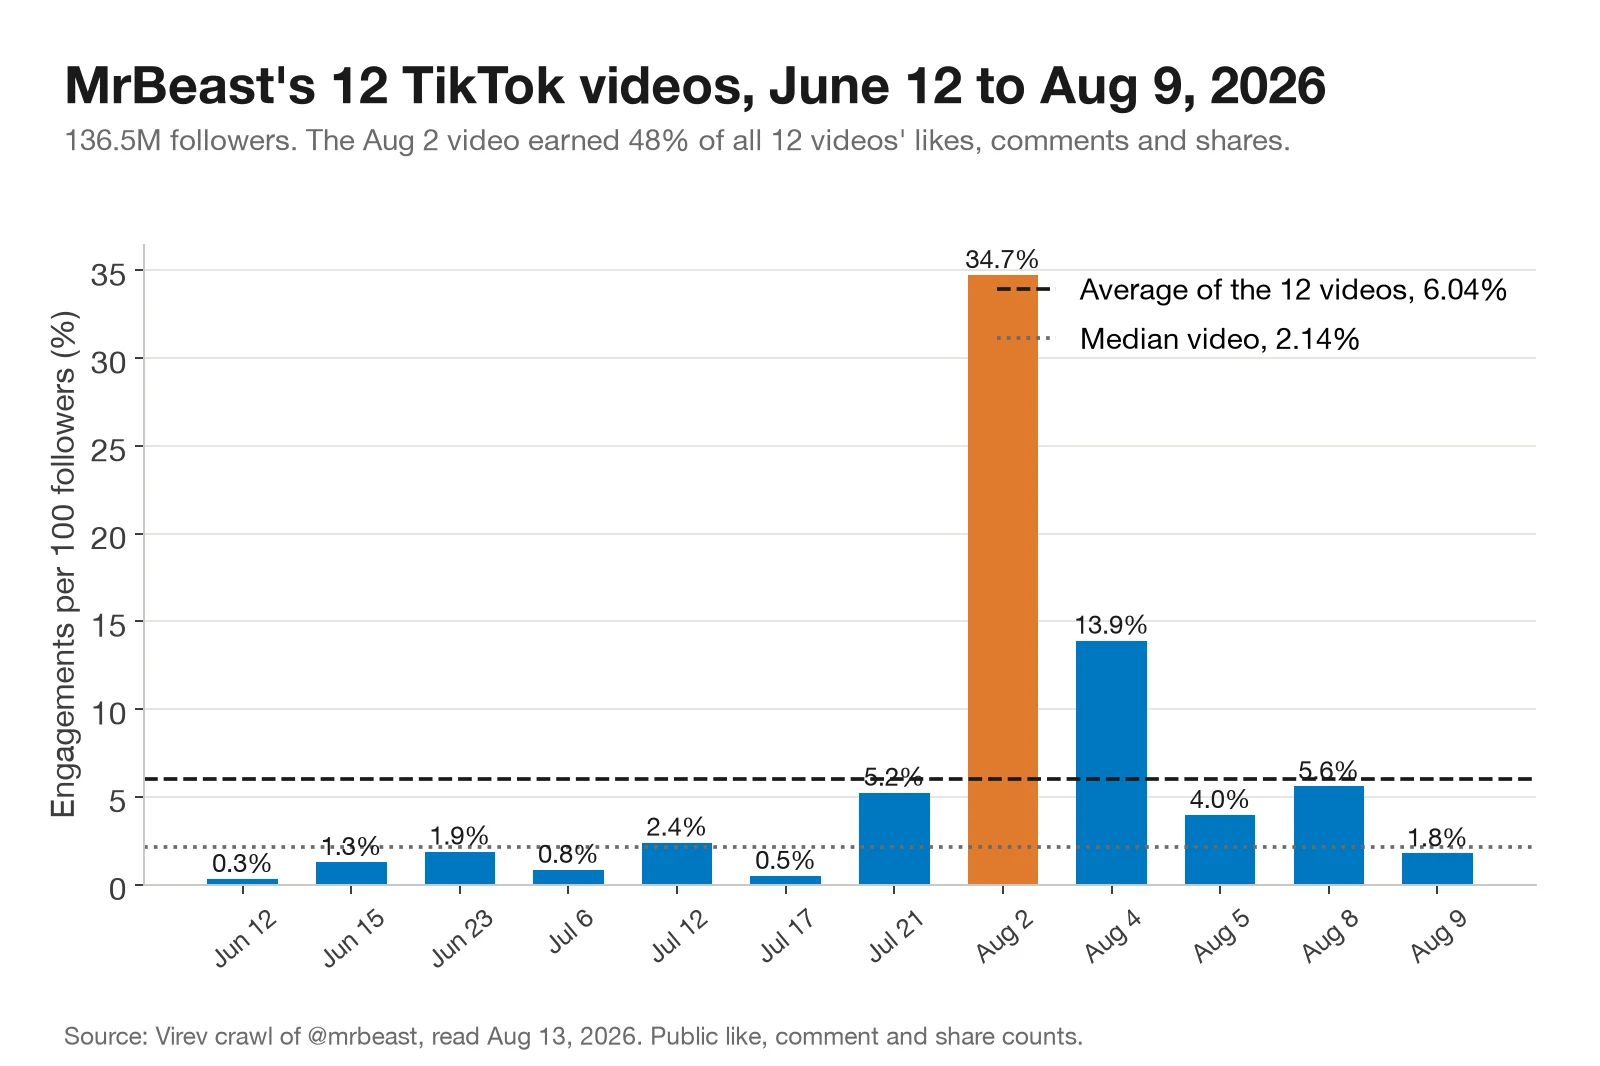
His average rate is 6.04%, above 90% of accounts with more than 1 million followers. The August 2 video earned 47.4 million likes, comments and shares, 48% of the 12-video total. Drop it and the other 11 average 3.43%. The median video gives 2.14%.
All three numbers are correct. They answer different questions. The average says what the account produced over two months. The median says what one sponsored video is likely to get if it does not break out. When you price a single video, the median is closer to what you will get.
Comments and shares
TikTok shows likes, comments and shares on every video. Saves are not in our data, so they are not in this rate. Likes make up most of the total, so the ratios below are per 1,000 likes.
| Followers | Comments per 1,000 likes | Shares per 1,000 likes |
|---|---|---|
| 1k to 10k | 25 | 57 |
| 10k to 50k | 19 | 54 |
| 50k to 100k | 17 | 49 |
| 100k to 500k | 15 | 43 |
| 500k to 1M | 13 | 38 |
| 1M+ | 11 | 33 |
Both ratios are medians across accounts. On TikTok, shares outnumber comments about 2 to 1 at small sizes and 3 to 1 above 1 million followers. Large accounts get fewer comments per like: 11 per 1,000 likes above 1 million, against 25 at 1k to 10k.
The ratios also depend on the content. Among creators with 10k to 100k followers, food creators get 128 shares per 1,000 likes, the most of any category. Finance and business creators get 29 comments per 1,000 likes, almost three times the rate of beauty creators at 10. MrBeast stands out at the top: 177 shares and 35 comments per 1,000 likes.
A comment count far above these ranges, or a run of short identical comments, is worth a closer look. See how to audit suspicious engagement.
Creators against brand accounts
Virev's creator profiles classify 90,684 of the accounts. By followers, individual creators earn about 3 to 5 times the brand rate. Per view, the gap is 1.4 to 2.5 times.
| Followers | Creators, by followers | Brands, by followers | Creators, per 100 views | Brands, per 100 views |
|---|---|---|---|---|
| 1k to 10k | 71.03% | 14.18% | 8.9 | 3.6 |
| 10k to 50k | 17.25% | 3.52% | 8.3 | 3.6 |
| 50k to 100k | 7.84% | 2.12% | 8.2 | 4.0 |
| 100k to 500k | 4.06% | 0.97% | 8.3 | 4.2 |
| 500k to 1M | 2.25% | 0.72% | 8.6 | 5.4 |
| 1M+ | 1.29% | 0.44% | 9.2 | 6.6 |
The creator rows come from 66,670 individual creators, the brand rows from 8,080 brand and business accounts. Per view, a brand video earns 40% to 72% of what a creator video earns. If you hold a creator to a brand benchmark, such as Hootsuite's industry averages of 0.28% to 0.89%, almost every creator passes.
The creator medians by followers are higher than the all-accounts table. Virev builds creator profiles for accounts that brands search for, and those lean toward accounts with recent hits.
Engagement rate by category
We grouped the primary niche in each creator profile into 21 categories and compared creators with 10k to 100k followers, so every row covers the same follower band.
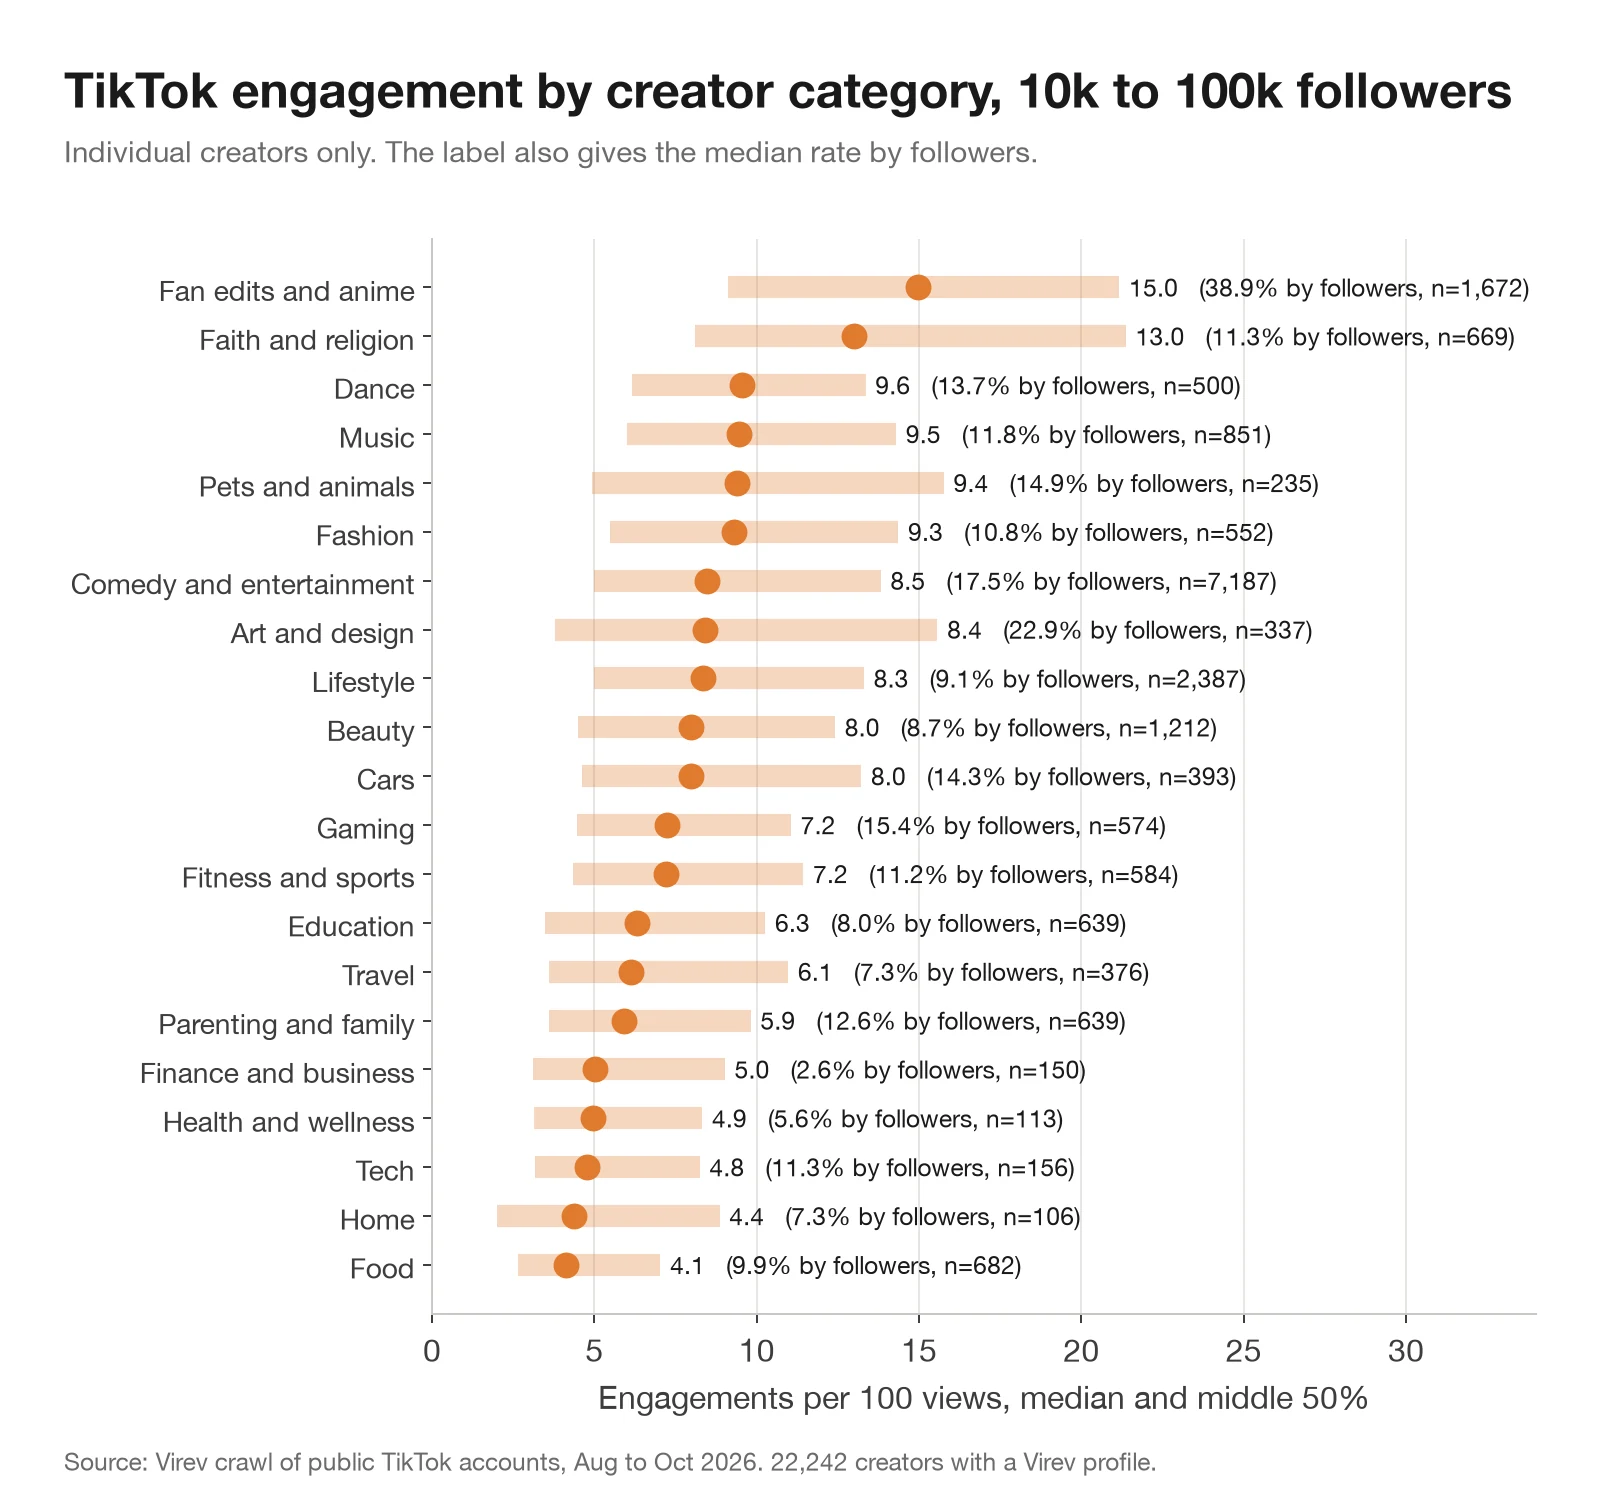
Fan edit and anime accounts lead on both measures: 15.0 engagements per 100 views and 38.9% by followers. Faith and religion accounts are second per view at 13.0. Dance, music, pets and fashion sit near 9.5. Food, home, tech, health and finance sit near 4 to 5, about half the dance rate.
The two measures rank some categories differently. Food creators earn 9.9% by followers, close to the middle, because their videos reach 67 views per 100 followers. Per view they are last at 4.1. Faith and religion accounts reach 18 views per 100 followers, the fewest of any category, but rank second per view. If you judge food creators by followers, they look average. If you judge them by views, they look weak. Compare a creator with others in the same category.
Named accounts against their tier
All of these accounts have more than 1 million followers. In that tier the median is 1.04% by followers and 9.1 per 100 views. Numbers are from our crawl in August 2026, 12 recent videos each. Rank is the percentile within the 1M+ tier.
| Account | Followers | By followers | Median video | Per 100 views | Rank, followers | Rank, views |
|---|---|---|---|---|---|---|
| MrBeast (@mrbeast) | 136.5M | 6.04% | 2.14% | 12.8 | 90th | 72nd |
| Kylie Jenner (@kyliejenner) | 59.8M | 2.75% | 1.79% | 10.9 | 76th | 61st |
| Zach King (@zachking) | 86.8M | 2.48% | 0.88% | 12.3 | 73rd | 69th |
| The Rock (@therock) | 79.8M | 1.14% | 0.14% | 17.9 | 53rd | 89th |
| Khaby Lame (@khaby.lame) | 162.7M | 0.79% | 0.52% | 8.7 | 43rd | 47th |
| Addison Rae (@addisonre) | 87.8M | 0.59% | 0.58% | 7.8 | 36th | 40th |
| Charli D'Amelio (@charlidamelio) | 159.2M | 0.22% | 0.15% | 11.1 | 18th | 62nd |
| Gordon Ramsay (@gordonramsayofficial) | 40.7M | 0.15% | 0.06% | 0.5 | 14th | 1st |
How to calculate TikTok engagement rate
Here is the calculation with Khaby Lame's numbers.
Khaby Lame (@khaby.lame) had 162,674,724 TikTok followers when we read the account on August 19, 2026. His 12 most recent videos at least three days old were posted between July 5 and August 6.
- Add the likes on the 12 videos: 14,715,200. Divide by 12: 1,226,267 average likes.
- Do the same for comments (184,857 in total, 15,405 average) and shares (481,566 in total, 40,131 average).
- Add the three averages: 1,281,802 engagements per video.
- Divide by followers and multiply by 100: 1,281,802 / 162,674,724 × 100 = 0.79%.
For the per-view rate, add the engagements on all 12 videos (15,381,623) and divide by their views (177,300,000). That gives 8.7 engagements per 100 views. By followers he sits at the 43rd percentile of accounts above 1 million. By views he sits at the 47th. Both put him close to the middle of his tier. Any TikTok engagement rate calculator runs one of these two formulas, so check which one before you compare its result with a benchmark. Virev's free TikTok engagement rate calculator runs both on any public account's last 12 videos and shows the percentile from this data for each.
Three accounts where the rates disagree
Charli D'Amelio
Charli D'Amelio has 159.2 million followers and a 0.22% rate by followers, in the bottom fifth of her tier. Her typical video got 2.5 million views, 1.6 views per 100 followers. For every 100 views, her videos got 11.1 likes, comments and shares, above the tier median. The follower rate punishes a 159-million-follower audience that no longer sees every video. The per-view rate shows that the people who do see a video still respond to it.
The Rock
The Rock posted three videos between July 27 and July 29 that earned 87% of the engagement across his 12 videos. His average-based rate is 1.14%, right at the tier median. His median video gives 0.14%, in the bottom third. Per view he is at the 89th percentile, so the videos that are seen do well. For a sponsored video, the 0.14% is the safer planning number until you see a longer history.
Gordon Ramsay
Gordon Ramsay's account averaged 11.5 million views per video, but the median video had 466,250. One video from June 19 shows 127.2 million views and 40,300 likes, 0.03 likes per 100 views, while his other 11 videos ran between 2.2 and 8.5 engagements per 100 views. Without that video his per-view rate is 6.4, close to the 30th percentile. The public numbers do not say why that video's views and likes diverge, so we do not guess. A view count of that shape is a reason to ask the creator for the video's analytics.
How these numbers compare with other benchmarks
Published TikTok benchmarks disagree because they use different formulas and samples.
- SociaVault reports a median of 7.84% at 1k to 10k followers and 1.84% at 500k and above, from 150,000 accounts, with the same formula by followers. Its page does not give dates or the number of videos per account. Below 100k followers, its medians fall between our median-video rate and our average-based rate. Above 100k they sit higher than both.
- TokPortal measures per view on 5,000 accounts and reports medians of 6.29% to 8.44%. That is close to our 7.7 to 9.1 per 100 views.
- Hootsuite gives a 1.5% average as of March 2025 and industry averages from 0.28% for agencies to 0.89% for nonprofits.
- Emplicit quotes The Influencer Marketing Factory: 7.50% below 100k followers and 2.88% above 10 million, as averages.
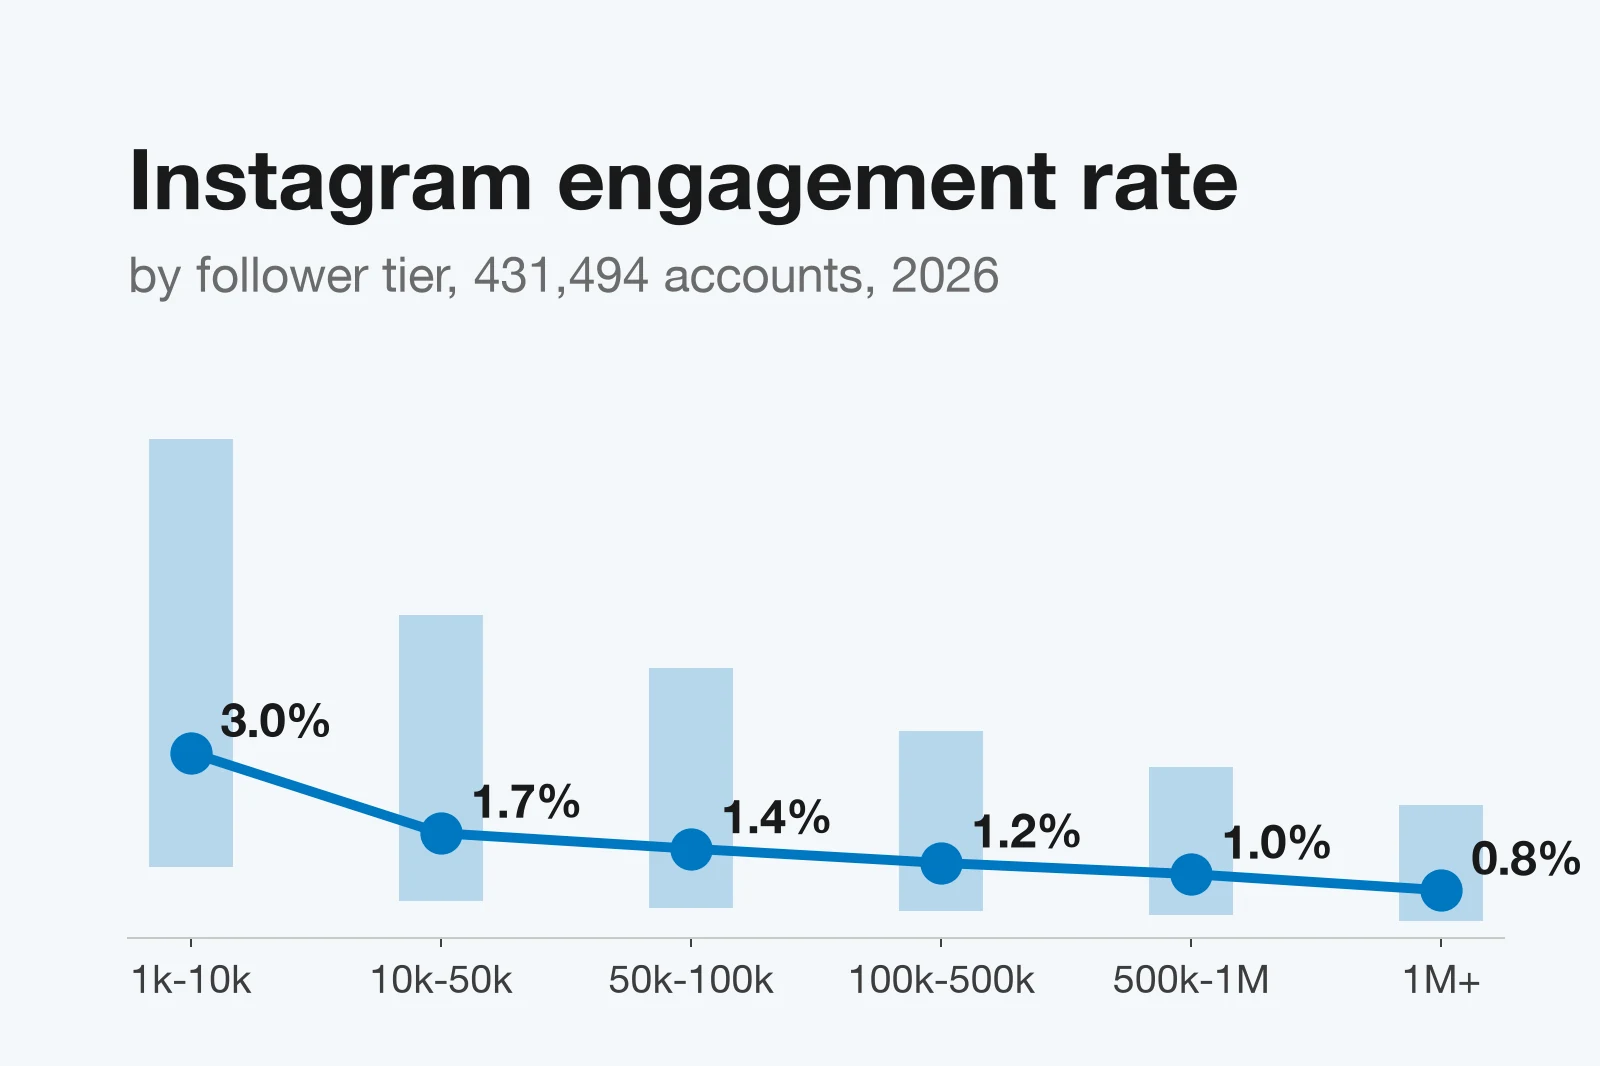
TikTok rates are higher than Instagram rates at every size. The median Instagram account in our crawl has a 1.89% rate, against 5.70% on TikTok. See our Instagram engagement rate benchmarks for the Instagram tiers, categories and Reels numbers, measured the same way.
How to use this when you pick creators
- Compare within the tier. 3% by followers is below the median at 50k to 100k and in the top quarter above 1 million.
- Lead with views. Per 100 views, about 8 is the median at every size. It also works for small accounts whose follower rate is above 100%.
- Price on the median video. If one or two videos carry the average, as with MrBeast and The Rock, plan the deal on the typical video.
- Compare within the category. Food, finance, health and tech creators get about half the per-view rate of dance and music creators of the same size.
- Check views that do not fit. A video with far more views than its likes suggest, as with Gordon Ramsay's June 19 video, needs the creator's analytics before you count it.
- Do not use brand benchmarks for creators. Brand accounts earn 40% to 72% of the creator rate per view.
For the formula choices behind these rules, see how to calculate engagement rate with the right denominator.
Virev creator search shows follower count, engagement rate and recent videos for each TikTok and Instagram creator, so you can filter by size, category and engagement before you contact anyone.
How we measured
- Accounts. Every public TikTok account with at least 1,000 followers that the Virev crawler read between August 13 and October 1, 2026, and that had at least six usable videos. 274,473 accounts.
- Videos. Up to the 12 most recent videos per account, posted within 180 days of the read and at least three days old when read, so counts had time to settle. Videos without a like count were left out. 3,200,761 videos, published between February 15 and September 27, 2026.
- By followers. Engagement rate = (average likes + average comments + average shares) / followers × 100, per account. The median-video rate uses the video with the median engagement count instead of the average.
- By views. Engagements on all videos with a view count, divided by their views, × 100, per account. Views per 100 followers uses the account's median video.
- Tier figures. Medians and quartiles across accounts, never a mean across accounts.
- Creators and categories. Virev's creator profiles classify accounts as individual creators, brands, businesses or media and give a primary niche. 90,684 of the accounts have one. We grouped niches into 21 categories by keyword. Categories with fewer than 100 creators in the band are not shown.
- Limits. TikTok rounds large counts on public pages (for example 1.2M), so large numbers carry rounding. Saves are not in the rate. Follower counts are from the same read as the videos. The sample is the set of accounts Virev crawls, which leans toward accounts that brands search for, and is not a random draw from all of TikTok.