



Instagram decides who sees a post by predicting what each viewer will do with it: watch it, like it, send it to a friend. Instagram has said which signals it uses. It has not said how much each choice a creator makes is worth. So we measured that. We took 10.4 million reels from 288,117 creators and compared each reel with the same creator's other reels, so a big account and a small one are judged on the same scale.
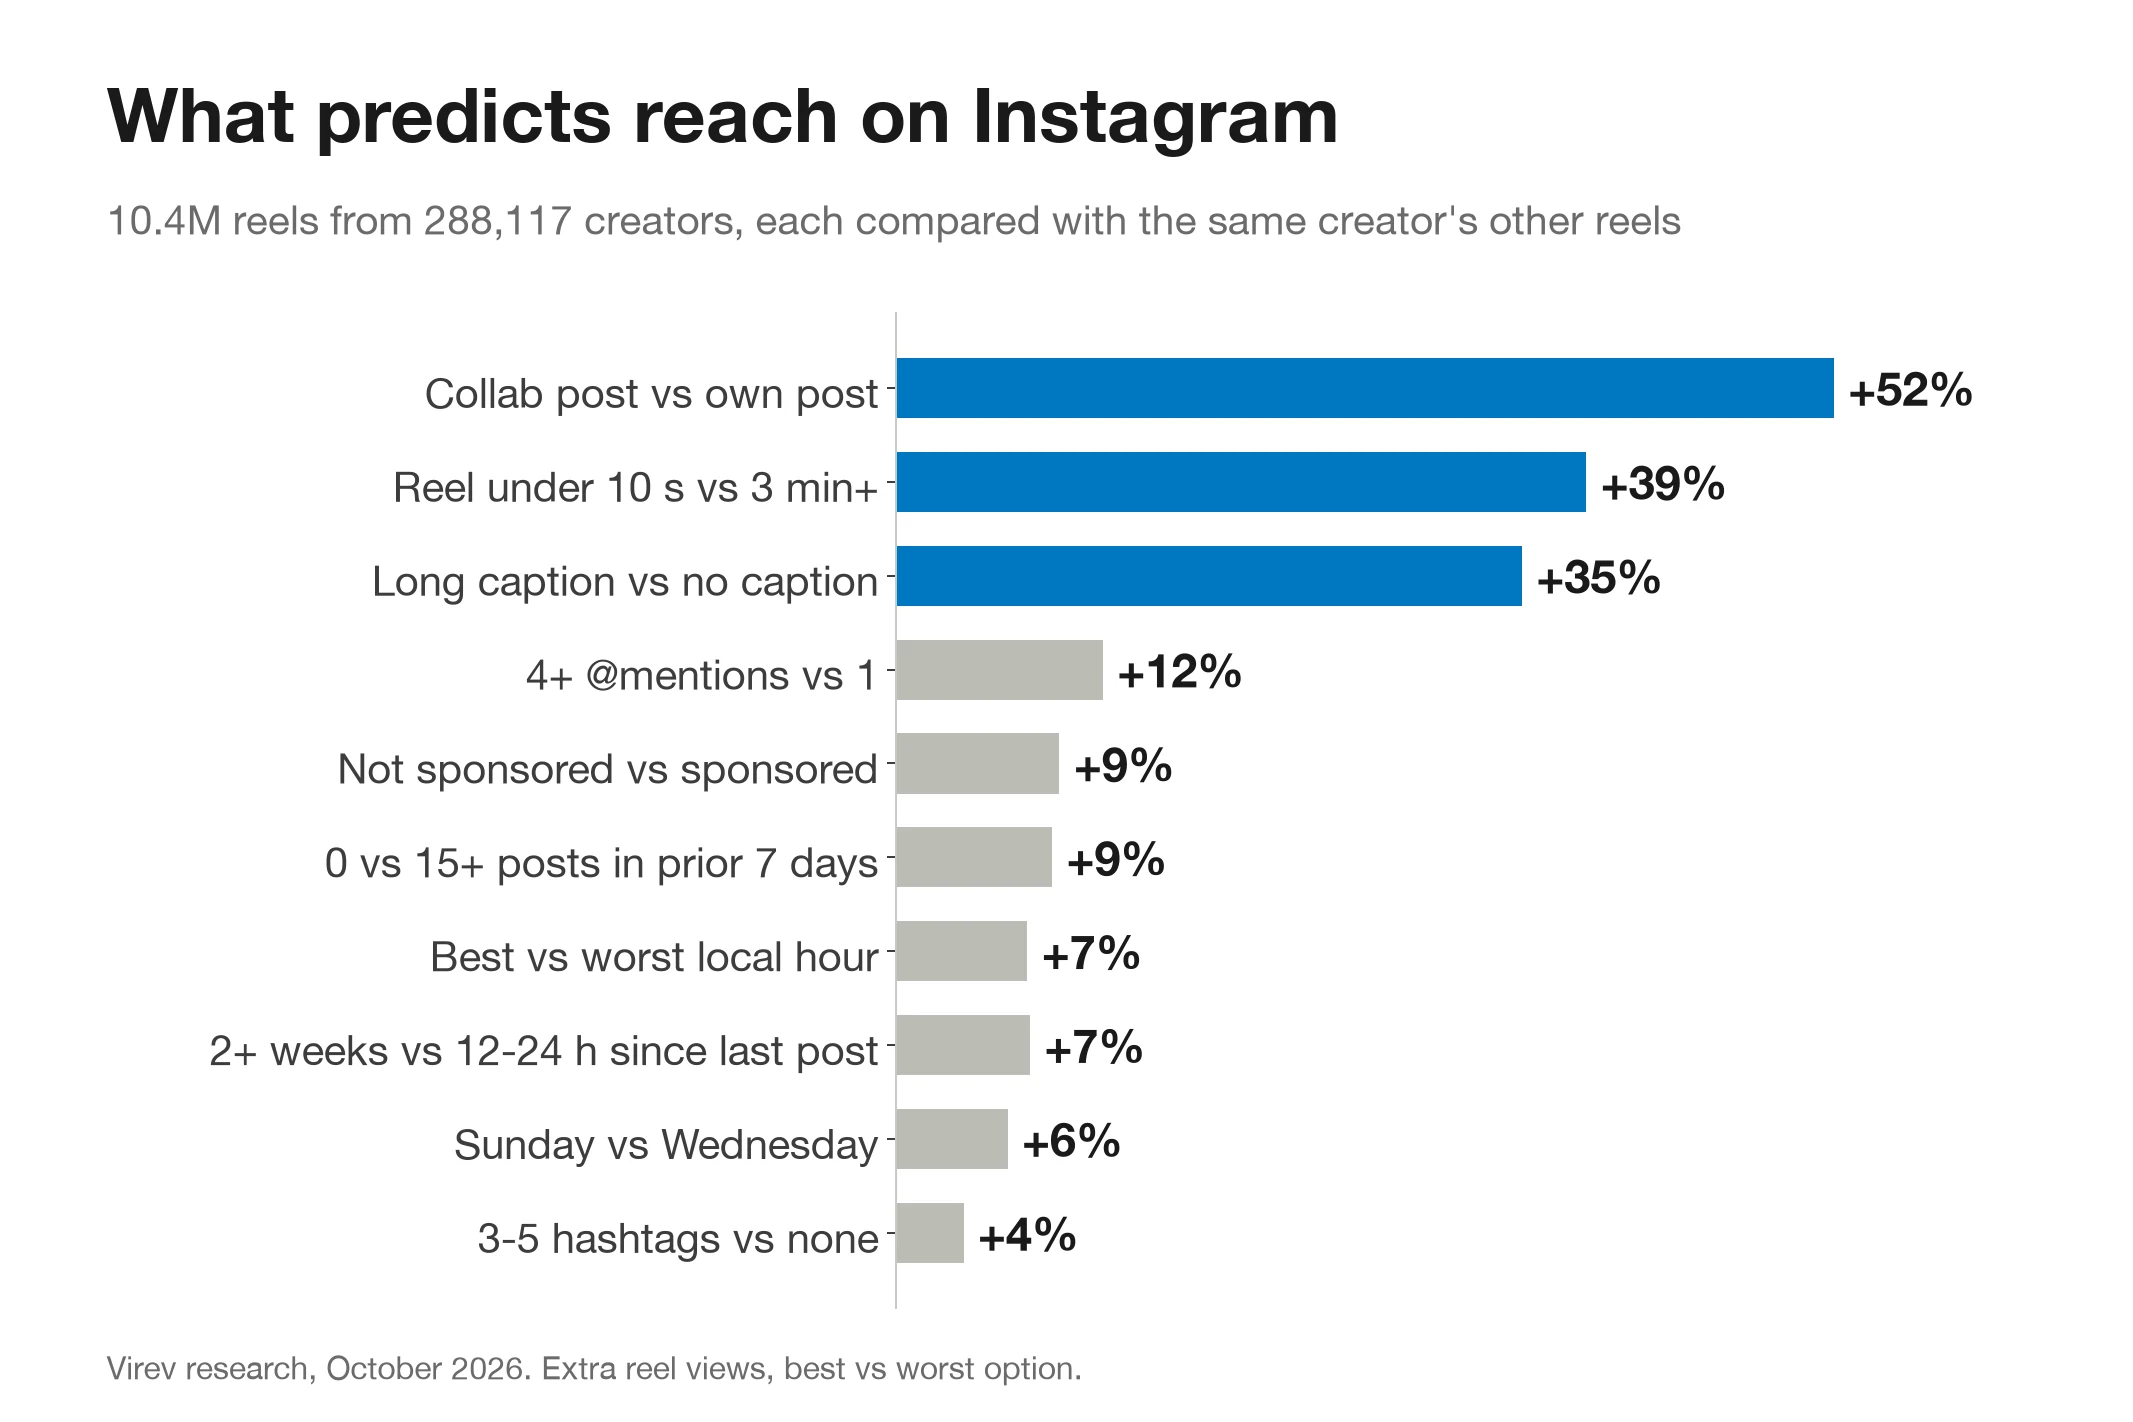
Three choices moved views by 30% or more: posting as a Collab with another account (1.52x), keeping a reel under 3 minutes (reels over 3 minutes got 0.76x), and writing any caption at all (no caption got 0.82x). Hashtags, the hour you post, the day you post and how often you post each moved views by 9% or less.
1.52x
Collab post
0.76x
Reel over 3 min
1.04x
3 to 5 hashtags
What Instagram says about its ranking
Instagram does not have one algorithm. In its ranking explainer, Adam Mosseri, the head of Instagram, writes that Feed, Stories, Explore and Reels each rank posts their own way. For Reels, the most important predictions are "how likely you are to reshare a reel, watch a reel all the way through, like it, and go to the audio page." For Feed, it is whether you will spend a few seconds on a post, comment, like, share, or tap the profile photo.
In January 2025 Mosseri gave a shorter version in a video: "the top three signals that matter most for ranking are watch time, likes and sends." He split reach into connected reach (people who follow you) and unconnected reach (people who do not), and said likes count a bit more for the first and sends for the second.
Those signals are what viewers do. A creator cannot set them directly. What a creator can set is the format, the length, the caption, the hashtags, the timing, and who they post with. The pages that rank for "instagram algorithm" today (Sprout Social, Hootsuite, Later, Buffer) repeat Instagram's list and add tips. Buffer has its own data on format and timing, but it pools all accounts, so a big account's posts and a small account's posts are mixed in one average. None of them ranks the creator's choices by how much reach each one buys.
| What Instagram has said | What our data shows |
|---|---|
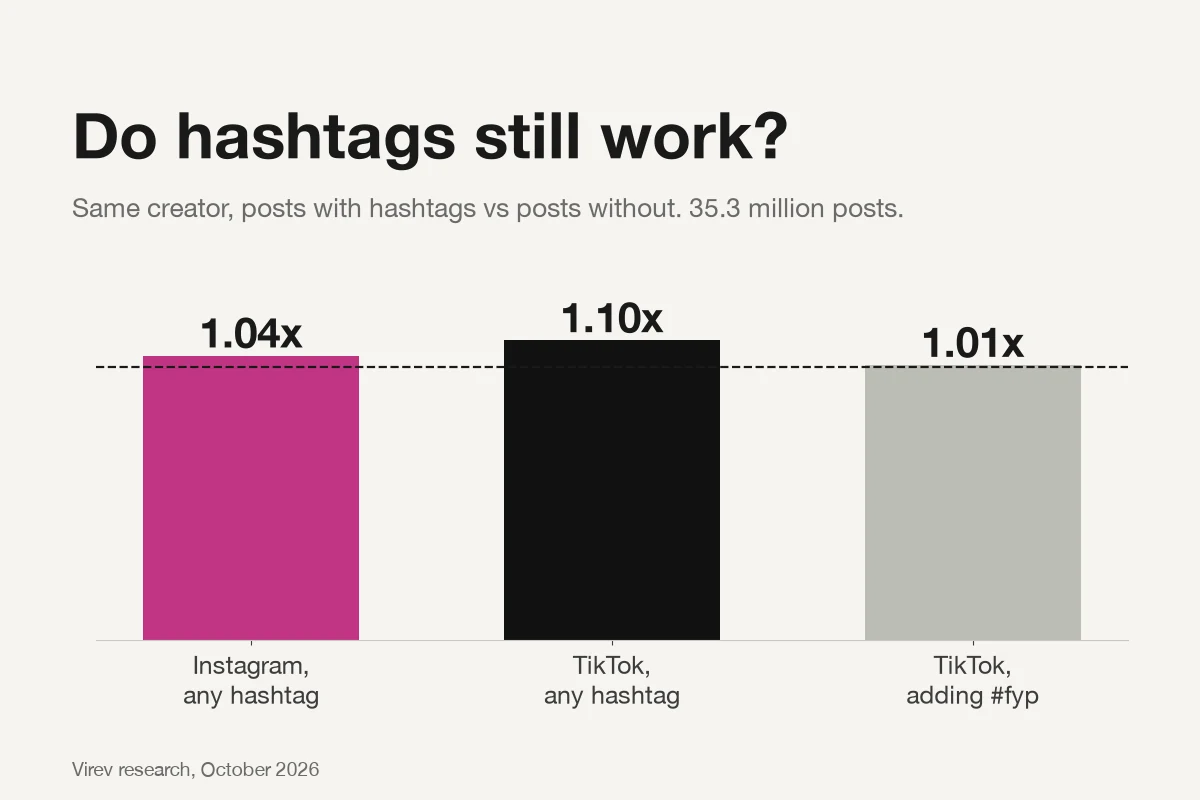
| Hashtags "won't necessarily increase your content's visibility" (Mosseri, May 2024) | 3 to 5 hashtags: 1.04x views. 21+: 1.04x. No real effect. |
| Keep reels to 3 minutes or less (Mosseri, October 2025, as summarized by Hootsuite) | Over 3 minutes: 0.76x views. Under 3 minutes, length moves views by 4% or less. |
| Feed avoids "too many posts from the same person in a row" (ranking explainer) | A post within 3 hours of the last one: 0.99x views, 0.96x likes and comments. |
| Watch time, likes and sends rank posts (Mosseri, January 2025) | We cannot see watch time or sends. Every factor we can see explains 2.7% of the swing between one reel and the next. |
Ten factors, ranked by how much they move reel views
We measured each factor as the gap between its best and its worst option, for the same creator, with every other factor held equal in one model. A gap of 52% means the best option got 1.52 times the views of the worst.
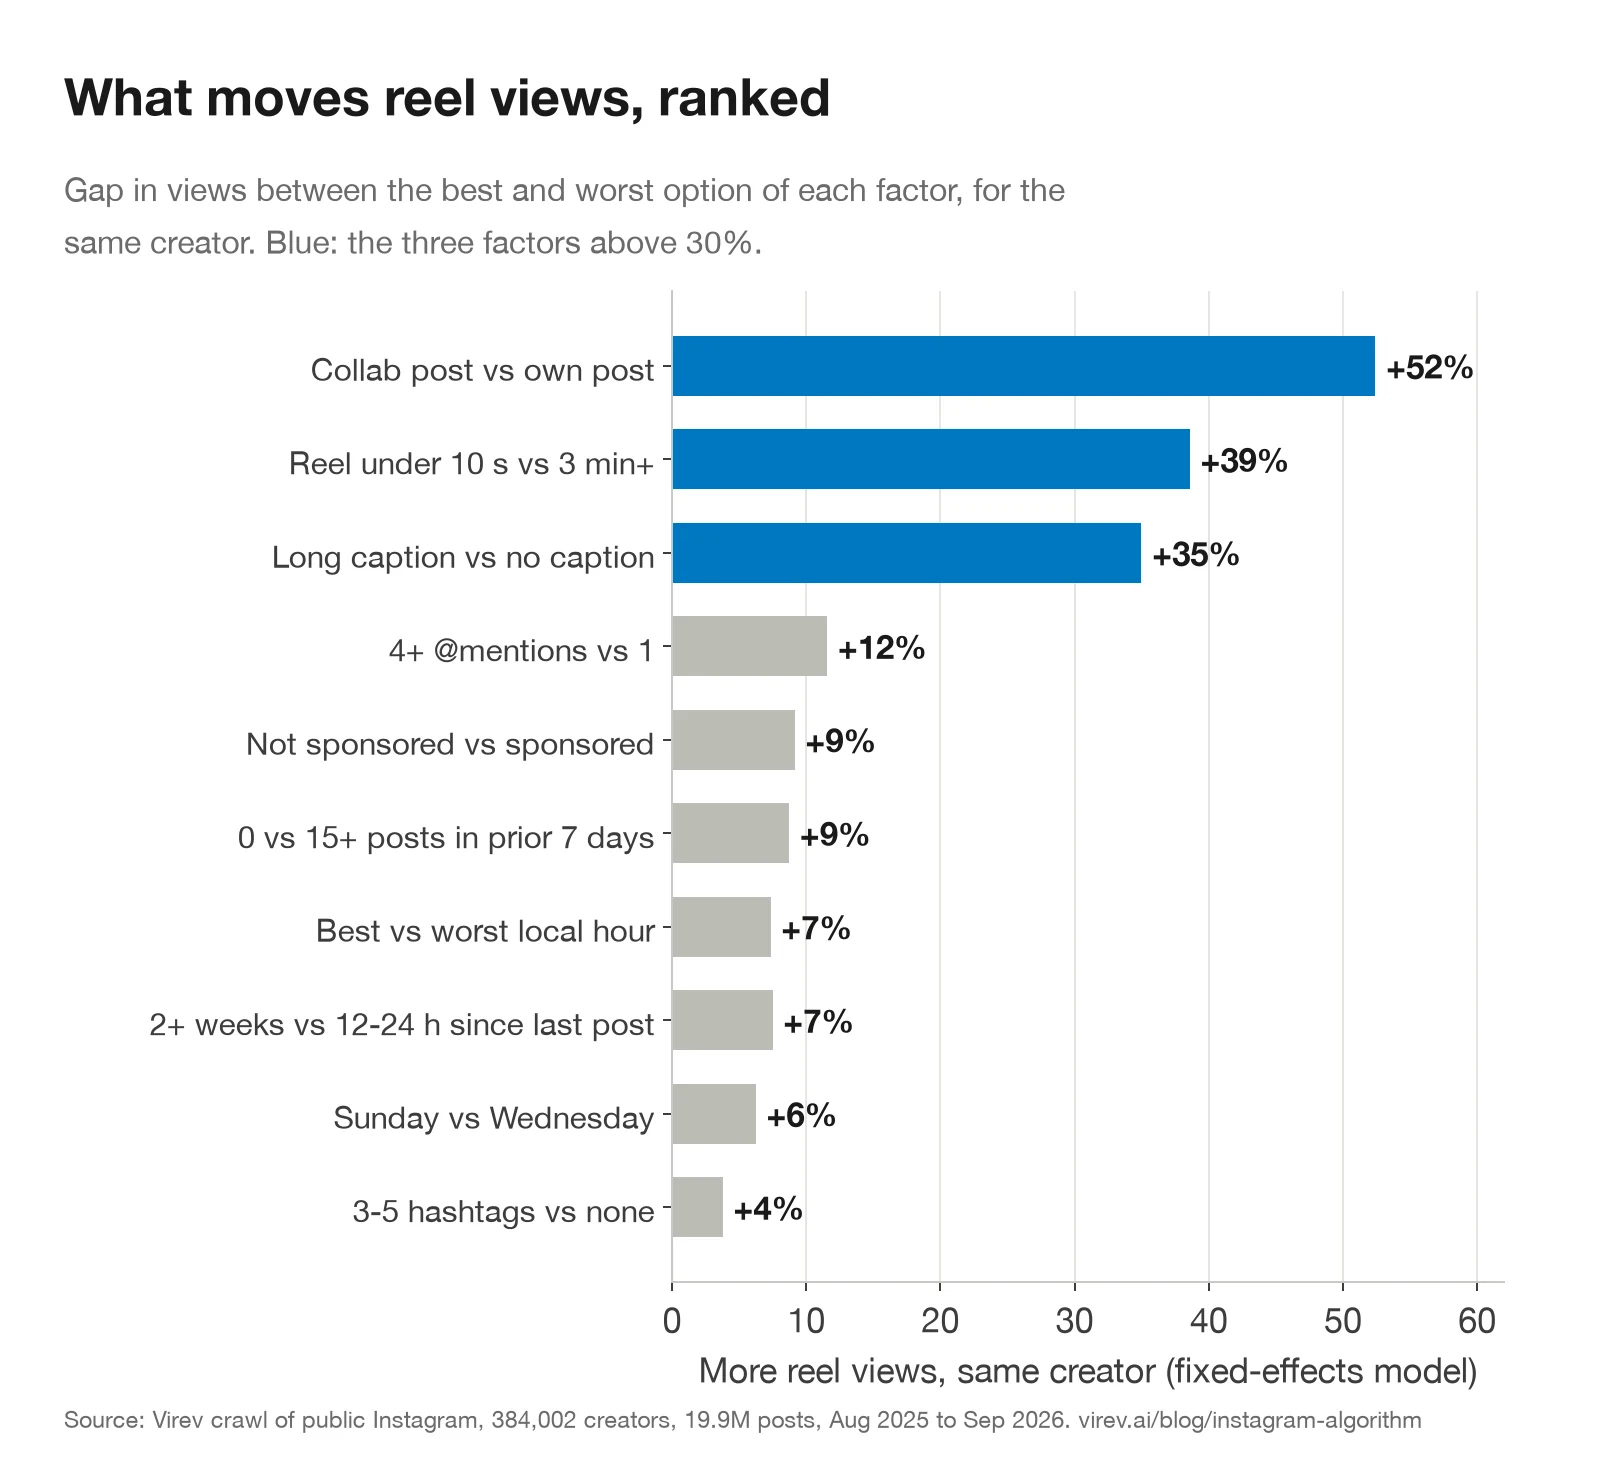
| Factor | Best option | Worst option | Gap in views |
|---|---|---|---|
| Collab post | Collab | Own post | 52% |
| Reel length | Under 10 s | 3 min+ | 39% |
| Caption | 1,000+ characters | None | 35% |
| @mentions in caption | 4+ | 1 | 12% |
| Sponsored | Not sponsored | Paid label or #ad | 9% |
| Posts in prior 7 days | 0 | 15+ | 9% |
| Local posting time | 12-3 AM | 9 AM-12 PM | 7% |
| Time since last post | 2 weeks+ | 12-24 h | 7% |
| Day of week | Sunday | Wednesday | 6% |
| Hashtags | 3-5 | 0 | 4% |
For scale: the median creator's top 10% of reels got 7.4 times the views of their bottom 10% (235,906 creators with 10 or more reels). The largest factor we measured is worth 1.5x. Most of what separates a creator's hit from their flop sits in the reel itself and in what viewers did with it, which is the watch time and sends Mosseri named.
Format is not in the chart because Instagram shows view counts on reels only. On likes and comments, reels get 1.54x and carousels 1.45x the same creator's single-image posts. That comparison is further down.
Collab posts: 1.52x the views, mostly for small creators
A Collab post has two or more co-authors. It appears on each author's profile and goes to each author's followers. 26% of the reels in our data were Collabs. Against the same creator's own reels, they got 1.52x the views and 1.51x the likes and comments.
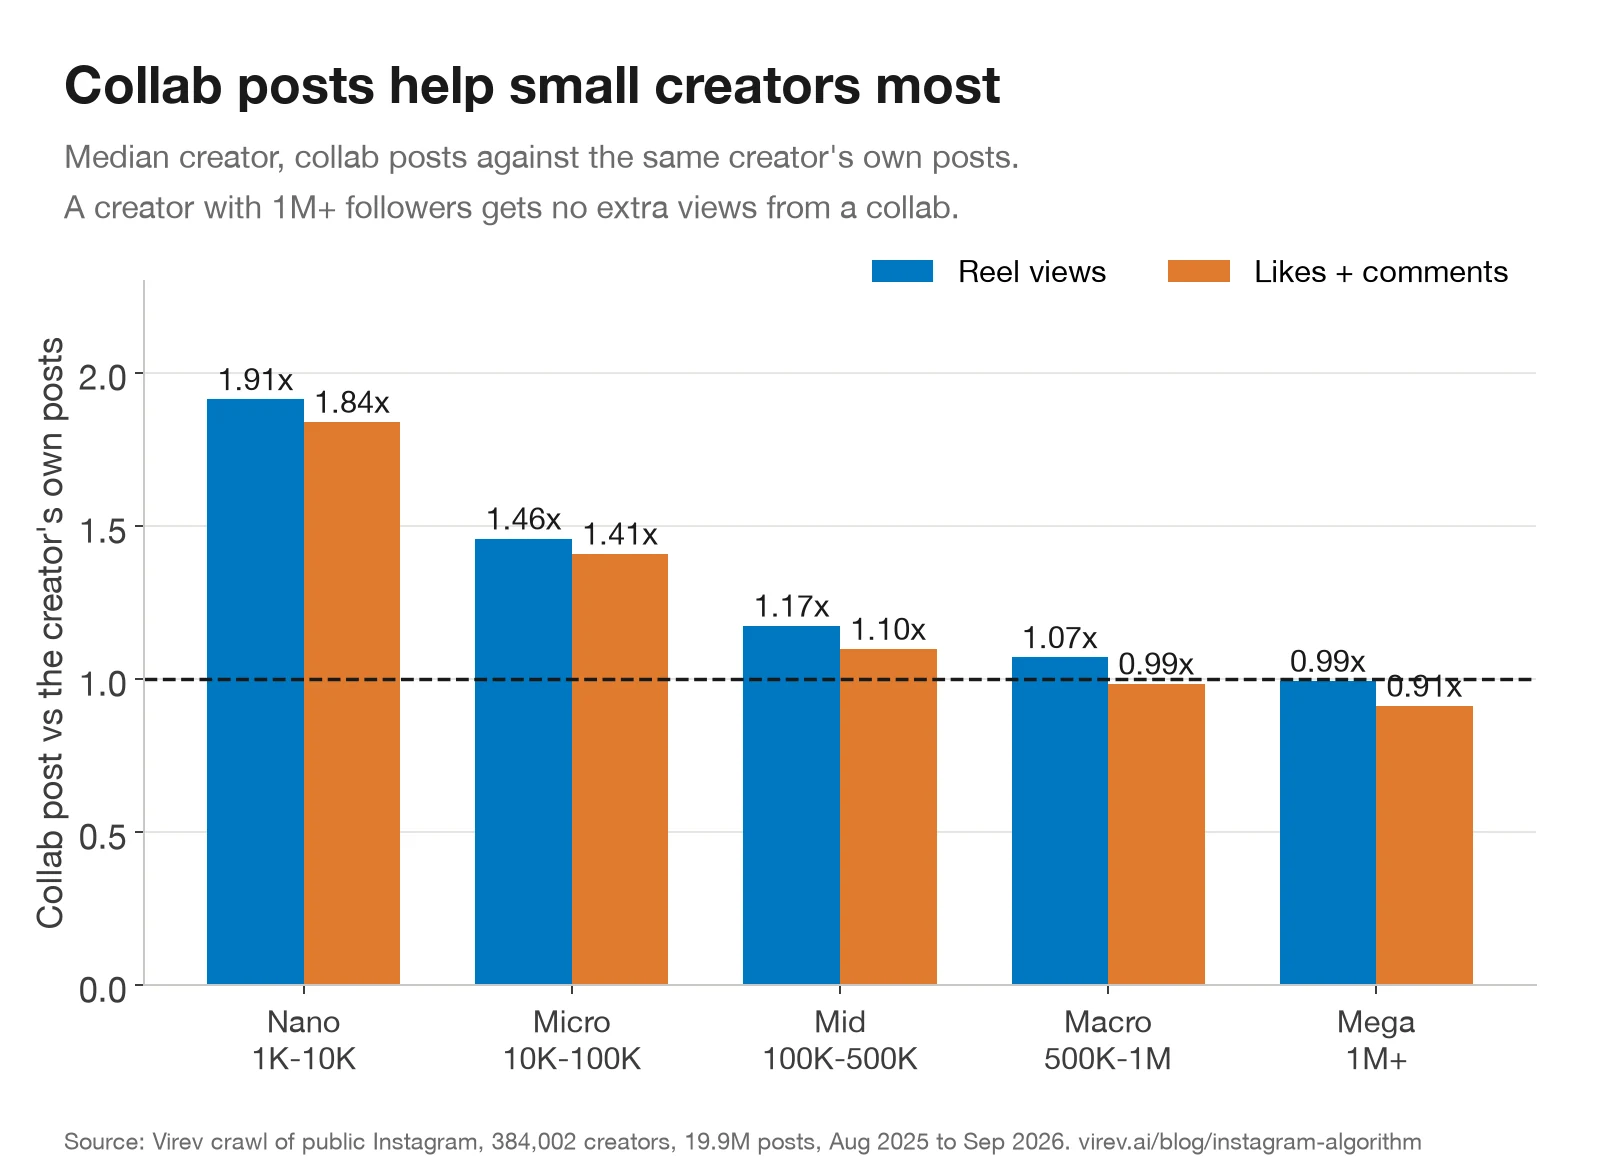
The lift falls with size. A nano creator's Collab reels get 1.91x their usual views. A creator with over a million followers gets 0.99x. The likely reason is who the partner is. A small creator usually co-authors with a bigger account and borrows its audience. A big creator usually co-authors with a brand or a smaller creator, so the partner adds few new viewers.
@paldeagle, 10.9K followers. Paul Bald Raines posts dad skits. His 15 solo reels in our data had a median of 429 views and 10 likes and comments. His 15 reels co-authored with the family account @rainesinthepnw (Tiffany & Paul, 119K followers) had a median of 46,350 views, 108 times as many. The July 2026 reel about his baby daughter "reviewing" his new desk setup got 103,359 views at our read and showed 2,247 likes and 56 comments when we opened it on October 7. Same creator, same kind of skit. The audience came from the co-author.
@brendan_pang, 1M followers. The cook and travel creator gets a median of 236,280 views on his own reels (38 reels). His Collab reels, mostly with brands, got 56,685 (15 reels without a paid label) and 131,647 (18 with one). His August 2026 Italy itinerary with @intrepidtravel got 178,276 views at our read and showed 1,402 likes and 43 comments on October 7. For an account this size, the Collab adds the brand's profile, not a bigger audience.
If you are a brand: ask small creators for a Collab and you add your followers to theirs. Our sponsored post study found the same pattern from the other side: sponsored Collab posts kept 1.00x of the creator's usual reel views, against 0.78x for sponsored posts the creator published alone.
Reels over 3 minutes lose a quarter of their views
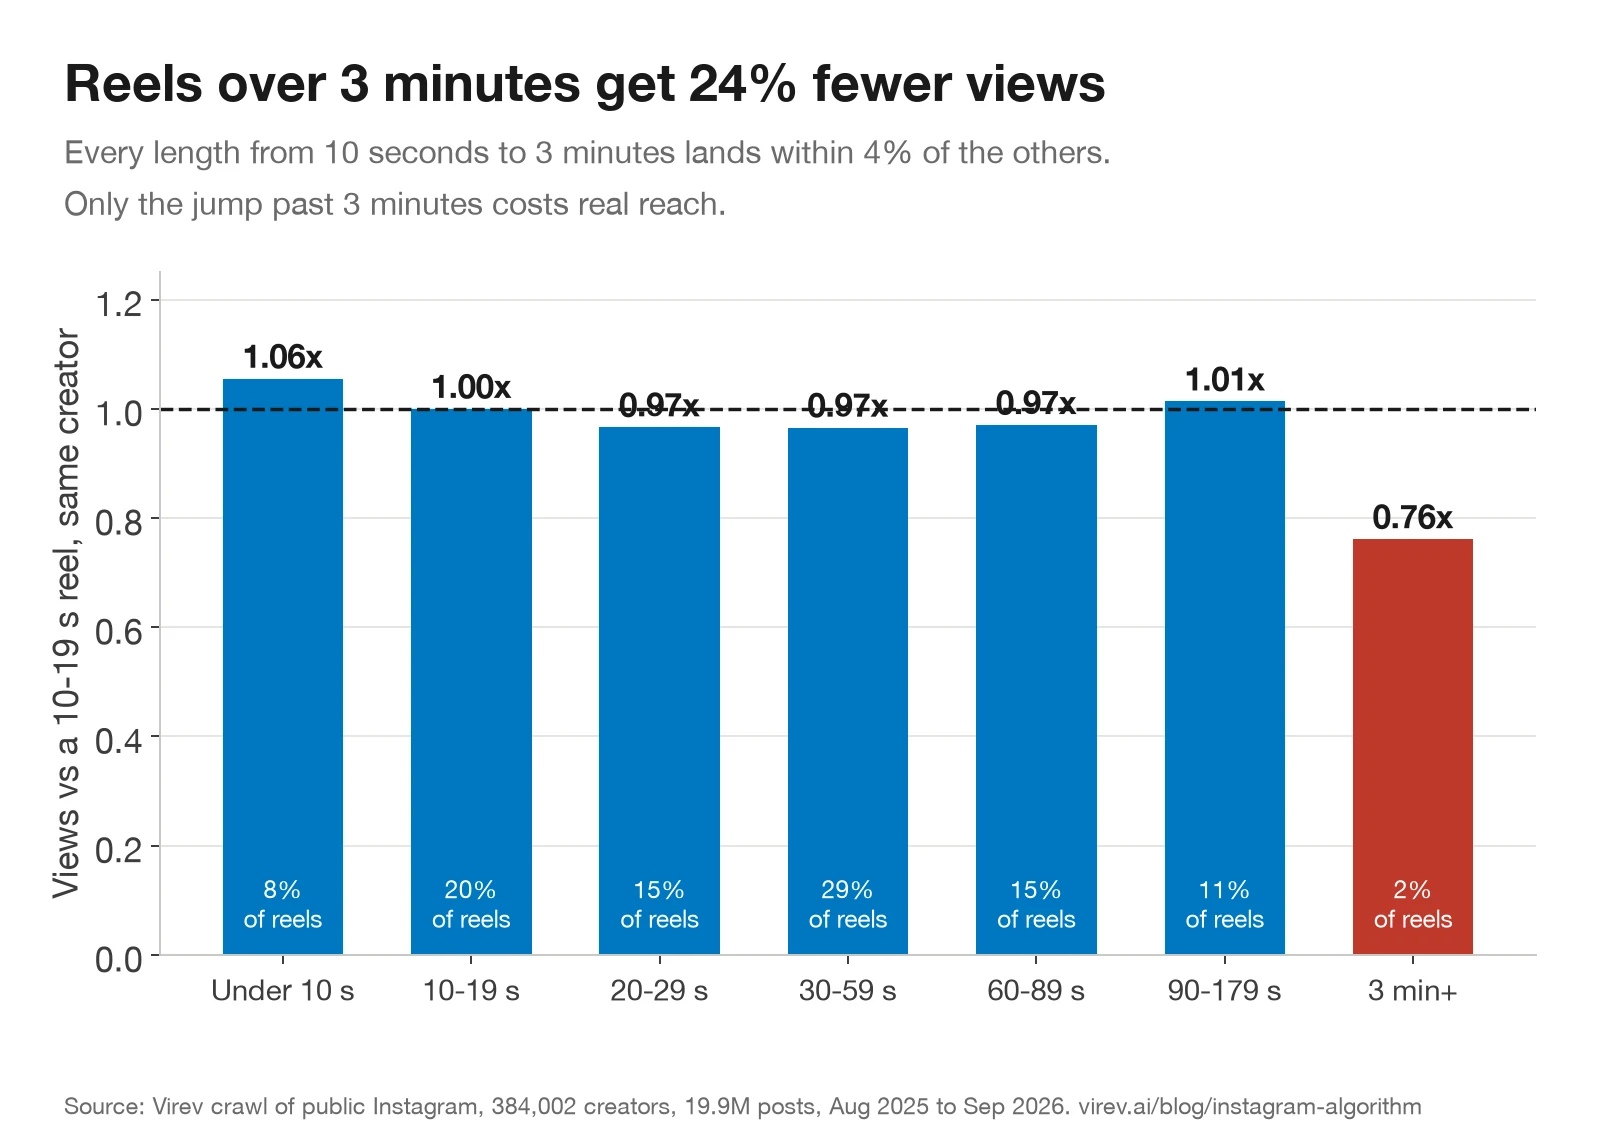
From 10 seconds up to 3 minutes, length barely changes views. Every band lands within 4% of the others. Past 3 minutes, views drop to 0.76x. Only 2% of reels are that long.
Length does change how people react. Reels of 90 to 179 seconds got 1.27x the likes and comments of a 10 to 19 second reel, with the same views. Reels under 10 seconds got 1.06x the views and 0.91x the likes and comments. A longer reel gives the viewer more to react to. A reel under 10 seconds gets watched and passed.
@christianhull, 628K followers. The creator and podcaster posts several reels a day, many of them 5 to 10 minute vlogs. Between May and September 2026, his 42 solo reels of 3 minutes or more had a median of 57,403 views. His 22 shorter reels had 79,665, so the long ones got 0.72x. His long reels did not fail: a 5-minute camping vlog from September 5 got 168,939 views at our read and showed 8,763 likes and 199 comments on October 7. But a creator who posts long by default gives up about a quarter of the reach on each reel.
Captions and @mentions
A reel with no caption got 0.82x the views of a reel with a 21 to 100 character caption. Any caption closes most of the gap. From 21 to 1,000 characters, views stay within 1%. Captions over 1,000 characters got 1.11x. Posts with no caption also tend to be reposts and fast uploads, so part of the gap is the post, not the caption.
Tagging four or more accounts in the caption got 1.09x the views of no mentions, and a single mention got 0.97x. Each tagged account gets a notification, and some of them share the post.
Reels and carousels beat a single photo
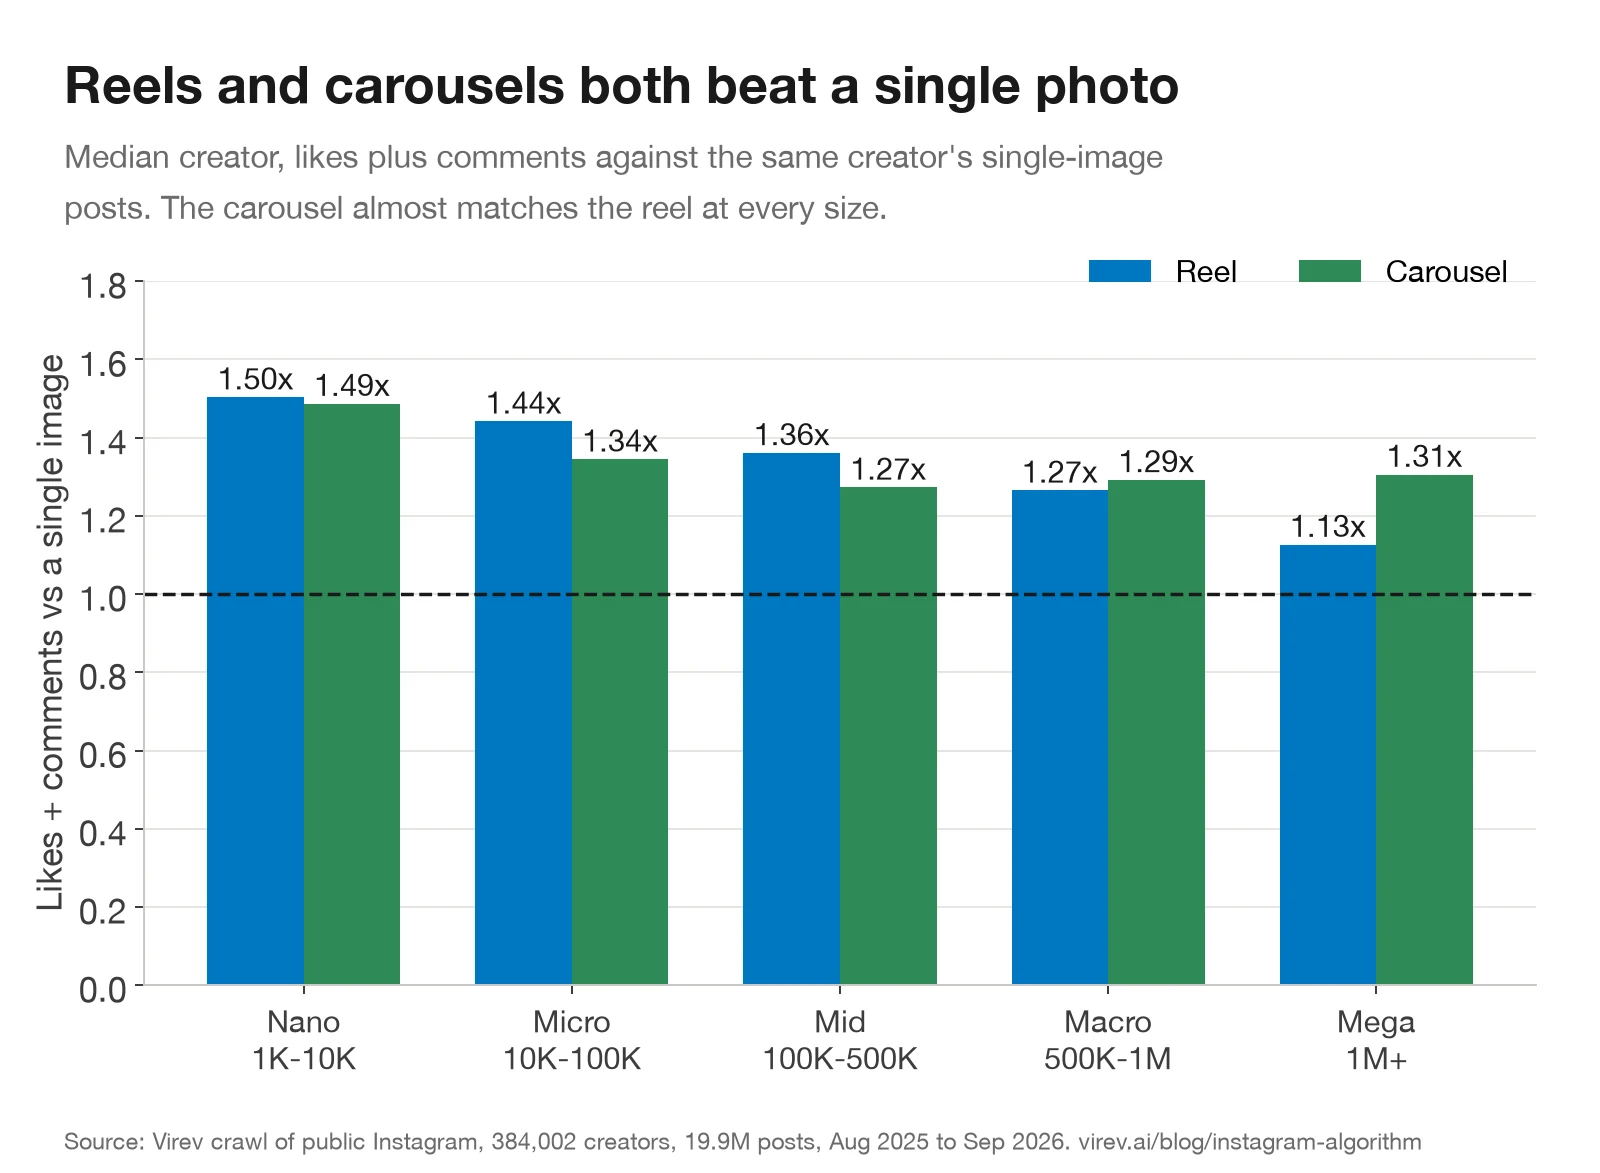
On likes and comments, reels got 1.54x and carousels 1.45x the same creator's single photos in the joint model. The carousel nearly matches the reel at every size and beats it for creators over 1 million followers (1.31x against 1.13x). Instagram's explainer says Feed now also weighs format by viewer, showing more photos to people who prefer photos. A single photo still came last in every tier.
Posting more often did not cut each post's reach
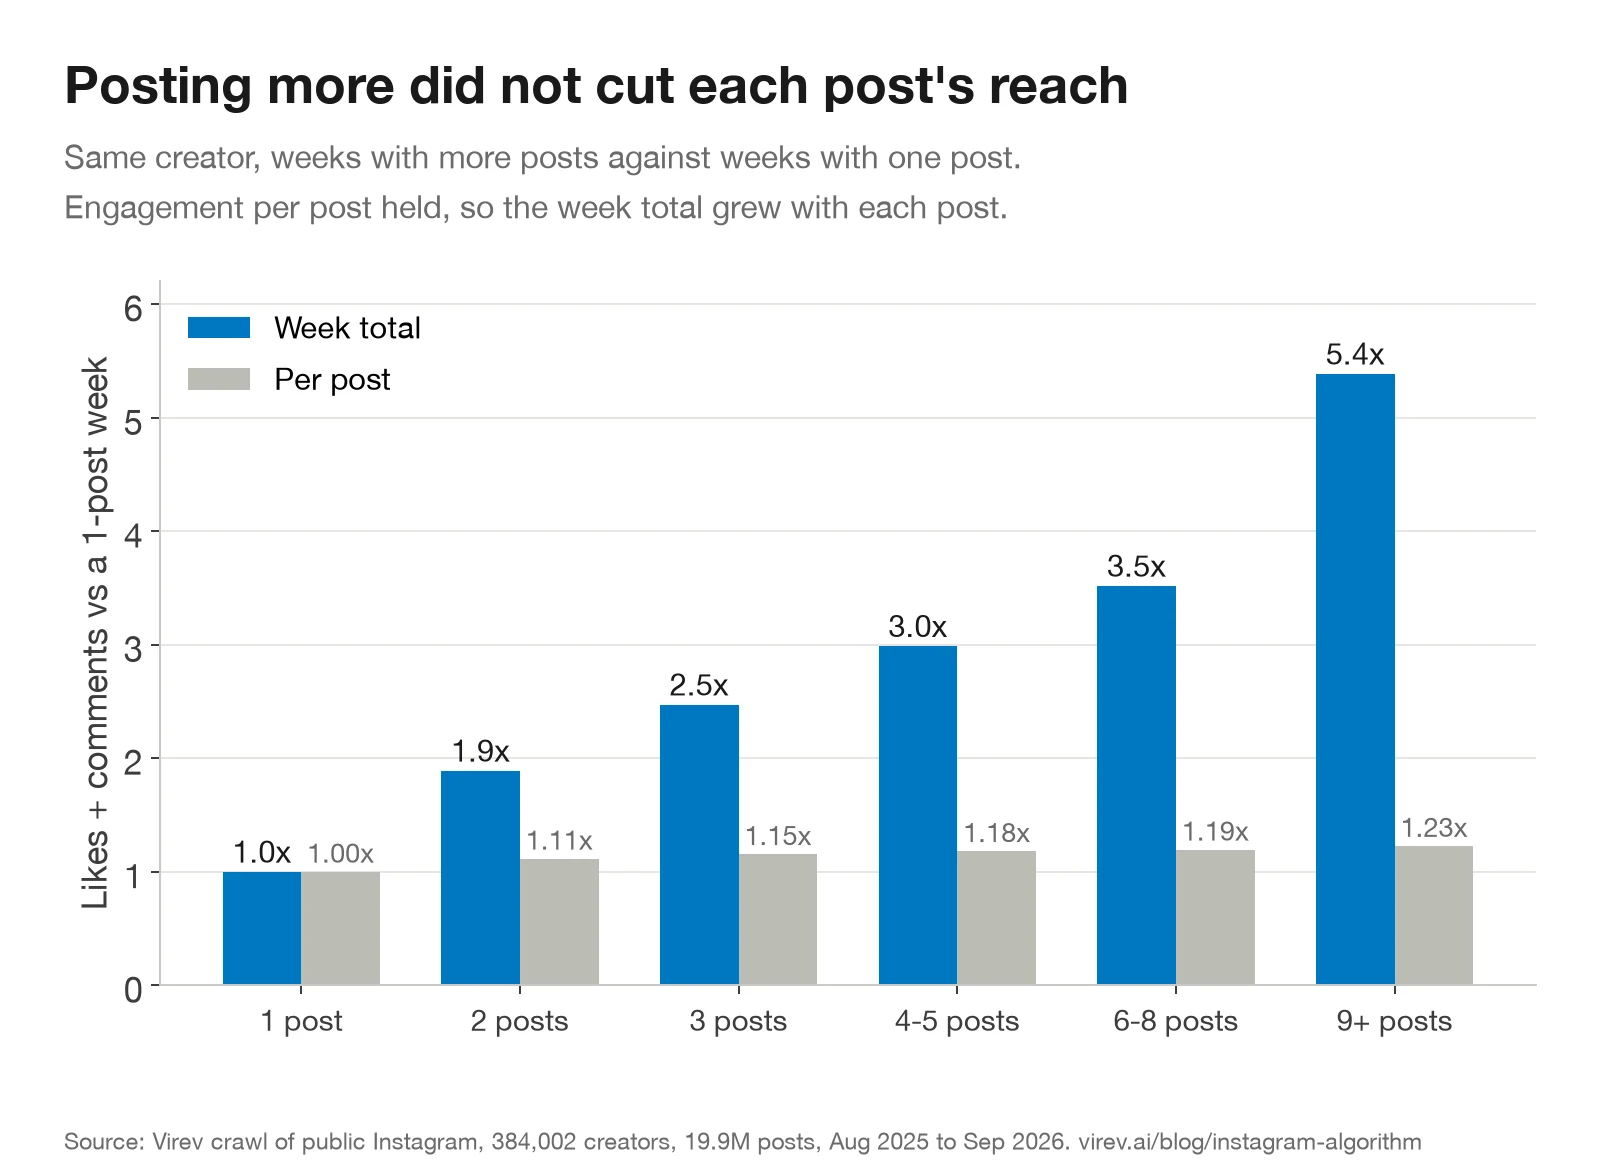
Within the same creator, weeks with more posts got more total likes and comments, and each post in a busy week did no worse than a post in a one-post week. Doubling the posts in a week came with about 2.2 times the total engagement (an elasticity of 1.16 for likes and comments, 1.18 for reel views). Creators also post more in weeks that go well, like a trip or an event, so this overstates the gain from posting more.
The post-level model is the stricter test. A reel that followed 15 or more posts in the previous 7 days got 0.96x the views of one that followed a single post. A post within 3 hours of the previous one got 0.99x the views and 0.96x the likes and comments. Posting after a break of two weeks or more got 1.06x. These are small numbers. Posting often costs each post a few percent, and the extra posts more than make up for it.
Sponsored reels keep their views, not their likes
Sponsored reels (Instagram's paid partnership label, or an ad tag like #ad in the caption) got 0.92x the creator's usual views and 0.57x the usual likes and comments. Instagram still shows them. Fewer viewers react. Our sponsored post engagement study measures this gap by tier, category, brand and market.
Hashtags and posting time barely matter
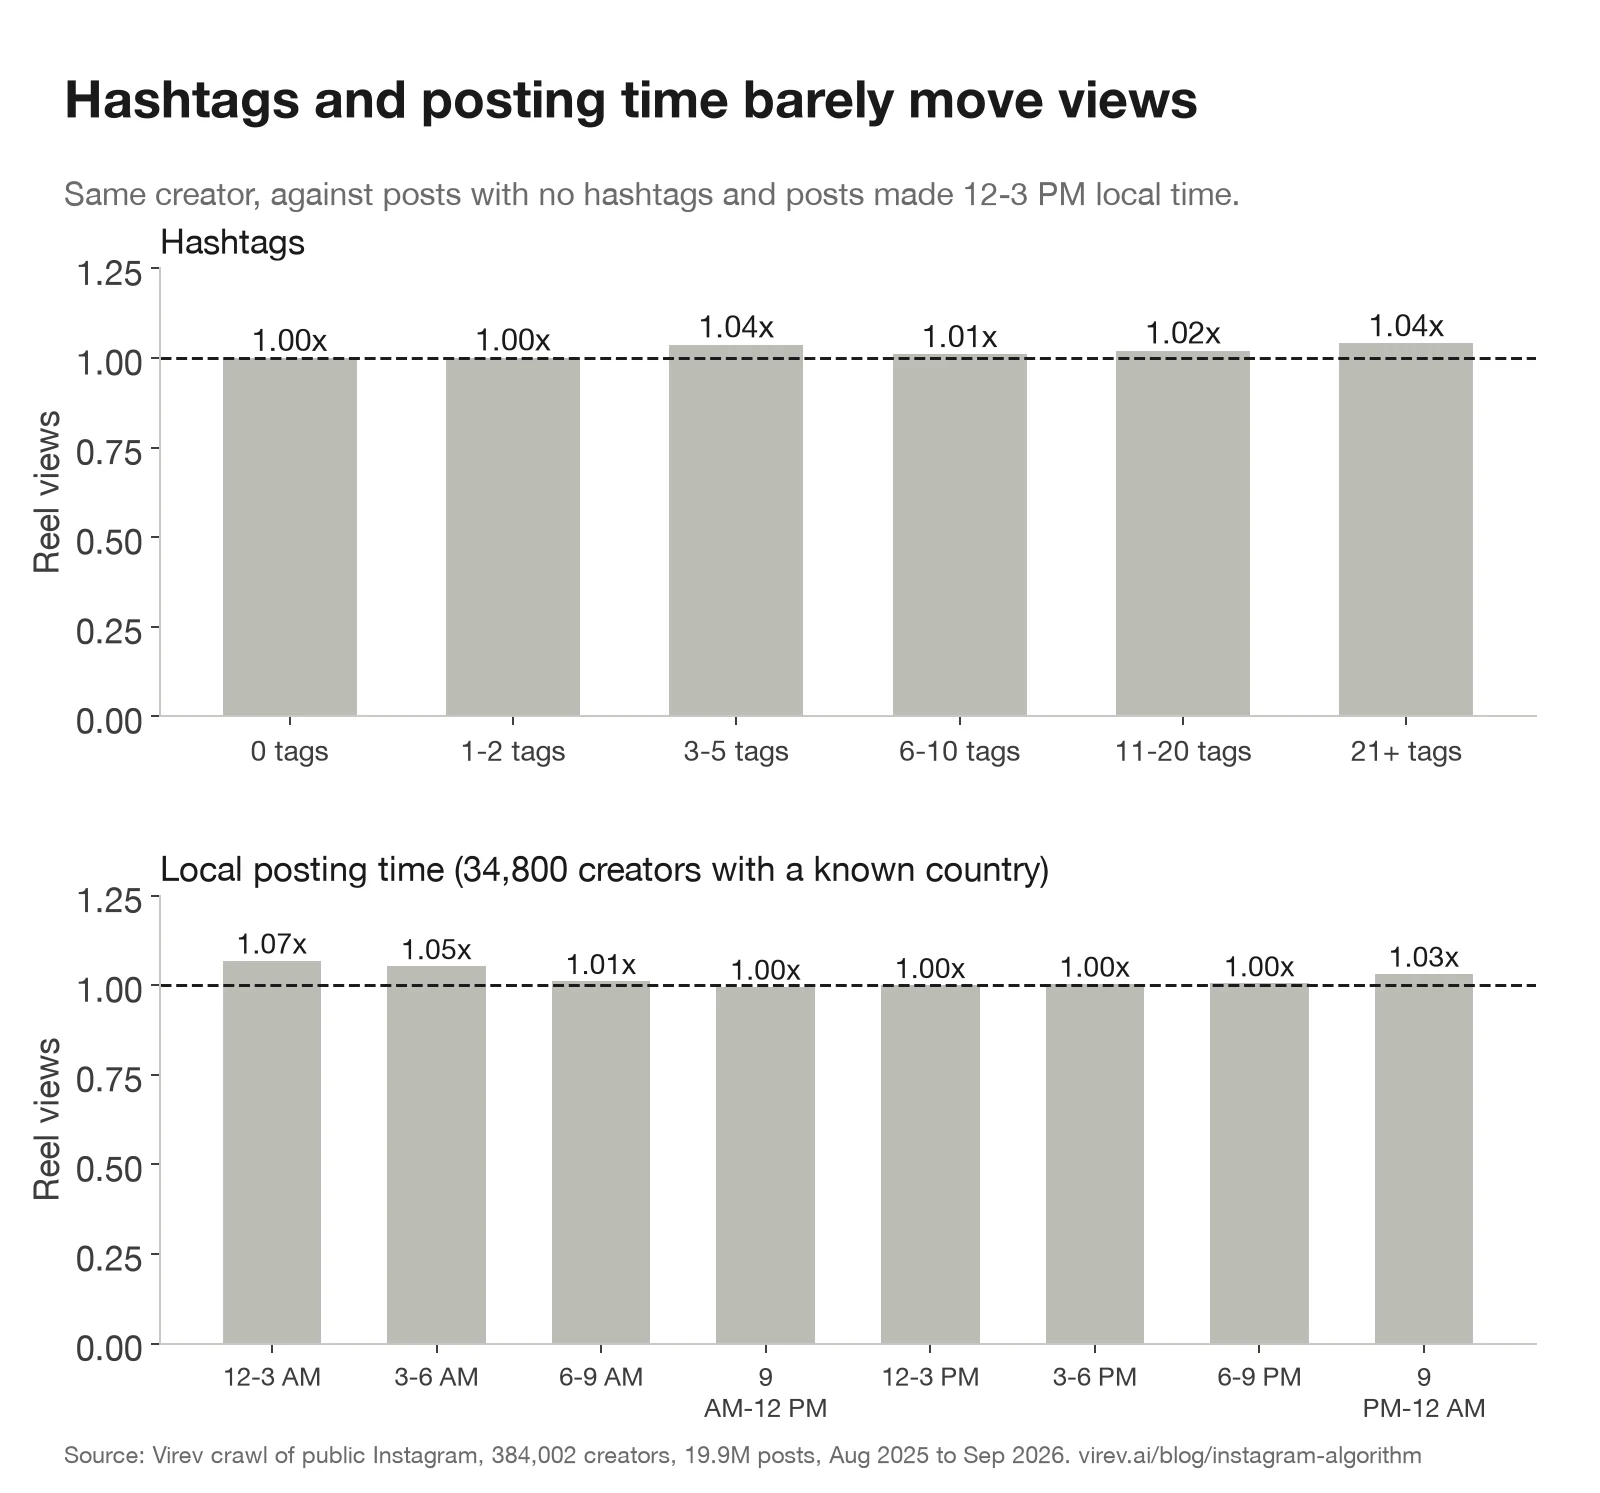
The best hashtag count, 3 to 5, got 1.04x the views of no hashtags at all. That matches what Mosseri told Marques Brownlee in 2024: hashtags help people who follow a topic find a post but "won't necessarily increase your content's visibility." Our hashtag study found the same on likes and comments (1.04x), and saw the share of posts with 6 or more tags fall from 24.7% to 2.7% after Instagram started limiting them.
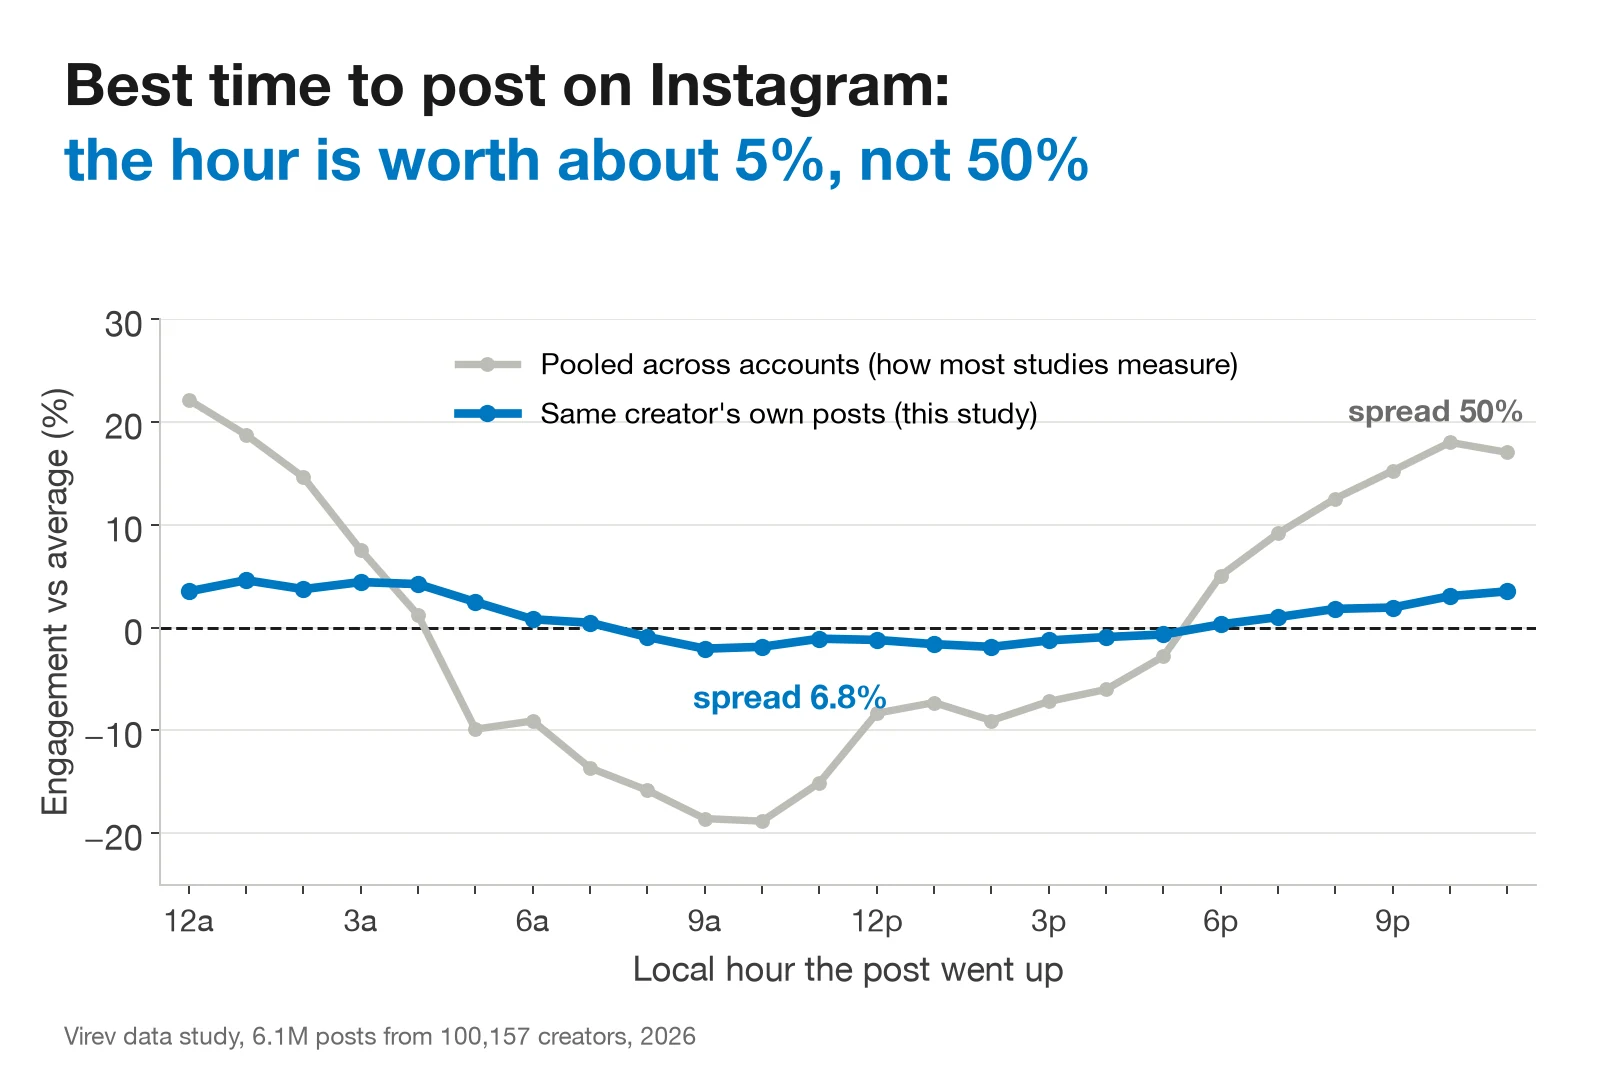
Posting time moved views by 7% at most. Late night (12 to 3 AM local) did best, and Saturday and Sunday beat Wednesday by about 6%. Our best time to post study found a 5.5% gap on likes and comments with a different method. Any posting schedule you can keep is fine.
Small accounts reach a bigger share of their followers
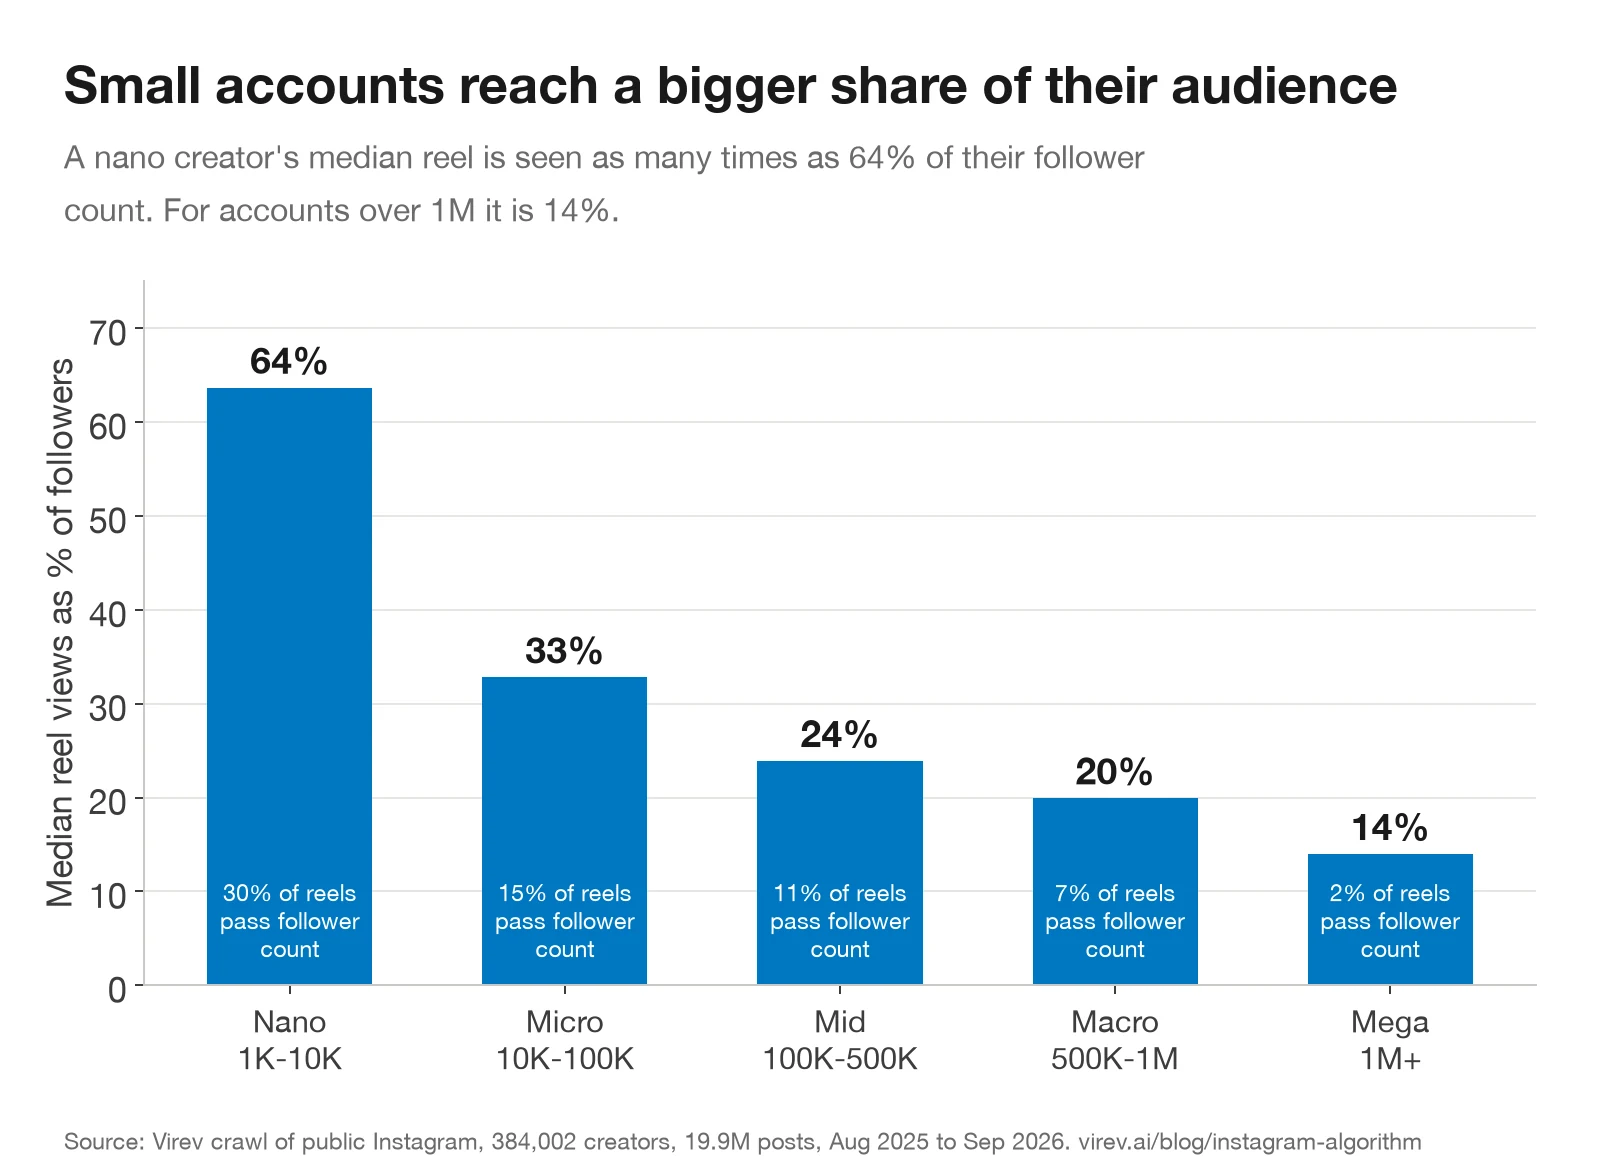
The factors above compare a creator with themselves. Across creators, size changes how far a reel travels relative to the audience.
| Tier | Creators | Median reel views as % of followers | Reels with more views than followers |
|---|---|---|---|
| Nano, 1K to 10K | 99,124 | 64% | 30% |
| Micro, 10K to 100K | 123,313 | 33% | 15% |
| Mid, 100K to 500K | 50,521 | 24% | 11% |
| Macro, 500K to 1M | 14,487 | 20% | 7% |
| Mega, 1M+ | 14,273 | 14% | 2% |
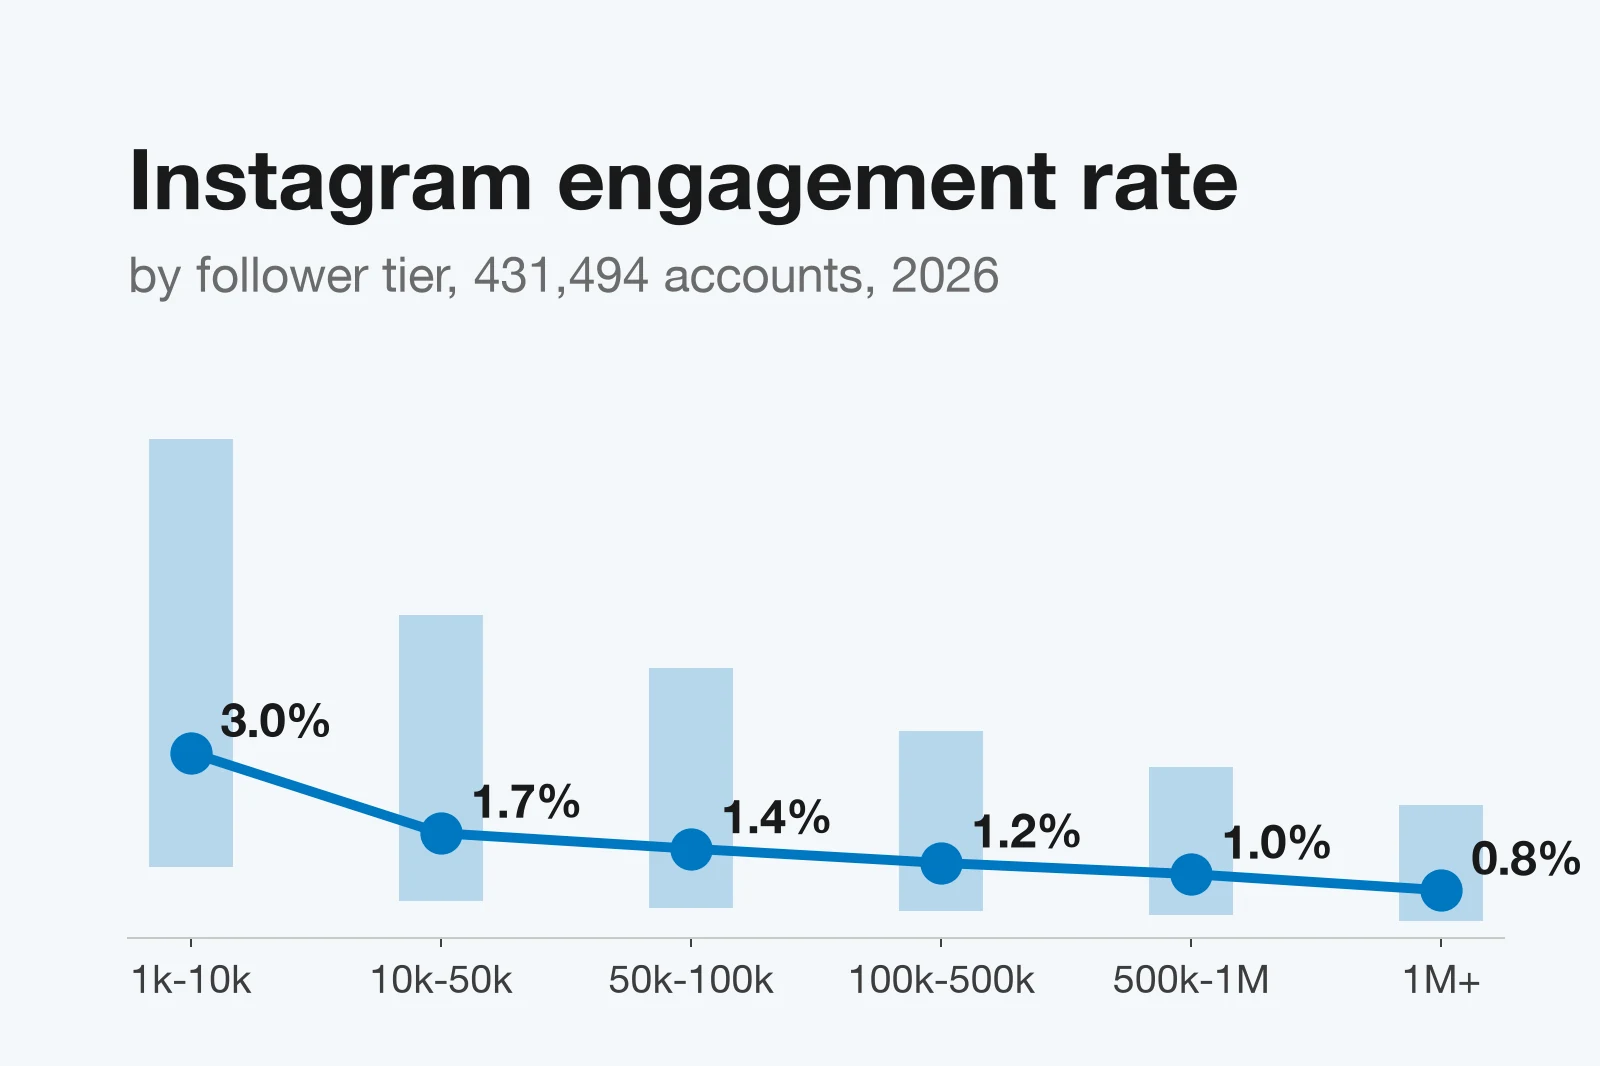
A nano creator's median reel gets views equal to 64% of their follower count, and 3 in 10 of their reels get more views than they have followers. For accounts over 1 million, the median reel gets 14%. A view is not a unique viewer, and many of a reel's views come from people who do not follow the account. Still, a brand that prices a creator by follower count pays for an audience that a big account reaches a smaller share of. Our Instagram engagement rate benchmarks show the same slope for likes and comments.
What to do with this
For creators
- Co-author with accounts bigger than yours, or with accounts whose followers do not follow you yet. It is the largest lever we found, worth 1.9x for nano creators.
- Keep reels under 3 minutes unless the long format is the point. Inside that limit, pick the length that fits the idea.
- Always write a caption. A sentence is enough, and a long caption did a little better.
- Tag the people and accounts in the post.
- Post as often as you can keep up. Do not stop posting to wait for a better hour or day.
- Use a few relevant hashtags if they help people find you, and expect no extra reach from them.
- Check what your own posts do. Our free Instagram engagement rate calculator shows your median post, and the TikTok engagement rate calculator does the same for TikTok. The Instagram downloader saves a reel you want to study frame by frame.
For brands
- Ask small creators for Collab posts. Your followers become extra audience for them, and their followers see your profile.
- Judge creators by median reel views as a share of followers, not by follower count alone. A 30K creator whose reels reach 40% of their followers can beat a 500K creator at 10%.
- Expect a sponsored reel to keep about 0.9x of the creator's views and about 0.6x of the likes and comments.
- Virev creator search shows each creator's recent reels, views and engagement, so you can check this before you sign.
How we measured, and what can be wrong
- Accounts: public Instagram accounts with 1,000+ followers read by Virev's crawler between August 3 and October 3, 2026. We removed brands, media, businesses and organizations by Virev's profile label or Instagram category, and kept creators with at least 6 measurable posts and a median above zero: 384,002 creators. The filter is not perfect; some unlabeled brand accounts remain.
- Posts: feed posts and reels, not pinned, with likes visible, at least 3 days old at the read, posted within a year before the read (August 18, 2025 to September 29, 2026). Giveaway posts are left out because entry rules inflate their comments. 19,863,062 posts; 10,442,930 reels with a view count.
- Model: the log of reel views (or of likes plus comments) for each post, minus the same creator's average, regressed on all ten factors at once plus the post's age at the read and its month. Each factor's number is the multiple against its reference option, holding the others equal. 95% intervals with errors clustered by creator are in the CSV; most are within 1% either way. We fit the model again on two random halves of the creators, and every factor's gap matched within 5 points.
- Post age: a reel read 3 to 6 days after posting had 0.77x the views of one read at 2 to 4 weeks. Views keep coming after the first week. The model holds age equal, so a factor that is common on newer posts does not look worse for that reason.
- Collab: from Instagram's co-author list on each post. In 10 posts checked by hand in Aside on October 7, 2026 (6 Collab, 4 not), all 10 matched.
- Hashtags: counted by the parser from our hashtag study, checked by hand on 100 posts. @mentions: count of @ signs in the caption, which also counts email addresses.
- Local time: from the creator's country in Virev's profile, or Korean and Japanese as profile language. Known for 34,800 creators in the views model, so the time results cover fewer creators than the rest.
- What we cannot see: watch time, sends, saves, reach and the share of views from non-followers. Instagram ranks on those, so the 2.7% our factors explain is the part a creator sets before posting, not the whole algorithm.
- This is an observational study. Creators choose their formats, partners and timing, and the model holds equal only what it measures. Read each number as what posts with that choice got, for the same creator.
- Live checks: counts for the named posts were read in Aside on October 7, 2026. Likes can move after our crawl; @brendan_pang's Italy reel showed 1,676 likes at our read and 1,402 on October 7.
Download the data
The tables behind every chart are in one CSV: instagram-reach-factors-2026.csv. It has one row per factor option with the outcome (reel views or likes plus comments), posts, the multiple against the reference option and its 95% interval, plus the tier, format and weekly tables. Please cite "Virev, October 2026" and link this page.
Sources
- Instagram Ranking Explained
- How ranking works on Instagram (connected and unconnected reach)
- Discussing hashtags with @mkbhd
- Five simple and tactical things you can do to increase your reach on Instagram
- Instagram algorithm tips for 2026: Everything you need to know
- How the Instagram Algorithm Works: Your 2026 Guide
- Instagram algorithm in 2026: rank signals for growth
- How the Instagram Algorithm Works [Updated 2026]
- POV: You are trying to upgrade your workspace
- Honestly had the best sleep last night
- Save this Italy itinerary