



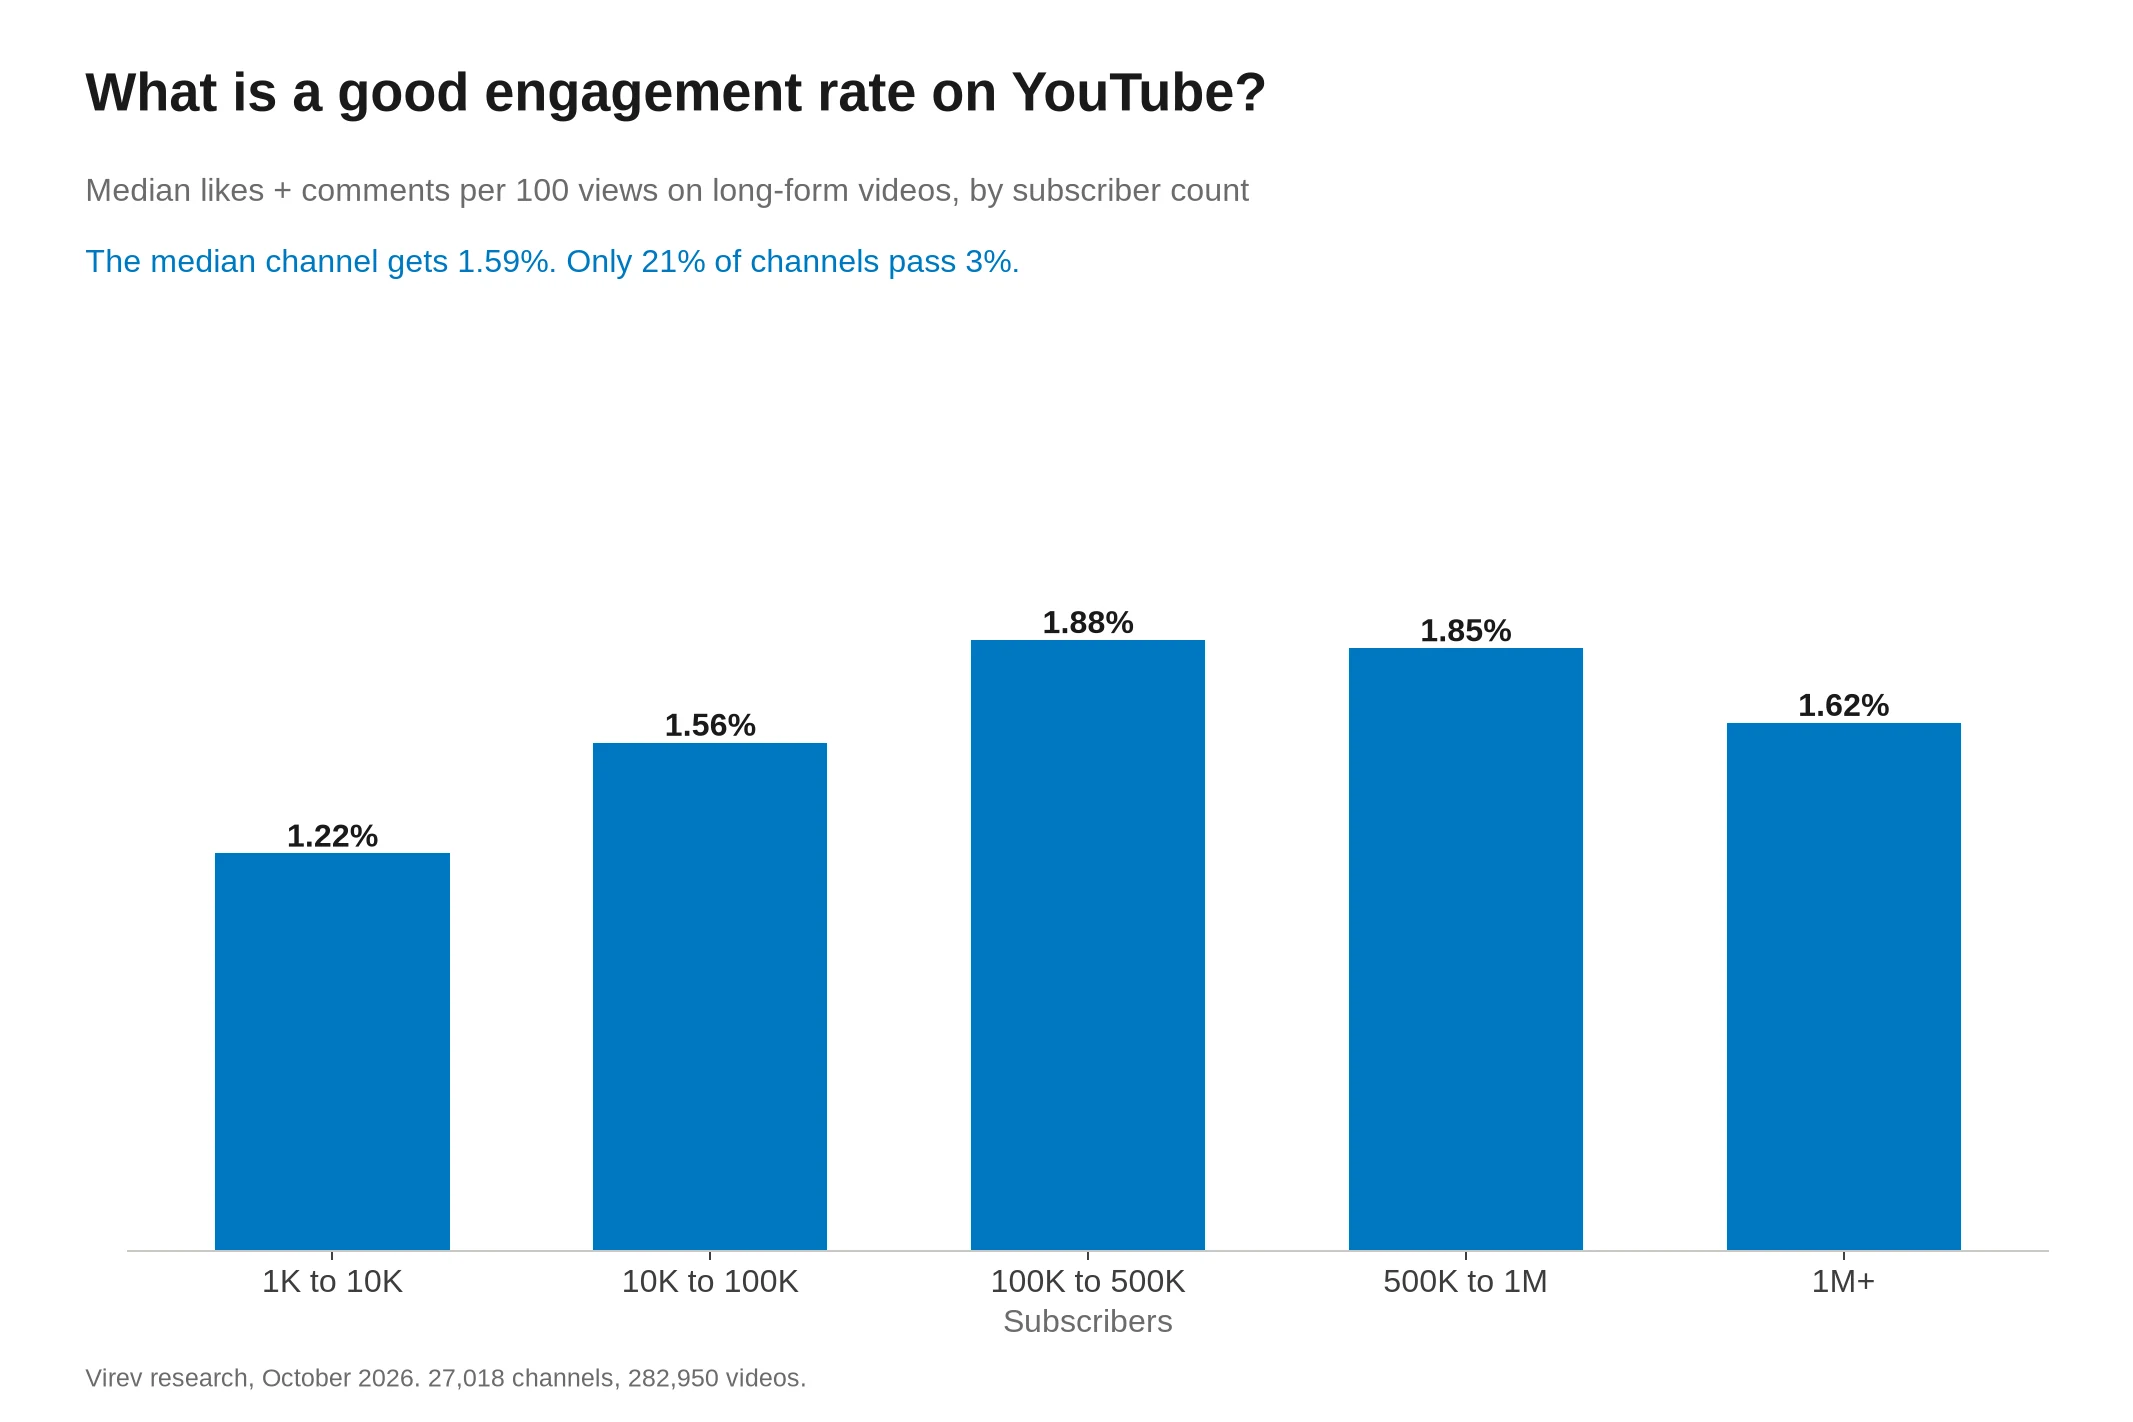
A good engagement rate on YouTube is about 2.7% or more, because that puts a channel in the top quarter. We measured 282,950 long-form videos from 27,018 channels with 1,000 or more subscribers. The median channel got 1.59 likes and comments per 100 views. Only 20.7% of channels passed 3%, the number most guides give as normal.
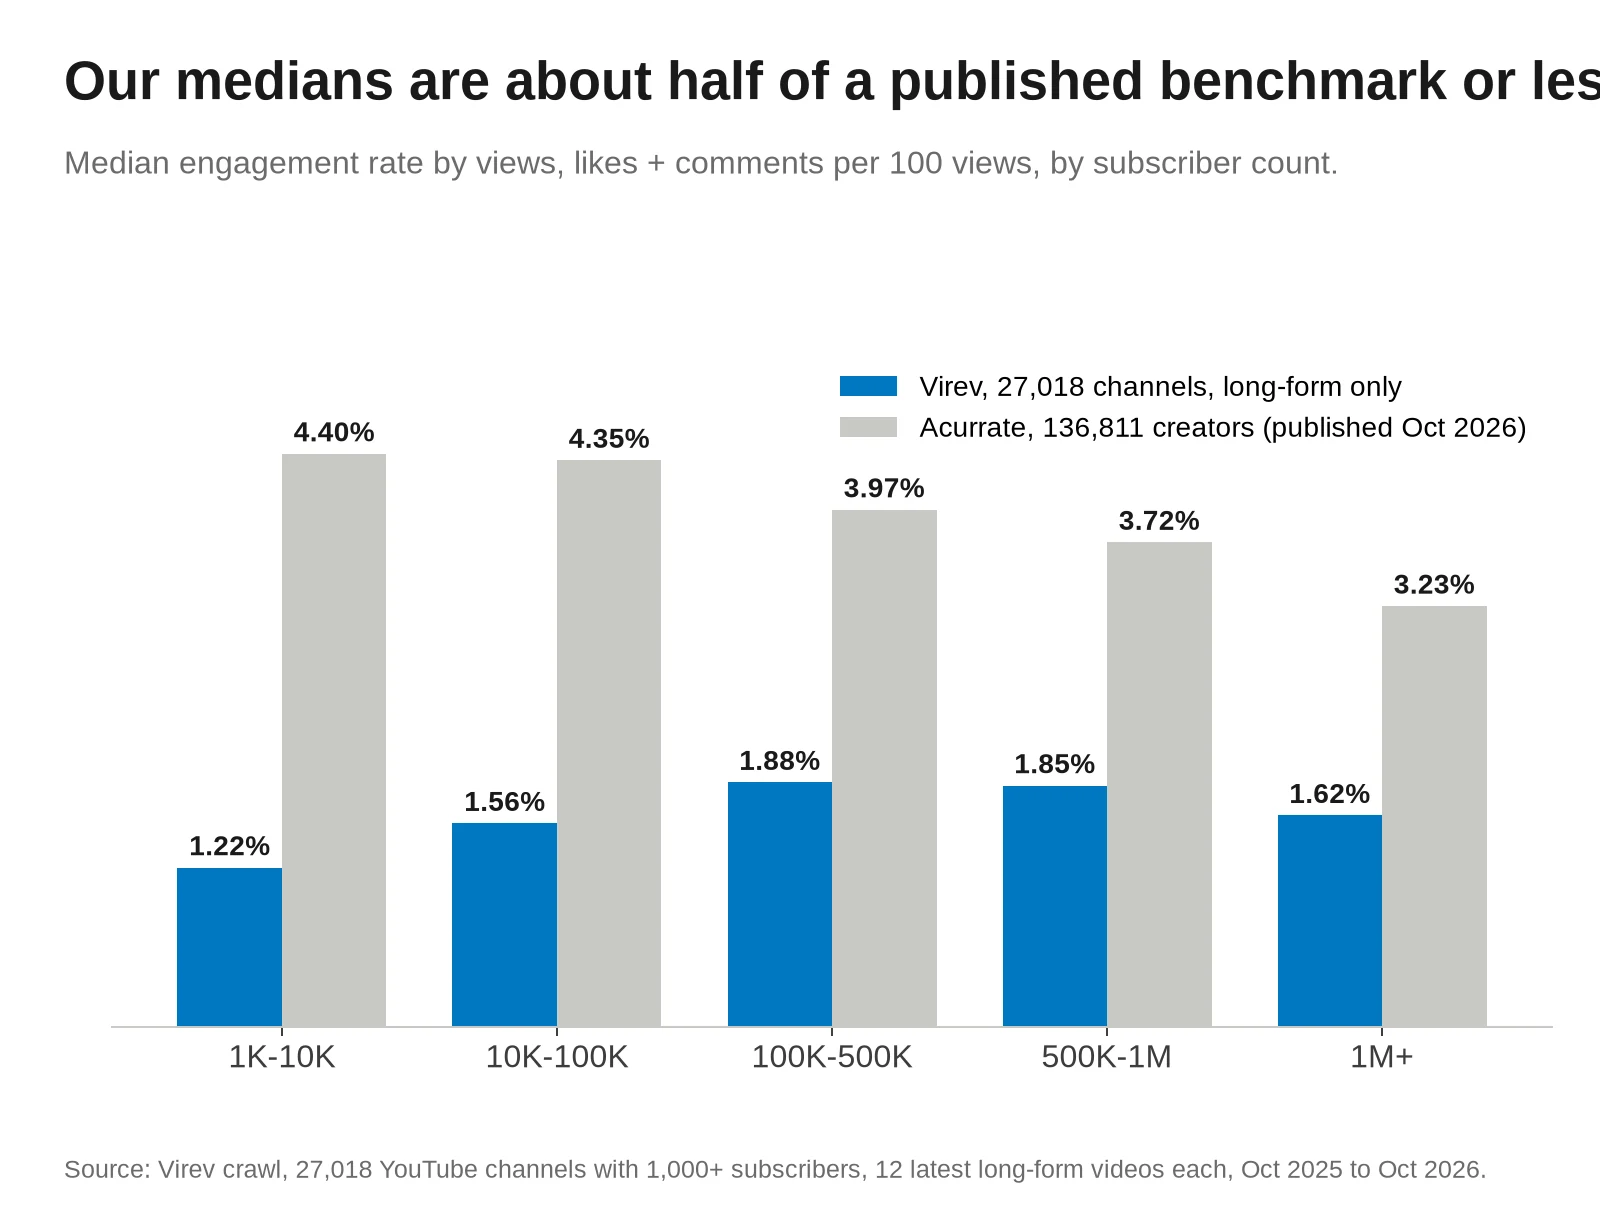
The pages that rank for this question put the benchmark at 3% to 5%. SociaVault gives a 3.06% median from 75,000 channels and about 2.7% for long-form videos. Acurrate gives 4.40% for channels with 1,000 to 10,000 subscribers and 3.23% above 1 million, from 136,811 creators. Our long-form medians are about half of Acurrate's or less at every size. Neither page publishes its data, so we cannot say where the gap comes from. Our tables are in a CSV at the end of this page.
1.59%
Median channel
20.7%
Channels above 3%
0.12
Comments per 100 views
YouTube engagement rate by subscriber count
The engagement rate by views is likes plus comments divided by views, times 100. For each channel we add up the likes, comments and views of its 12 most recent long-form videos and divide. Then we take the median channel in each size band.
| Subscribers | Channels | Median rate | Comments per 100 views | Views per 100 subscribers |
|---|---|---|---|---|
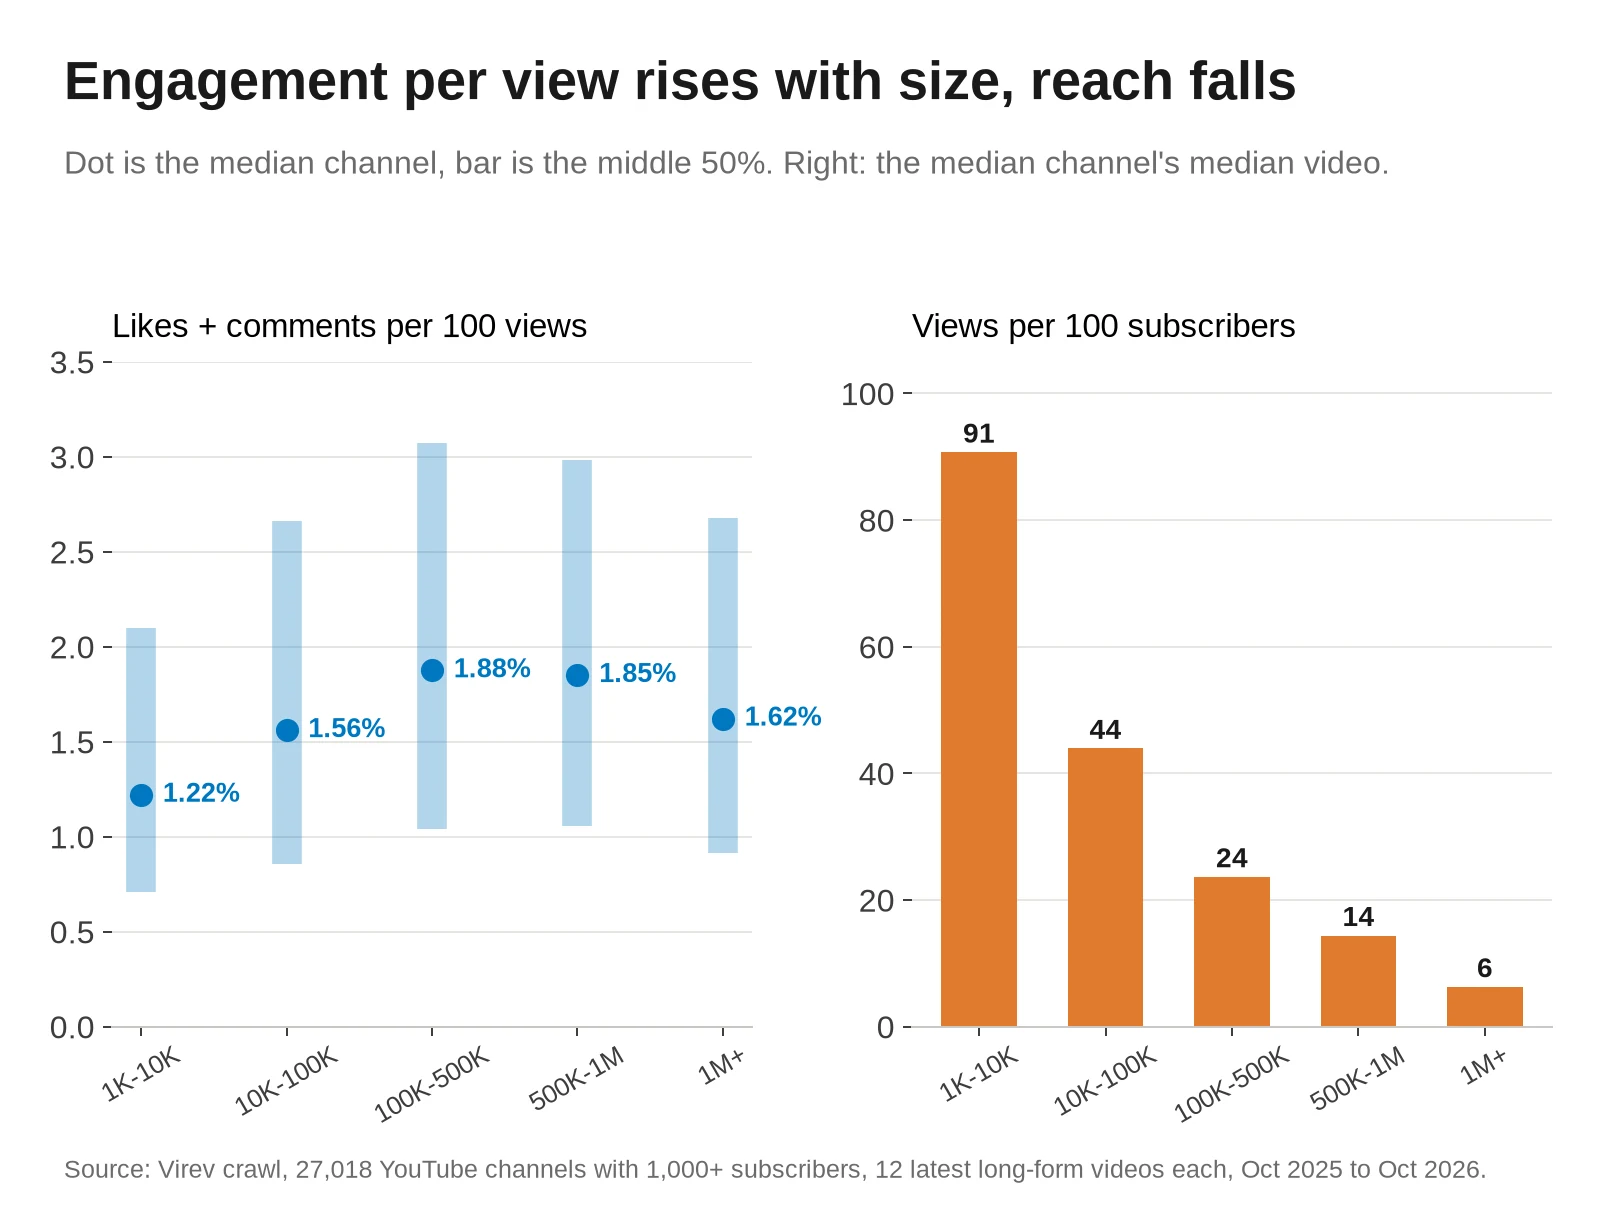
| 1K-10K | 5,769 | 1.22% | 0.09 | 91 |
| 10K-100K | 8,010 | 1.56% | 0.12 | 44 |
| 100K-500K | 6,565 | 1.88% | 0.15 | 24 |
| 500K-1M | 2,526 | 1.85% | 0.14 | 14 |
| 1M+ | 4,148 | 1.62% | 0.10 | 6 |
Small channels get the fewest likes and comments per view. Instagram and TikTok benchmarks divide by followers, and on that base small YouTube channels lead too, as the subscriber numbers below show. Small channels do lead on reach. A channel with 1,000 to 10,000 subscribers gets a median of 91 views per 100 subscribers on a video, and a channel above 1 million gets 6.
The same pattern holds inside one country. US channels go from 1.32% at 1,000 to 10,000 subscribers to 2.12% at 100,000 to 500,000 and 1.75% above 1 million. Removing the 227 channels in this table that Virev labels as a brand, business or media outlet moves no band by more than 0.02 points.
If you divide by subscribers instead of views, the order flips. The median channel with 1,000 to 10,000 subscribers gets 5.84 likes and comments per 100 subscribers on a video, and the median channel above 1 million gets 0.18. That number mostly measures how far a video travels past the subscriber count, so we do not use it to compare channels.
How our numbers compare with other benchmarks
| Source | Sample | Median | Smallest channels | Largest channels |
|---|---|---|---|---|
| Virev, long-form only | 27,018 channels | 1.59% | 1.22% (1K-10K) | 1.62% (1M+) |
| SociaVault | 75,000 channels | 3.06% | 5.23% (1K-10K) | 1.41% (500K+) |
| Acurrate | 136,811 creators | not given | 4.40% (1K-10K) | 3.23% (1M+) |
SociaVault puts Shorts at about 3.8% and long-form at about 2.7%, so part of its higher median may come from Shorts. Our sample has no Shorts, and SociaVault's long-form figure is still 1.7 times our median. Both other benchmarks also say the rate falls as channels grow, while ours rises up to 500,000 subscribers. We cannot check their samples. We did check ours. We checked 8 videos on the live YouTube page, and the like count was equal to ours or up to 1.4% higher on 7 of them and 45% higher on one video posted October 14, which fits counts that kept growing after our read.
Engagement rate by country
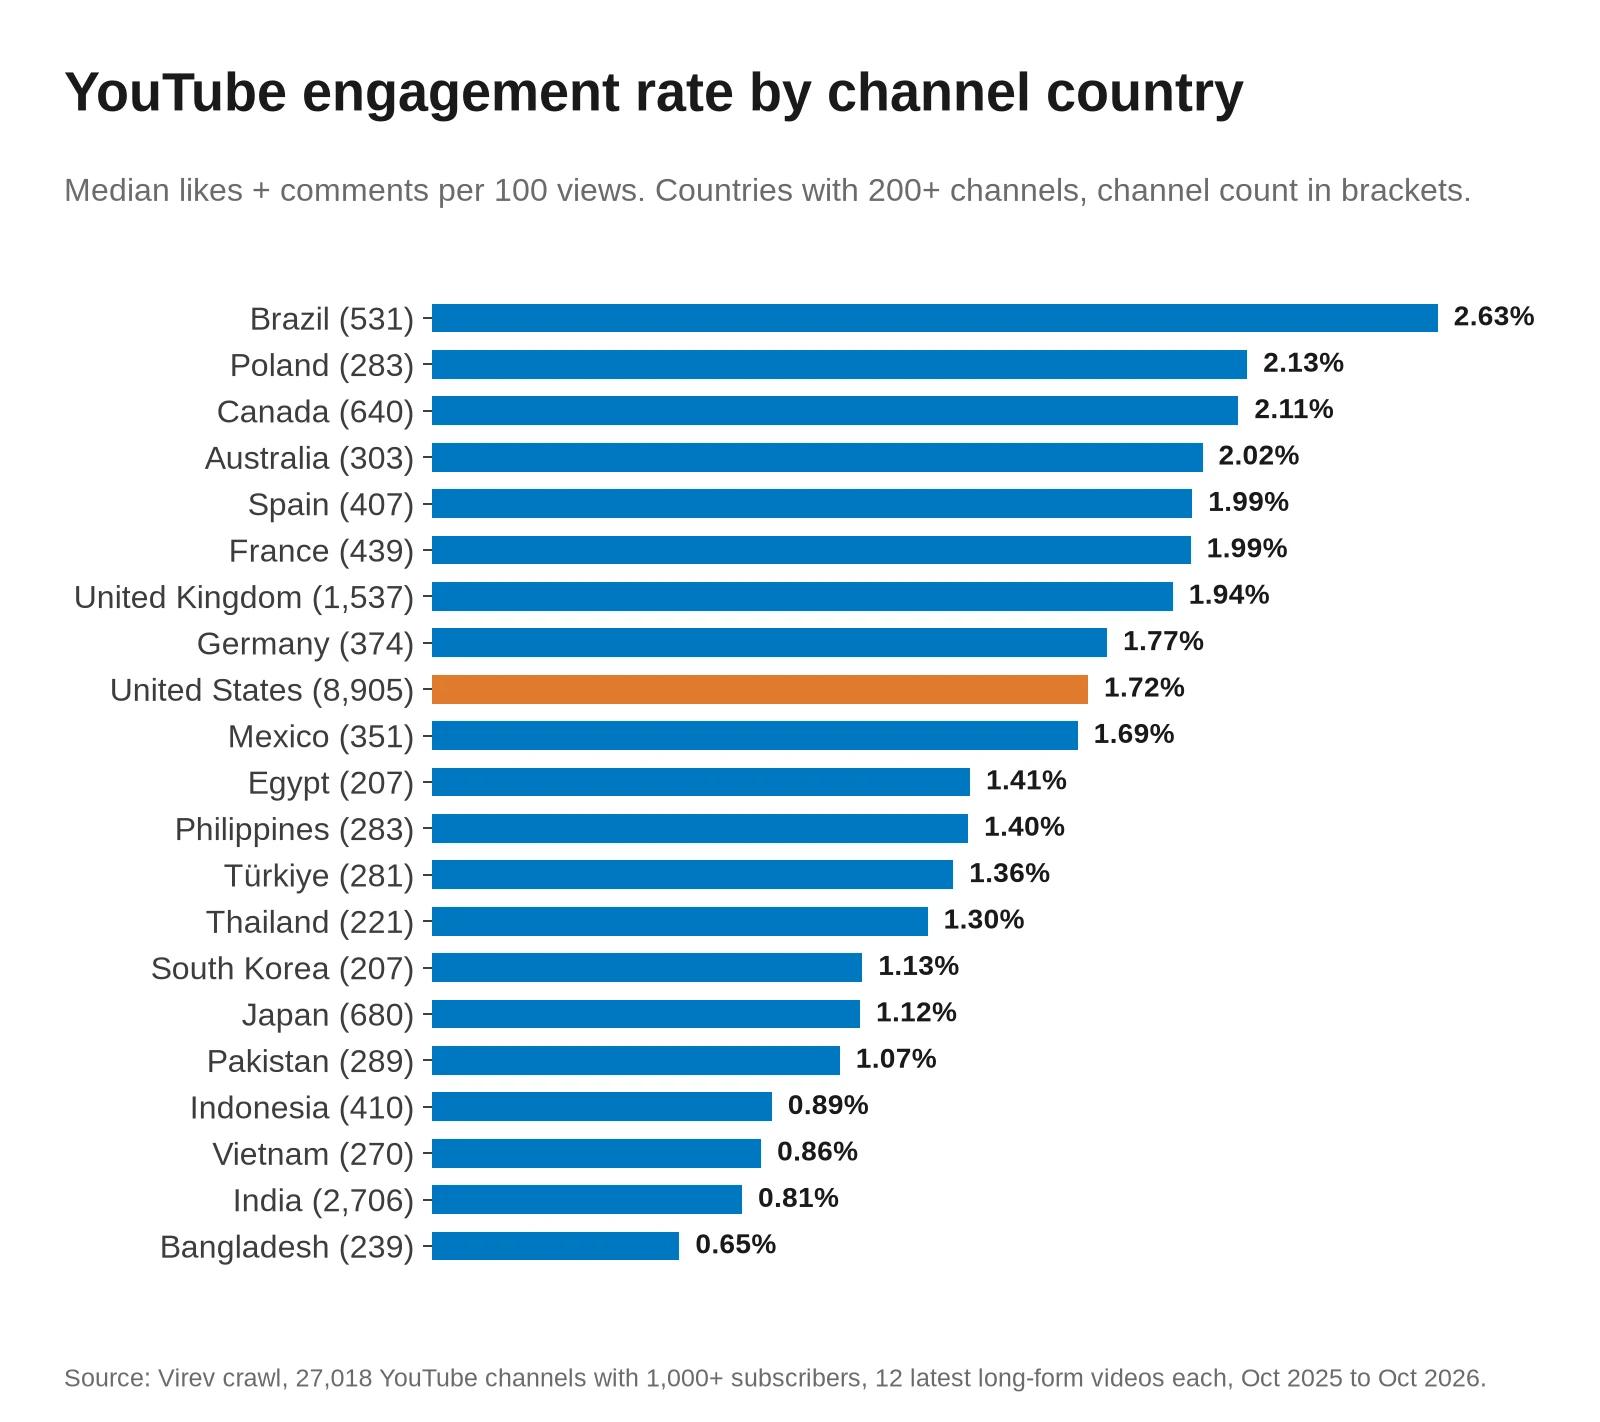
| Channel country | Channels | Median rate |
|---|---|---|
| Brazil | 531 | 2.63% |
| Poland | 283 | 2.13% |
| Canada | 640 | 2.11% |
| Australia | 303 | 2.02% |
| Spain | 407 | 1.99% |
| France | 439 | 1.99% |
| United Kingdom | 1,537 | 1.94% |
| Germany | 374 | 1.77% |
| United States | 8,905 | 1.72% |
| Mexico | 351 | 1.69% |
| Egypt | 207 | 1.41% |
| Philippines | 283 | 1.40% |
| Türkiye | 281 | 1.36% |
| Thailand | 221 | 1.30% |
| South Korea | 207 | 1.13% |
| Japan | 680 | 1.12% |
| Pakistan | 289 | 1.07% |
| Indonesia | 410 | 0.89% |
| Vietnam | 270 | 0.86% |
| India | 2,706 | 0.81% |
| Bangladesh | 239 | 0.65% |
Brazilian channels get the most likes and comments per view, at 2.63%. Channels in India, Bangladesh, Vietnam and Indonesia get under 0.9%. So a 1% rate is normal for an Indian channel and weak for a Brazilian one. Compare a channel with others in its own country before you call its rate low.
Engagement rate by category
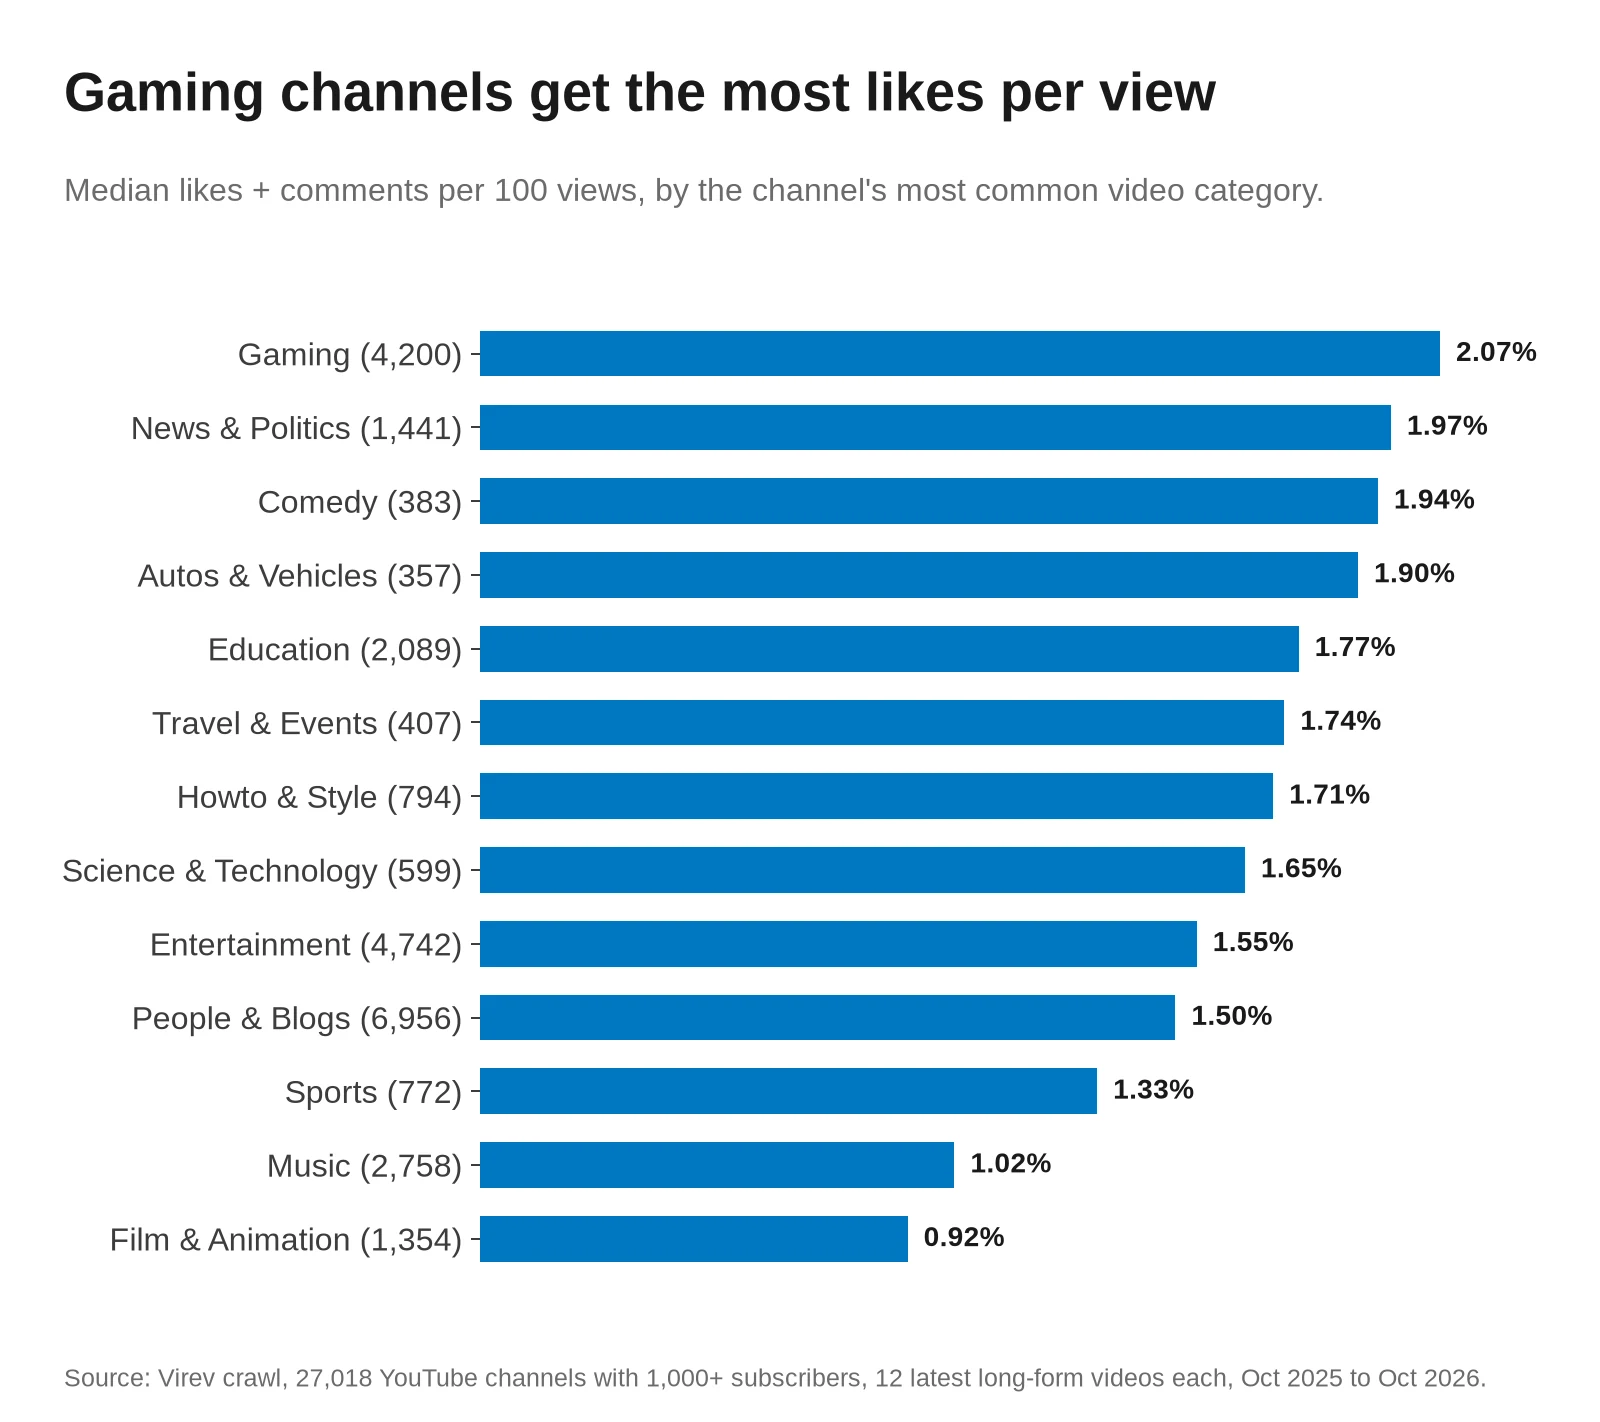
| Category | Channels | Median rate |
|---|---|---|
| Gaming | 4,200 | 2.07% |
| News & Politics | 1,441 | 1.97% |
| Comedy | 383 | 1.94% |
| Autos & Vehicles | 357 | 1.90% |
| Education | 2,089 | 1.77% |
| Travel & Events | 407 | 1.74% |
| Howto & Style | 794 | 1.71% |
| Science & Technology | 599 | 1.65% |
| Entertainment | 4,742 | 1.55% |
| People & Blogs | 6,956 | 1.50% |
| Sports | 772 | 1.33% |
| Music | 2,758 | 1.02% |
| Film & Animation | 1,354 | 0.92% |
Gaming channels lead at 2.07%. Music and Film and Animation channels get about 1 like or comment per 100 views.
Engagement rate by video length
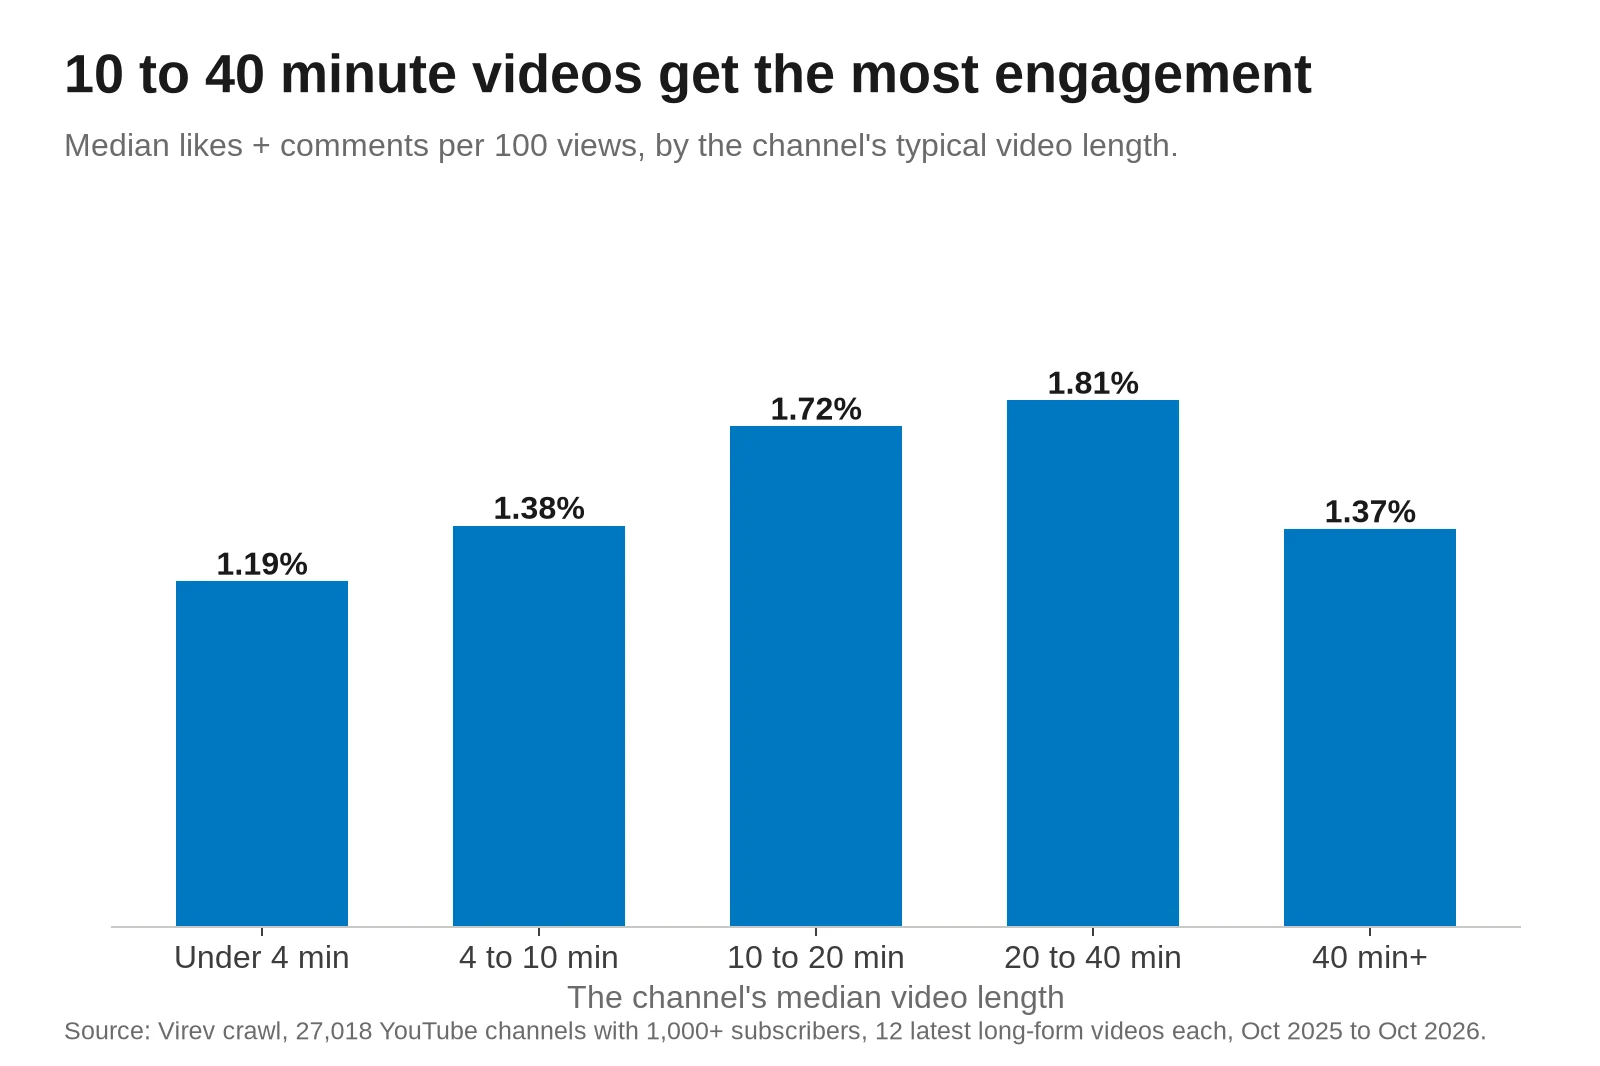
| Typical video length | Channels | Median rate |
|---|---|---|
| Under 4 min | 1,257 | 1.19% |
| 4 to 10 min | 2,785 | 1.38% |
| 10 to 20 min | 7,203 | 1.72% |
| 20 to 40 min | 8,308 | 1.81% |
| 40 min+ | 7,465 | 1.37% |
Channels whose videos run 10 to 40 minutes get the most likes and comments per view. Channels with videos under 4 minutes get the fewest.
How to use these numbers
- Use views as the base when you compare YouTube channels, because the subscriber count says little about who watched a given video.
- Compare a channel with channels of its own size, country and category, because a 1.2% rate is above the median for an Indian channel (0.81%) and below the bottom quarter of gaming channels (1.39%).
- Treat 2.7% as good and 1.6% as typical for long-form videos, because those are the 75th percentile and the median in our data.
- Check comments apart from likes, because the median channel gets 0.12 comments per 100 views and only a quarter of channels get more than 0.25.
- Brands can filter YouTube creators by subscriber count, country and category in Virev creator search, which covers 180M+ creators.
- The free YouTube money calculator estimates what a channel earns from its views.
For Instagram and TikTok, see our Instagram engagement rate benchmarks and TikTok engagement rate benchmarks. For what YouTube pays per view, see how much YouTube pays per view.
How we measured, and what can be wrong
- The sample is every public YouTube channel with 1,000 or more subscribers that Virev's crawler read from August 6 to October 19, 2026 and that had at least 6 long-form videos posted since October 1, 2025. That is 33,465 channels in 117 countries.
- For each channel we took its 12 most recent long-form videos that were at least 3 days old at the channel's read, 389,600 videos in all. Shorts and live streams are left out.
- YouTube shows a comment count on some reads and not on others. Engagement rates use the 27,018 channels with a comment count on at least 3 of their videos, and only those videos, 282,950 in all. Likes alone, on all 33,465 channels, give a median of 1.38 likes per 100 views.
- A channel's rate is the sum of its likes and comments divided by the sum of its views. Taking the median of each video's rate instead gives 1.76% for the median channel, with the same rise up to 100,000 to 500,000 subscribers and fall above that.
- Likes keep coming in after we read a video. Videos read 90 or more days after posting have a median rate of 2.86%, against 1.62% for videos read 7 to 29 days after posting, so channels with older videos in their 12 may score higher. We use the channel's last crawl date as the read date for all its videos, so a video's age at read is approximate.
- The country is the one the channel lists on YouTube. Channels without one count in every table except the country table.
- The sample is the set of channels Virev crawls, which leans toward channels that brands search for, and is not a random draw from all of YouTube.
Download the data
The tables behind every chart are in one CSV: youtube-engagement-rate-2026.csv. Each row has a table name, a group and a metric. The tables are all_channels, by_subscriber_tier, by_subscriber_tier_us, by_subscriber_tier_creators_only, by_channel_country, by_video_category and by_typical_video_length. The metrics are er_views (likes plus comments per 100 views), like_rate, comment_rate, views_per_100_subs and er_subs (likes plus comments per 100 subscribers). Please cite "Virev, October 2026" and link this page.