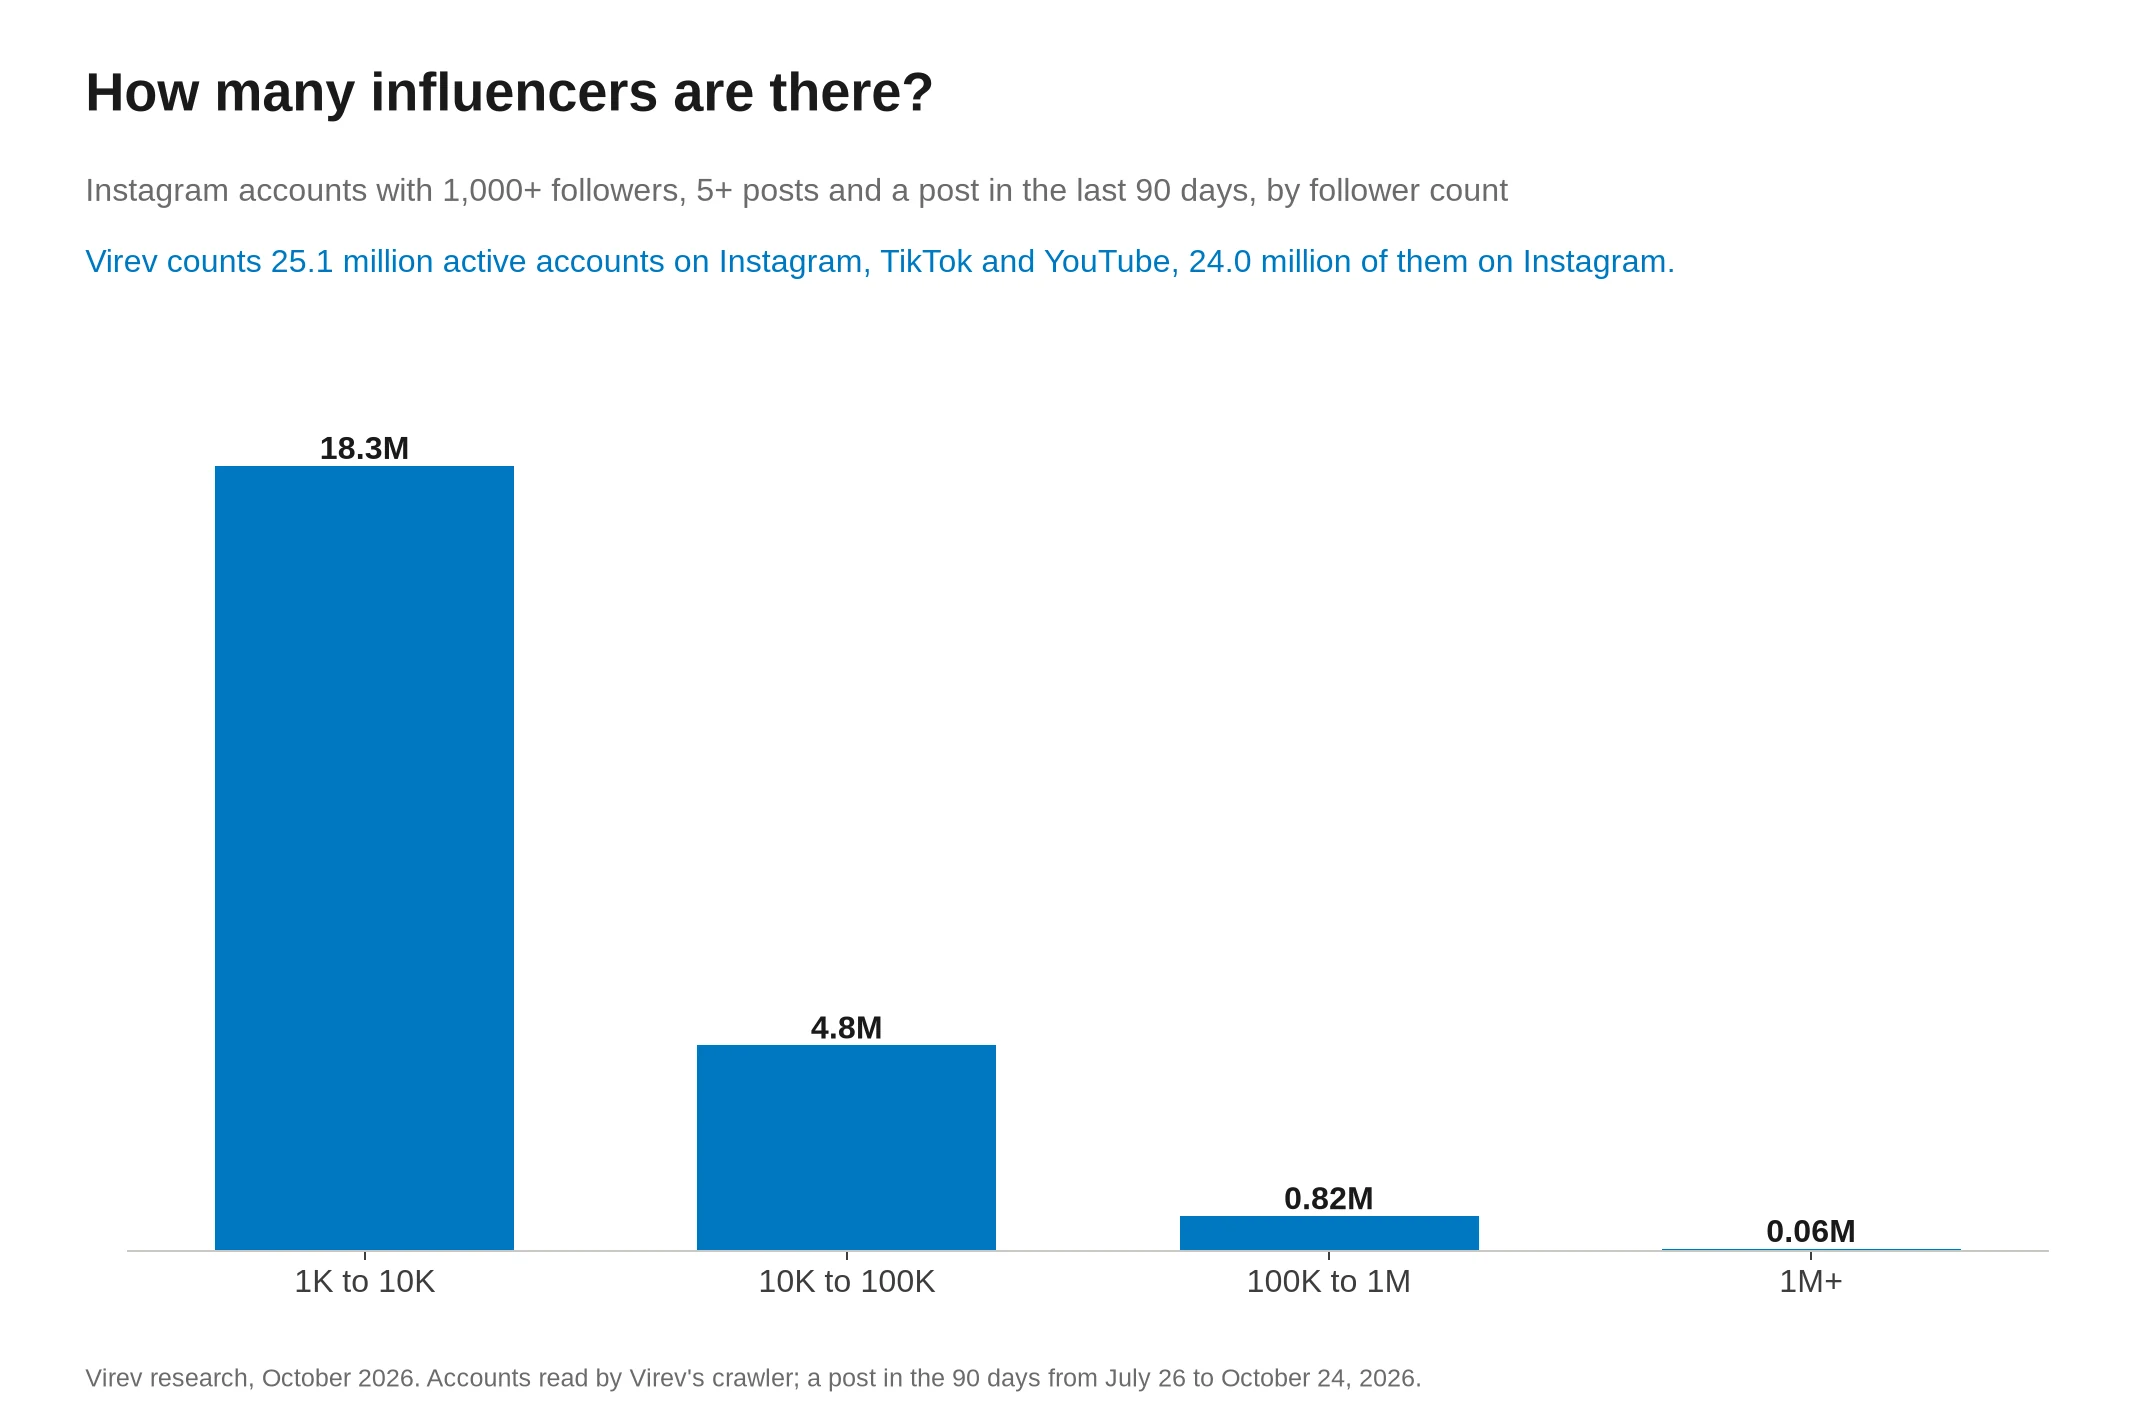




A macro influencer is a creator with about 100,000 to 1 million followers on one platform. A mega influencer has more than 1 million. Both are rare. In Virev's index of 180M+ creators, 1 in 41 Instagram accounts with 1,000+ followers is in the macro range and 1 in 600 is mega. We measured 32,541 Instagram creators and 79,596 TikTok accounts in this range, split into four bands, and counted how many of the big accounts are not creators at all.
The pages that rank for "macro influencer" do not agree on the range. Brandwatch and Influencity say 100,000 to 1 million. Aspire says 200,000 to 1 million. Shopify says 500,000 to 1 million, and IZEA calls everyone above 500,000 a mega influencer. Influee and Influencer Marketing Hub print an engagement rate per tier with no sample size or method on the page. Influee splits the range at 500,000 in words only. None of them counts how many such accounts exist, measures each band, or checks how many of those accounts are brands. This page does all three, from accounts Virev's crawler read between August 3 and October 1, 2026.
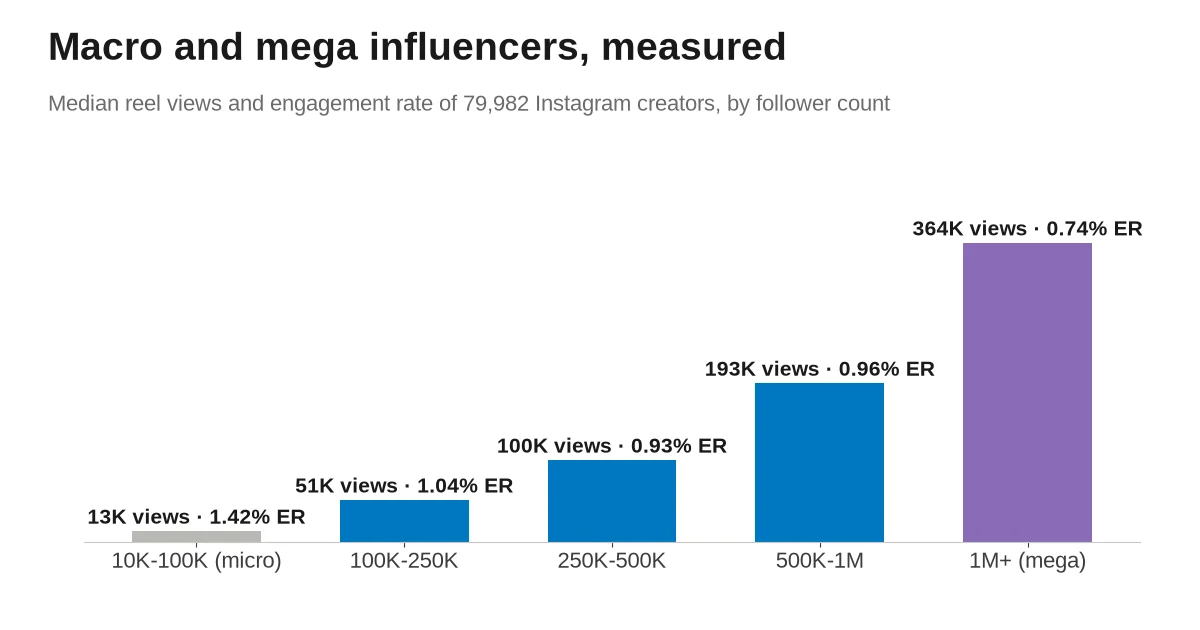
0.93% to 1.04%
Macro engagement rate
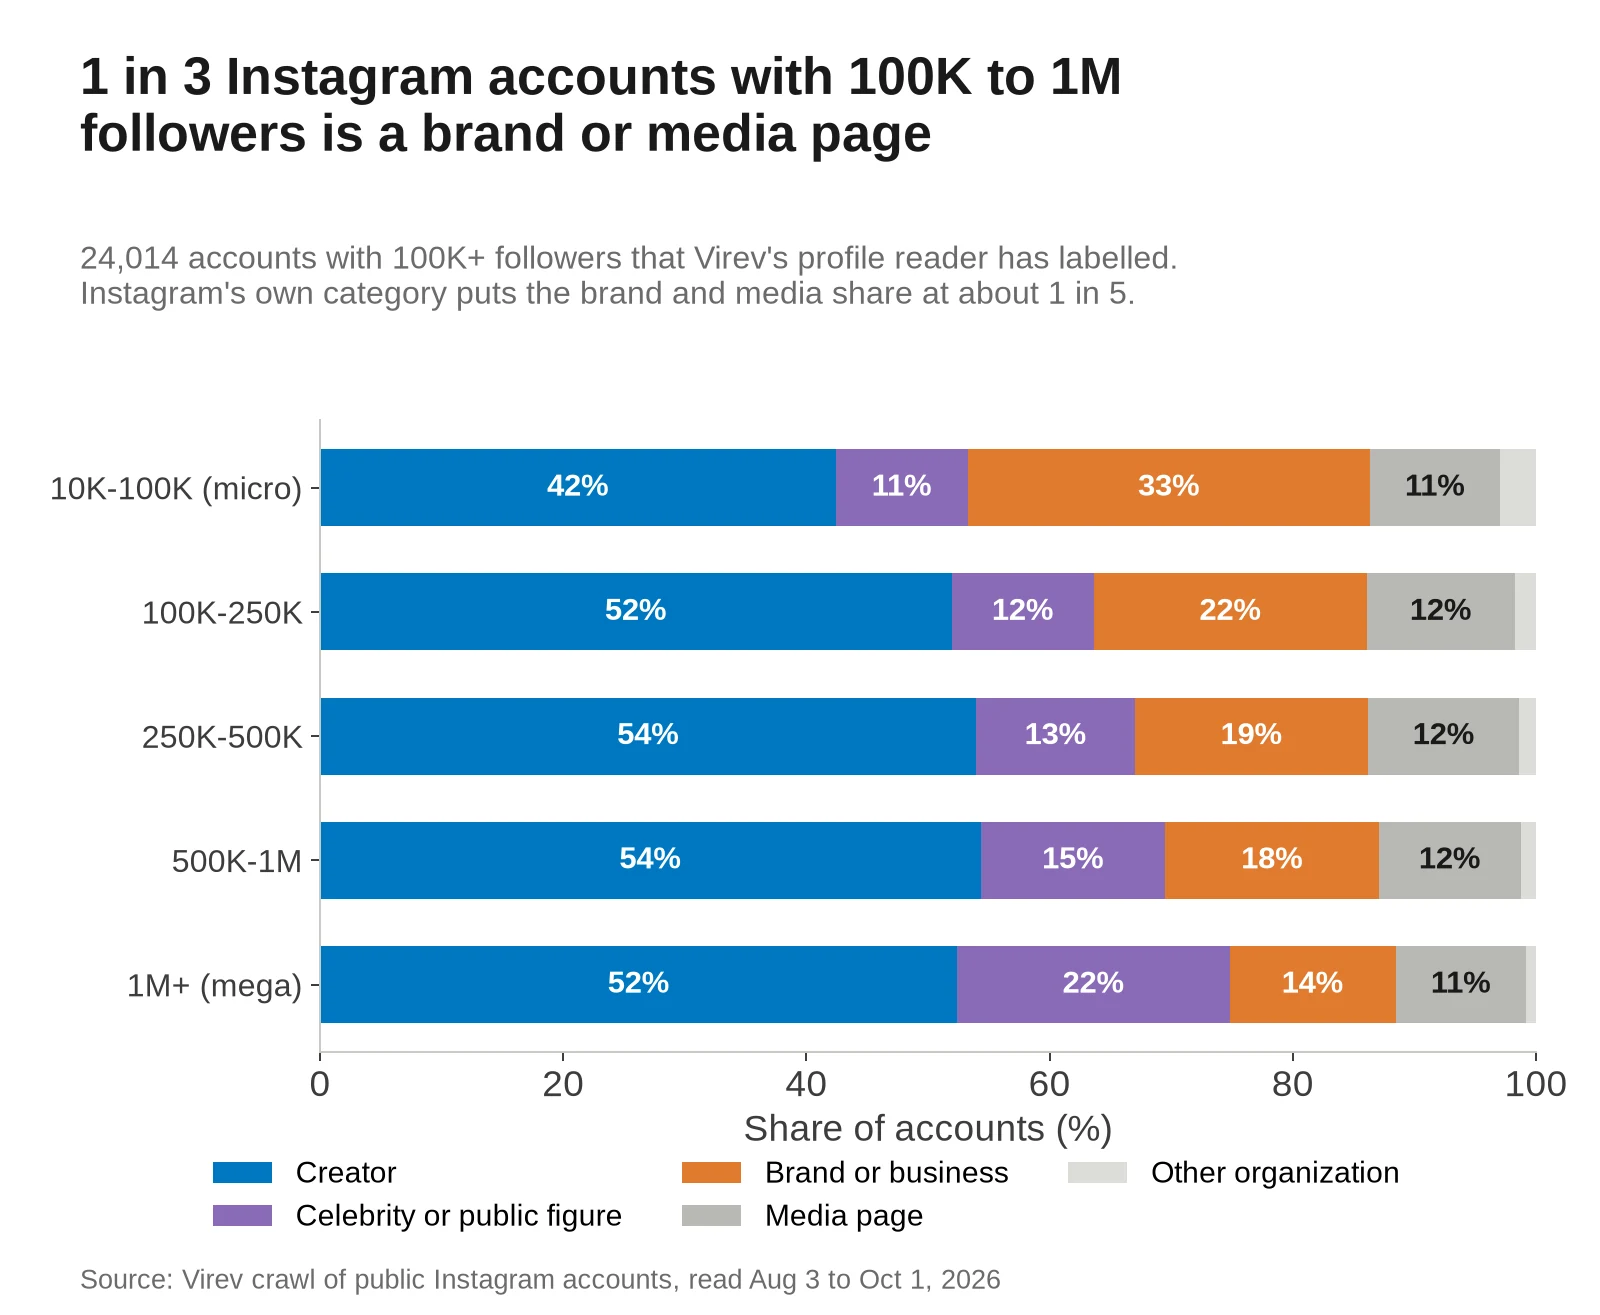
1 in 3
Macro accounts that are not creators
51K to 193K
Views per reel
Influencer tiers by follower count
Most guides sort influencers into four or five tiers by the follower count on one platform. These are the ranges this study uses:
| Tier | Followers | Who is usually in it |
|---|---|---|
| Nano | 1,000 to 10,000 | Hobbyists, local creators, customers who post |
| Micro | 10,000 to 100,000 | Niche creators with a steady audience |
| Macro | 100,000 to 1M | Full-time creators, plus many brands, media pages and public figures |
| Mega | 1M and more | Top creators, celebrities, athletes, musicians and big brands |
Some guides, and some of our own earlier studies, call 100,000 to 500,000 "mid-tier" and keep "macro" for 500,000 to 1 million. We split the macro range into three bands (100K to 250K, 250K to 500K and 500K to 1M), so you can read the numbers either way. For the tiers below 100,000, see our study of micro and nano influencers, which prices 100 nano creators against one macro creator. In Asia the same ladder is often called KOL tiers, and our KOL study measures it in Korea, Japan and the US.
How many macro and mega influencers there are
These are the accounts in Virev search on October 24, 2026, by platform and follower band. The counts include every account type, so brands and media pages are in them.
| Followers | TikTok | YouTube | |
|---|---|---|---|
| 100K to 250K | 653,029 | 135,701 | 25,118 |
| 250K to 500K | 208,073 | 69,207 | 15,165 |
| 500K to 1M | 95,642 | 43,947 | 10,817 |
| 1M+ | 65,079 | 45,038 | 14,555 |
| All macro, 100K to 1M | 956,744 | 248,855 | 51,100 |
Instagram has the most by far, with 956,744 accounts with 100,000 to 1 million followers and 65,079 with more. The count falls fast with size, from 653,029 accounts at 100K to 250K to 95,642 at 500K to 1M. Our TikTok and YouTube crawls start from larger accounts, so their counts cover a bigger share of the big accounts on those platforms than of the small ones. For where creators sit on the full follower ladder, see our average Instagram followers study, where the top 10% of creator accounts start at 544,763 followers.
1 in 3 macro accounts is a brand or media page
A search for accounts with 100,000 to 1 million followers returns more than creators. Virev's profile reader labels each account it reads as a creator, a brand or business, a media page or another organization, and we marked actors, musicians, athletes and politicians as celebrities or public figures.
| Followers | Labelled accounts | Creator | Celebrity or public figure | Brand or business | Media page |
|---|---|---|---|---|---|
| 10K to 100K (micro) | 58,172 | 42% | 11% | 33% | 11% |
| 100K to 250K | 13,650 | 52% | 12% | 22% | 12% |
| 250K to 500K | 5,647 | 54% | 13% | 19% | 12% |
| 500K to 1M | 2,733 | 54% | 15% | 18% | 12% |
| 1M+ (mega) | 1,984 | 52% | 22% | 14% | 11% |
Across the macro range, 21% of labelled accounts are brands or businesses and 12% are media pages, such as news, meme and fan pages. Another 12.5% are celebrities or public figures. The celebrity share grows with size and reaches 22% above 1 million followers, where many accounts belong to people who got famous somewhere else first.
Instagram's own account category gives a lower brand share. Among the 77,968 macro accounts that set a category or have a Virev label, 10% are brands and 9.5% media pages, so about 1 in 5. Half of the accounts set no category at all, and a page that sells products can still call itself a "Digital creator". Read the brand and media share as between 1 in 5 and 1 in 3.
For a brand that wants to hire creators, this means one account in three on a list of "accounts with 100K to 1M followers" is a brand or a media page. Filter on account type before you count the market.
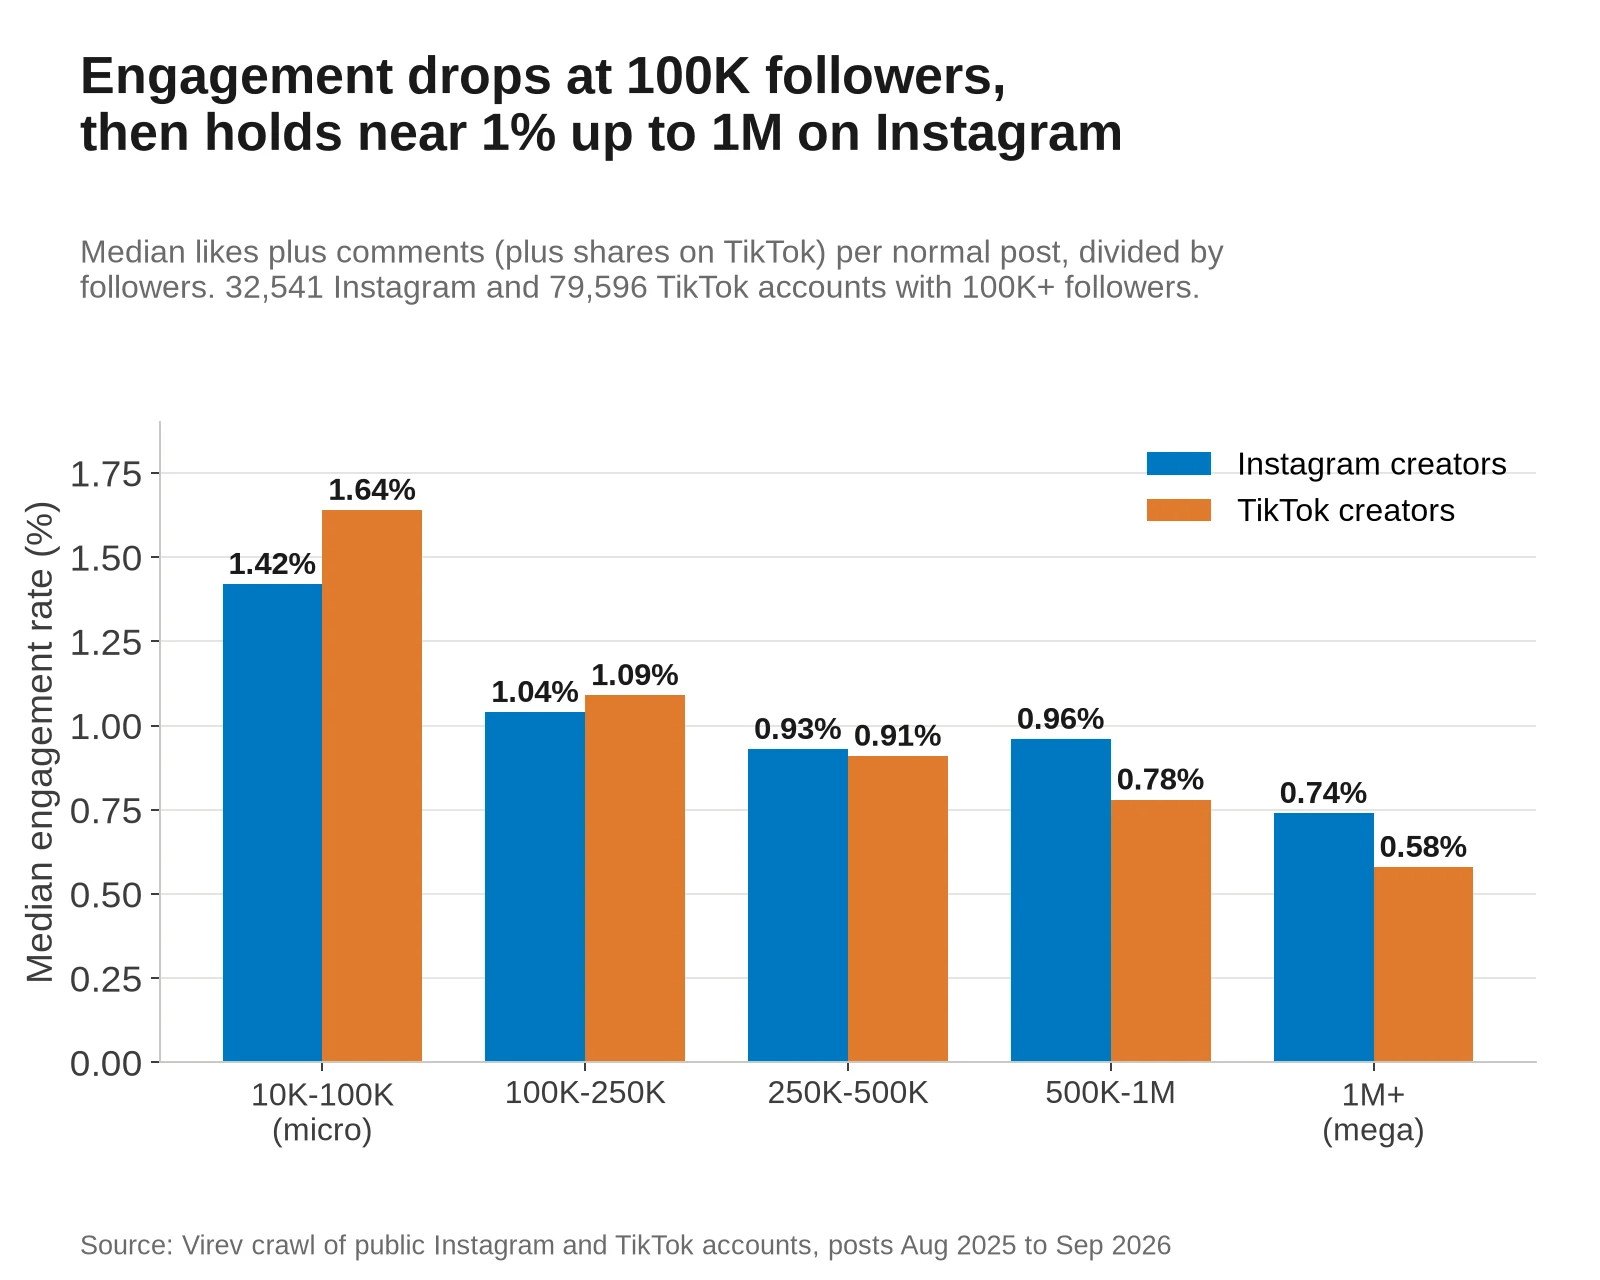
Engagement holds near 1% from 100K to 1M followers
This table covers Instagram creators only, without brands, media pages and celebrities.
| Followers | Creators | Engagement rate | Likes + comments | Reel views | Views per follower | Any sponsored post | Posts a week |
|---|---|---|---|---|---|---|---|
| 10K to 100K (micro) | 47,441 | 1.42% | 434 | 13,068 | 42% | 16% | 2.0 |
| 100K to 250K | 13,605 | 1.04% | 1,647 | 51,060 | 33% | 23% | 2.1 |
| 250K to 500K | 7,327 | 0.93% | 3,278 | 99,676 | 29% | 23% | 2.1 |
| 500K to 1M | 6,201 | 0.96% | 6,706 | 193,402 | 28% | 24% | 2.1 |
| 1M+ (mega) | 5,408 | 0.74% | 13,196 | 364,480 | 21% | 23% | 1.9 |
The engagement rate falls once, at 100,000 followers, from 1.42% to 1.04%. Inside the macro range it stays between 0.93% and 1.04%. It falls again above 1 million, to 0.74%. So a creator in the 500K to 1M band gets about the same engagement rate as one at 100K to 250K, and about four times the likes and comments on a typical post (6,706 against 1,647). Influee's range of 0.5% to 1.5% holds all three macro band medians, and Influencer Marketing Hub's 2.05% is about twice them. The spread inside every band is wide. The middle half of creators with 250K to 500K followers runs from 0.38% to 2.52%.
The share of creators with at least one sponsored post in the year rises from 16% at micro to 23% at 100,000 followers, and stays there. Sponsored posts are about 2% of everything a macro creator posts. A macro creator posts about twice a week, the same as a micro creator. For the full spread of rates at every size, see our Instagram engagement rate benchmarks.
Views per reel double with each band, reach falls
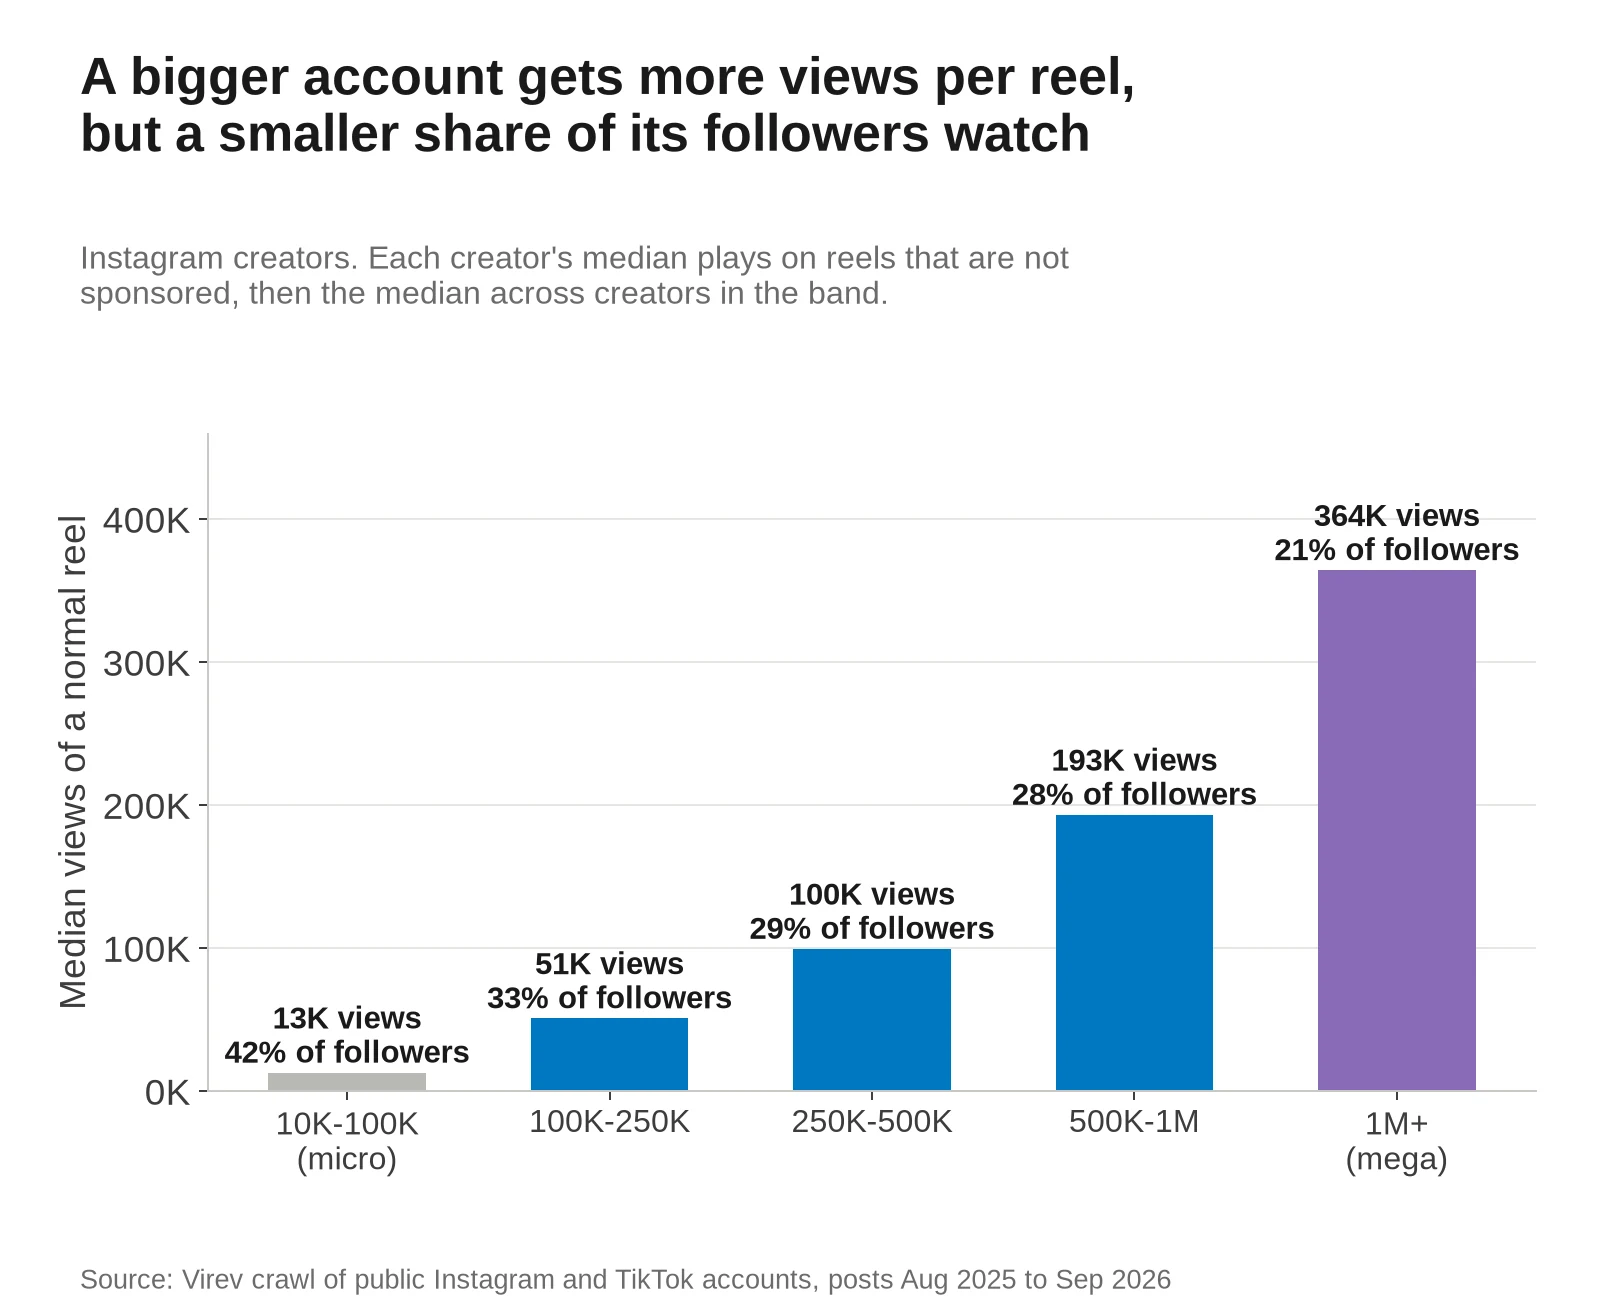
A typical reel from a creator with 100K to 250K followers gets 51,060 views. At 500K to 1M it gets 193,402, and above 1 million, 364,480. Each step up roughly doubles the views. The share of followers who watch falls with size, from 33% at the bottom of the macro range to 21% for mega creators.
Follower count is a loose guide to views at this size. Of the creators with 100K to 250K followers, 14.7% get fewer views on a typical reel than the median micro creator does (13,068). Another 19% get more views than they have followers. Above 1 million followers, 28% of creators get views from less than a tenth of their audience. Check a creator's last 10 reels before you trust the follower count.
Celebrities post less, brands get a quarter of the engagement
Inside the 100K to 1M range, the account type changes the numbers more than the band does.
| Account type | Accounts | Engagement rate | Reel views | Views per follower | Any sponsored post | Posts a week |
|---|---|---|---|---|---|---|
| Creators | 27,133 | 1.00% | 83,004 | 30% | 23% | 2.1 |
| Celebrities and public figures | 4,933 | 1.14% | 73,041 | 26% | 13% | 1.4 |
| Brands and businesses | 5,504 | 0.26% | 27,053 | 12% | 6% | 4.0 |
| Media pages | 4,550 | 0.47% | 41,286 | 17% | 10% | 5.0 |
Celebrities and public figures get the highest engagement rate, 1.14%, but post 1.4 times a week and only 13% of them posted a sponsored post in the year, against 23% of creators. Brand accounts post four times a week and get 0.26%, a quarter of a creator's rate. Media pages post five times a week. If you rank accounts with 100K+ followers by engagement without removing these pages, the brands and media pages sink to the bottom and the celebrities rise to the top.
TikTok follows the same ladder, with a steeper drop
| Followers | Accounts | Engagement rate | Video views | Views per follower | Any sponsored video | Videos a week |
|---|---|---|---|---|---|---|
| 10K to 100K (micro) | 87,454 | 1.64% | 9,010 | 29% | 3% | 2.6 |
| 100K to 250K | 29,059 | 1.09% | 27,900 | 18% | 6% | 3.0 |
| 250K to 500K | 18,218 | 0.91% | 48,300 | 14% | 7% | 3.1 |
| 500K to 1M | 13,772 | 0.78% | 77,300 | 11% | 9% | 3.2 |
| 1M+ (mega) | 18,547 | 0.58% | 188,400 | 8% | 13% | 3.3 |
A TikTok account with 500K to 1M followers gets views from 11% of its followers on a typical video, against 28% for an Instagram creator in the same band. The share with a sponsored video rises with every band and reaches 13% above 1 million. TikTok's paid partnership label is not in our data, so these shares count caption tags such as #ad only, and the real shares are higher. On TikTok the engagement rate also counts shares. The TikTok sample keeps every account that is not labelled a brand, business, media page or organization, which is the same filter as our TikTok engagement rate benchmarks.
Macro influencers by niche and country
Virev's profile reader gives each account a niche. Among Instagram creators and public figures with 100K to 1M followers, the share who sold a post differs a lot by niche.
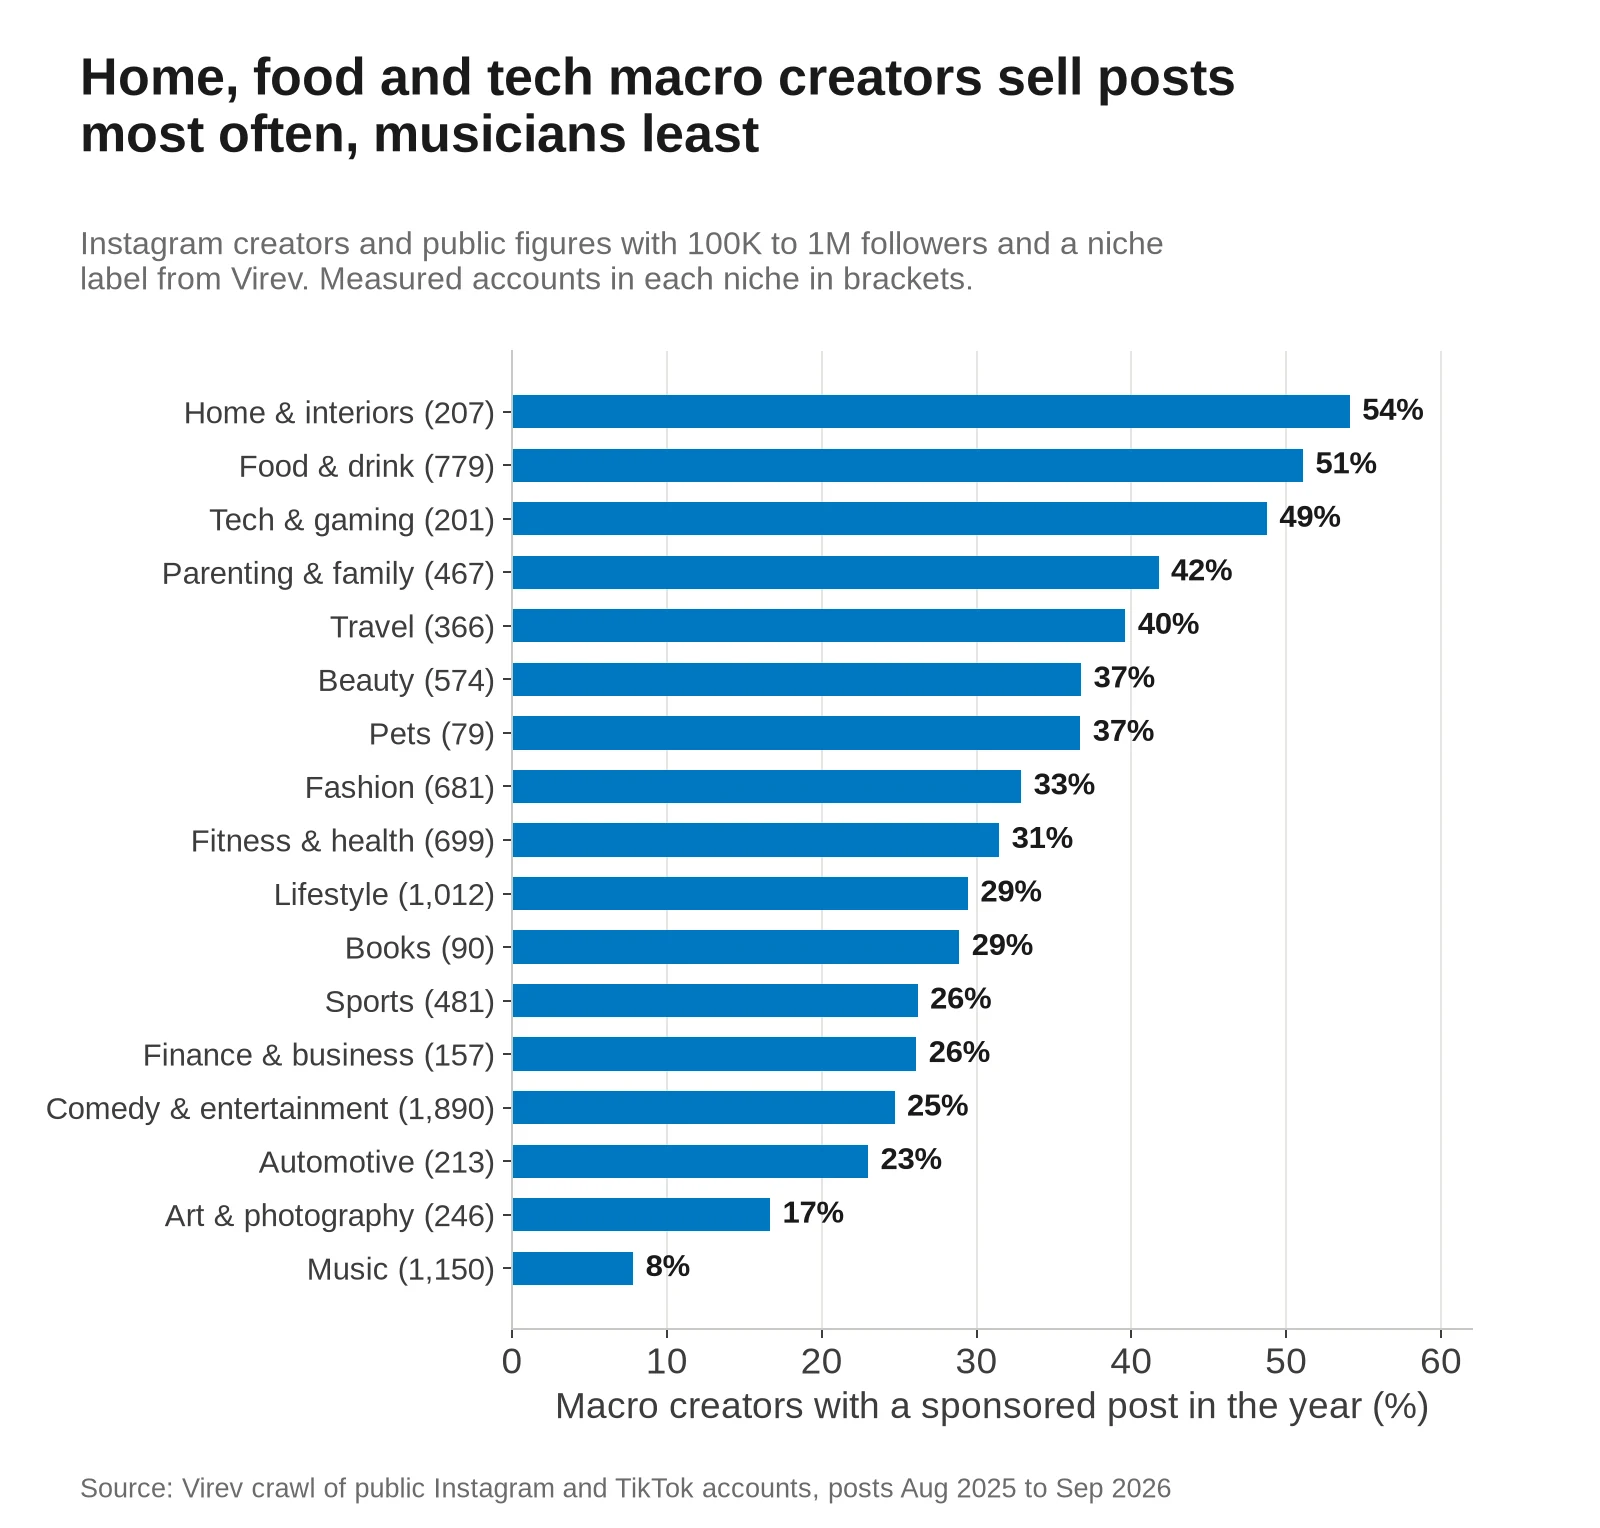
Half of macro creators in home, food and tech posted a sponsored post in the year. Only 8% of musicians did. Comedy and entertainment is the biggest macro niche, with 2,547 accounts, and a quarter of them sold a post. Food creators sell many posts with modest numbers, at 0.63% engagement and 74,768 views per reel, against 1.25% and 91,222 in comedy.
Country is known for 12,619 of the macro and mega creators and public figures in our data. These are the twelve largest groups.
| Country | Macro accounts | Mega accounts | Engagement rate | Reel views |
|---|---|---|---|---|
| United States | 1,773 | 229 | 0.66% | 38,425 |
| Brazil | 1,714 | 209 | 0.63% | 35,972 |
| India | 1,738 | 166 | 1.24% | 97,864 |
| United Kingdom | 455 | 43 | 0.79% | 55,803 |
| Indonesia | 404 | 65 | 1.17% | 75,088 |
| Mexico | 269 | 36 | 0.71% | 38,290 |
| Turkey | 279 | 18 | 0.92% | 153,004 |
| Italy | 261 | 25 | 1.28% | 119,792 |
| Argentina | 265 | 15 | 0.69% | 62,122 |
| Germany | 236 | 17 | 1.15% | 107,046 |
| France | 224 | 13 | 1.61% | 103,884 |
| Spain | 211 | 17 | 0.99% | 96,636 |
The US, Brazil and India each have about 1,700 macro accounts with a known country. Their numbers differ a lot. A US macro creator's typical reel gets 38,425 views and an Indian one's 97,864, at a similar follower count. The engagement and view medians come from 166 to 1,428 measured macro accounts per country, so treat them as samples, not national averages. To find creators in one market, Virev search filters by country.
When one macro creator beats a group of micro creators
The usual reason to hire a macro creator is reach in one deal. We measured that on sponsored reels, meaning posts with Instagram's paid partnership label or an ad tag such as #ad, by creators in each band.
| Followers | Sponsored reels | Creators | Median views | Engagement vs usual post | Views vs usual reel | Creators for 1M views |
|---|---|---|---|---|---|---|
| 10K to 100K (micro) | 31,092 | 7,016 | 13,428 | 0.76x | 0.87x | 75 |
| 100K to 250K | 15,138 | 2,999 | 58,520 | 0.67x | 0.83x | 18 |
| 250K to 500K | 6,969 | 1,599 | 98,365 | 0.55x | 0.79x | 11 |
| 500K to 1M | 6,116 | 1,423 | 188,088 | 0.48x | 0.76x | 6 |
| 1M+ (mega) | 4,940 | 1,189 | 372,169 | 0.47x | 0.73x | 3 |
A typical sponsored reel from a creator with 100K to 250K followers got 58,520 views. To reach 1 million sponsored reel views with typical creators, you need 75 micro creators, 18 creators at 100K to 250K, 6 at 500K to 1M, or 3 mega creators. Each creator is a contract, a brief, a review round and an invoice, so the macro route is far less work.
The drop shows in likes and comments. A macro creator's sponsored post gets 0.48x to 0.67x the likes and comments of their usual post, against 0.76x for micro creators. Views hold up better, at 0.76x to 0.83x. Our sponsored post engagement study explains how we compare each post with the same creator's usual post.
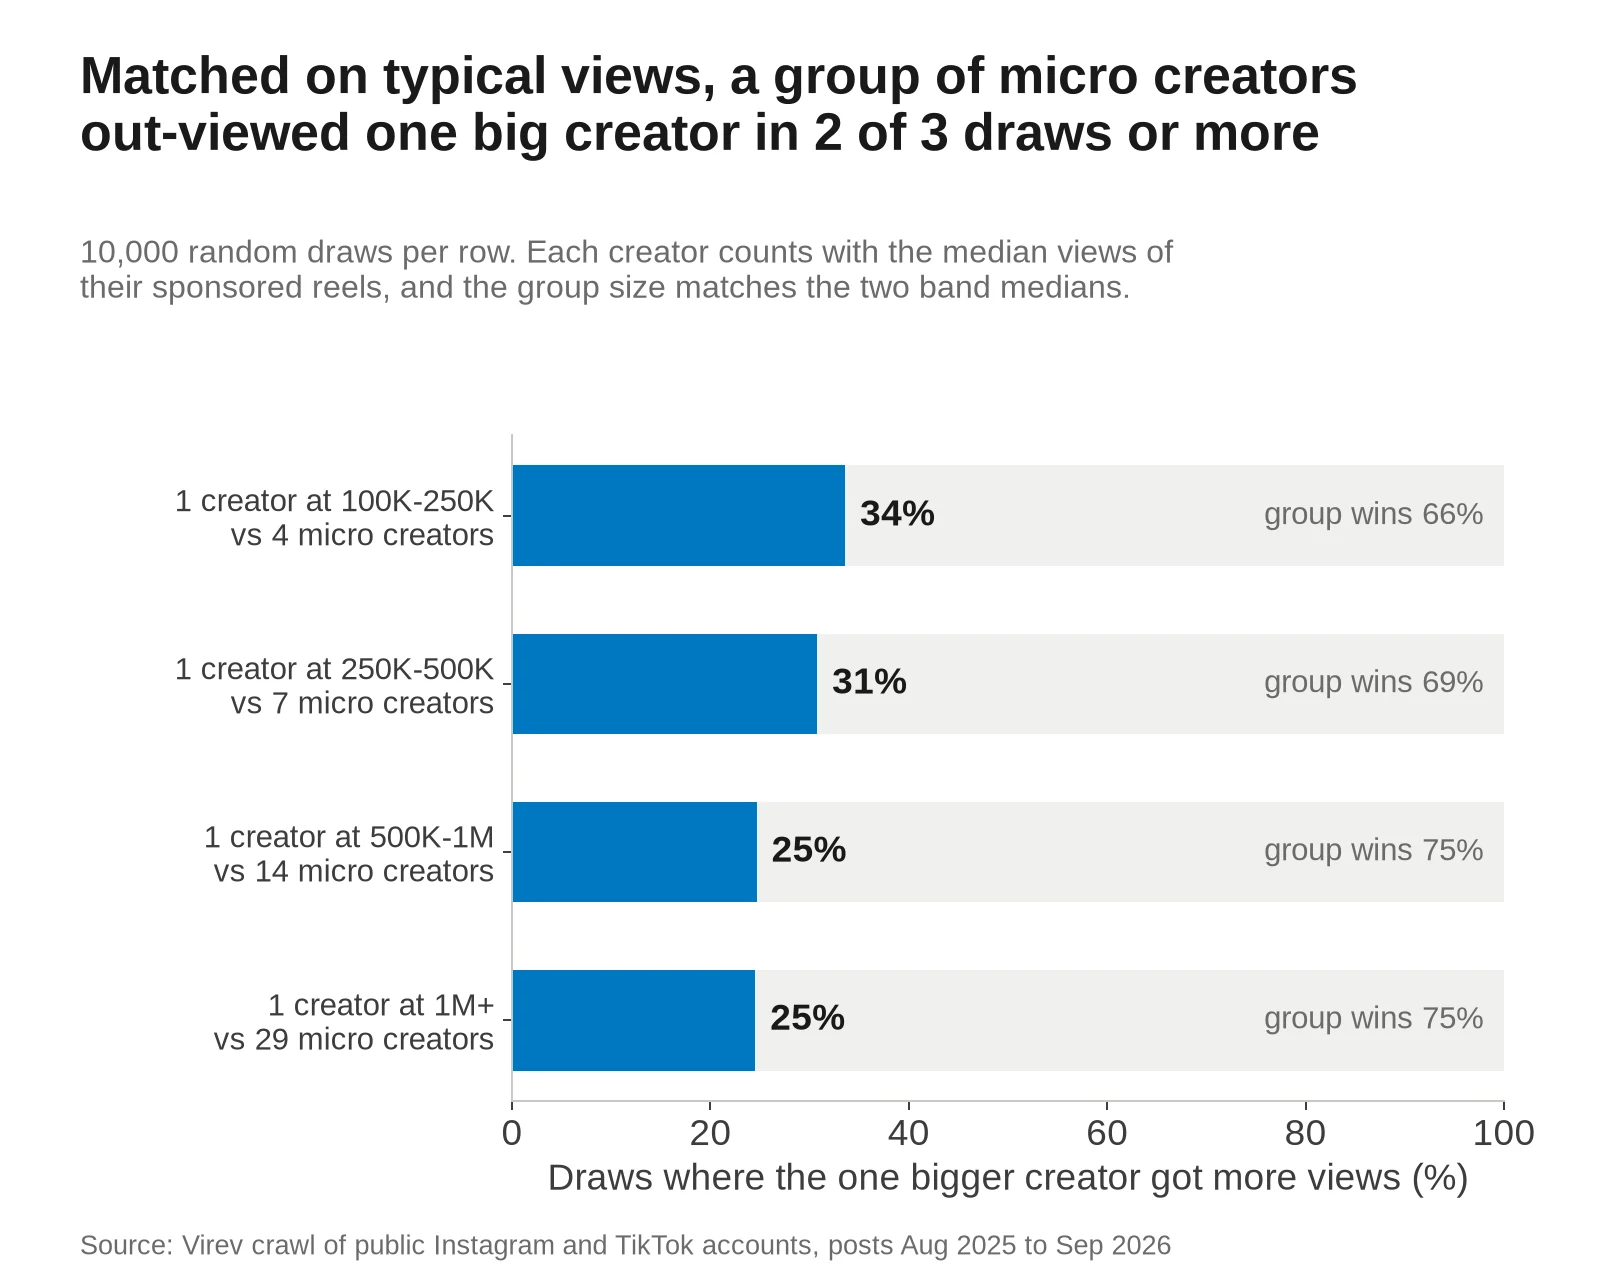
Then we checked how often one bigger creator beats a group of micro creators with the same typical views. In each of 10,000 draws we picked one creator from the band and a group of micro creators, and compared their median sponsored reel views. The group size matches the two medians, from 4 micro creators against one creator at 100K to 250K up to 29 against one mega creator.
| One creator at | Micro creators in the group | One creator wins | Worst 10%, one creator | Worst 10%, group | Best 10%, one creator | Best 10%, group |
|---|---|---|---|---|---|---|
| 100K to 250K | 4 | 34% | 9,695 | 29,641 | 221,273 | 246,401 |
| 250K to 500K | 7 | 31% | 17,318 | 70,236 | 433,550 | 417,226 |
| 500K to 1M | 14 | 25% | 33,222 | 191,038 | 714,776 | 785,059 |
| 1M+ | 29 | 25% | 71,169 | 491,733 | 1,909,756 | 1,486,261 |
The group won two out of three draws or more. A group adds up many results, so one weak reel does not sink it. In the worst 10% of draws, a creator with 500K to 1M followers got 33,222 views and the group of 14 got 191,038. At the top the two are close, and above 1 million followers the best single creators beat the best groups.
One macro creator is the better pick in these cases:
- You need one launch moment, on one day, from one face the audience knows.
- Your team cannot run 15 or 30 contracts, shipments and approvals for one campaign.
- You picked the creator from their real recent views, not from the follower count, so the downside is known.
- You want to run the post as an ad afterwards, where one strong video goes further than many small ones.
A group of micro creators is the better pick in these cases:
- The goal is likes, comments, saves or clicks, since micro creators keep 0.76x of their usual engagement on a sponsored post against 0.48x at 500K to 1M.
- You need a predictable total, because the worst 10% of groups got three to seven times the views of the worst 10% of single creators.
- You want to test several angles or reach several niches in one campaign.
Price is the other half of the decision. Our micro and nano study puts published rates on the same reels and finds a view costs about the same from a micro and a macro creator, and our influencer rates study compares price lists with the views creators get.
Five macro and mega creators whose sponsored posts held up
Most big creators lose engagement on a sponsored post. These five did not. Across the year, their median sponsored post got more likes and comments than their usual post. Follower counts are from Virev's read on October 18 to 21, 2026, and post numbers are from our read of each post.
The Current Place, 121,599 followers
@thecurrentplace documents the conversion of an old wool shed and its land. It posted 21 sponsored reels in six months, most of them for Ryobi New Zealand and Resene's paint line, with the brand as co-author. The median sponsored reel got 1.13x the usual likes and comments and 1.47x the usual views of 39,067. The sponsored reels are renovation episodes, such as a deck rebuild for Ryobi and a garden makeover for Resene. The brands paid for the next step of a project the followers already watch.
Kaitlin Orr, 211,940 followers
@carnivorr travels the world with @andershusa to eat. 28 of her 138 posts in the year carried the paid partnership label, most of them for tourism boards such as Visit Estonia, MyHelsinki, Visit Trondheim and Visit Skåne. Her median sponsored post got 1.56x her usual likes and comments. A reel on the highest ranked hotel in the Baltics for Visit Estonia got 250,997 views against her usual 118,484. A tourism board buys the same restaurant and hotel posts she makes anyway.
Chili Ta, 376,397 followers
@chili_tathuy writes scripts and sometimes cooks, as her Czech bio says. Her 12 paid posts include Haier, Hellmann's, the sauce maker Živina, the furniture shop Bonami and the bank Česká spořitelna. The median one got 1.12x her usual engagement. Her best was a sketch about "strategic incompetence", pretending not to know a chore so you never have to do it, with a Haier hot drink machine as the answer. It got 962,222 views against her usual 192,691. The caption tells the joke first and names the product after it.
Grazi Dallagnelo, 714,464 followers
@grazieats travels "just to eat", as her Portuguese bio says. She posted 16 sponsored posts, for McDonald's Brasil, Subway, Burger King, Lojas G and others. Her median sponsored post got 1.31x her usual likes and comments and 1.35x her usual reel views. A McDonald's reel on its new burger got 1,008,797 views, against her usual 297,696. Her normal posts are food reviews too, so the sponsored ones look like the rest of her feed.
Amelia Dimoldenberg, 2,995,597 followers
@ameliadimz is the host of Chicken Shop Date. 24 of her 74 posts in the year carried #ad, and 20 of them promote Passenger Princess, a series made "in paid partnership" with Formula 1 in which she rides with F1 drivers. Her median sponsored post got 1.33x her usual engagement and 1.48x her usual 3.16 million views. The episode trailer with Charles Leclerc got 32.7 million views. F1 paid for a show, and the show is her content.
The five have the same pattern. The brand paid for the creator's normal format: a renovation episode, a trip, a sketch, a food review, a drive with a celebrity. Our sponsored post study found the same with smaller creators.
How to pick a macro influencer
- Search with the follower band, the platform, the country and the account type set to creators, so brands and media pages drop out.
- Open each profile and read the median views of the last 10 reels that are not pinned. Compare it with this page's band median, such as 99,676 for 250K to 500K.
- Divide the median likes and comments by followers. On Instagram the band medians run from 0.93% to 1.04% between 100K and 1M.
- Look at the creator's past sponsored posts next to the normal ones. A creator whose ads keep their usual numbers, like the five above, is worth more than one whose ads drop to half.
- Ask for the audience country split, because a big account can have most of its followers outside your market.
- Plan for about 0.5x to 0.7x of the usual likes and comments on your post, and about 0.8x of the usual views.
If a big creator is not a fit, how to find influencers tests five ways of building a list. For what large creators earn from these deals, see how much influencers make, and for the follower count where deals start, how many followers you need to get sponsored.
How we measured, and what can be wrong
- The accounts are public Instagram accounts with 10,000+ followers that Virev's crawler read between August 3 and October 1, 2026, with at least 6 measurable posts and 4 normal posts in the year before the read.
- We counted feed posts and reels that were not pinned, had likes visible and were at least 3 days old at the read.
- Each account sits in the band of its follower count at the read, so a creator near a band edge can be in the next band a month later.
- Virev's profile reader labels each account from its bio and posts, and for accounts it has not read we used Instagram's own category.
- We counted a person as a celebrity or public figure when Virev's role or Instagram's category says actor, musician, singer, athlete, politician, TV host or film director.
- The per-band tables use labelled creators only, and about half of the big accounts have no label of either kind, so they are left out of those tables.
- The engagement rate is the median likes plus comments (plus shares on TikTok) of the account's normal posts divided by followers, and reel views are the median plays of its normal reels.
- The Instagram posting rate comes from the dates of the 12 newest posts, and the TikTok rate from the full span of stored videos.
- A post counts as sponsored when it has Instagram's paid partnership label or a caption tag such as #ad, #sponsored or a local ad tag, and a hand check of 100 caption-detected posts in our sponsored post study found 86 correct.
- Ads with no marker count as normal posts, which makes the sponsored drop look a little smaller than it is.
- In the draws each creator counts once, with the median views of their sponsored reels, and we left out reels with more than 5x the creator's usual views because the brand likely ran them as ads.
- The index counts are live totals from Virev search on October 24, 2026, and they include every account type, measured or not.
- Niche and country come from Virev's profile reader, which covers a minority of accounts, and the crawl leans toward accounts brands search for.
- This is an observational study, so it shows what large accounts get and not what causes it.
Download the data
All tables are in one CSV: macro-influencers-2026.csv. It has the index counts by platform and band, the account type shares under both labels, the per-band metrics for Instagram creators, celebrities, brands and media pages and for TikTok, the sponsored reel table, the group draws, and the niche and country rows. Please cite "Virev, October 2026" and link this page.
Find macro creators on Virev
Virev creator search covers 180M+ creators on Instagram, TikTok and YouTube. Set the follower range to 100,000 to 1 million, keep the account type on creators, add a country and the words a creator would put in a bio, and sort the results by engagement. Try food creators with 100K to 1M followers or mega creators on TikTok to start.
Sources
- What is a macro influencer?
- What is a Macro-Influencer? What You Need to Know
- What Is a Macro Influencer? Guide to Macro Influencers
- Macro Influencer: What They Are and When Brands Should Use Them
- Mega Influencers Explained: 2026 Guide
- List of Mega-Influencers in The Creator Marketplace
- Passenger Princess with Charles Leclerc
- Strategická inkompetence
- The highest ranked hotel in the Baltics