



This page collects every number from Virev's creator studies of 2026 in one place. Each line gives the number, the sample, the dates and a link to the section of the study it comes from. Most of it is measured from public posts. Virev's crawler reads public Instagram, TikTok and YouTube accounts with 1,000 or more followers, and the largest study covers 35.3 million posts from 651,116 accounts. The platform pay numbers come from payouts creators showed in public, and prices from published rate tables. Ten of the 112 numbers are new and appear here first.
The pages that rank for "influencer marketing statistics" quote surveys of marketers and market-size forecasts: 49% of respondents expect bigger budgets, 86% of consumers buy something after an influencer post, the industry will reach $40 billion. Those are opinions and estimates. None of them measures what posts get. The numbers below do, mostly by comparing each post with the same creator's other posts, so a big account and a small one are judged on the same scale.
0.69x
Sponsored post
1 in 112
Posts that are ads
$43 vs $4.14
Per 1,000 views
The headline number from each study
| Study | Headline | Sample |
|---|---|---|
| Sponsored posts | 0.69x the usual engagement | 175,104 posts |
| Instagram engagement | 1.89% median rate | 431,494 accounts |
| TikTok engagement | 5.70%, or 8.3 per 100 views | 274,473 accounts |
| Influencer rates | $43 per 1,000 views | 31,663 creators |
| Influencer income | $3,900 a year, median | 49,185 creators |
| Micro and nano | 100 nano: 969K views | 391,731 creators |
| YouTube pay | $4.14 per 1,000 views | 92 YouTubers |
| TikTok pay | $0.40 per 1,000 views | 115 creators |
| Best time, Instagram | Sunday nights, +5.5% | 2.6M posts |
| Best time, TikTok | 6 to 9 AM, +3.7% | 3.5M videos |
| Best time, YouTube | Weekends, +7% | 173,516 videos |
| Hashtags | +4% Instagram, +10% TikTok | 35.3M posts |
New numbers in this roundup
These ten numbers are computed for this page from the post export behind our hashtag study: 20,032,441 Instagram posts from 390,061 accounts and 15,522,802 TikTok videos from 262,494 accounts, posted September 1, 2025 to September 29, 2026. Brands, media and businesses are removed, and each account has at least six posts. A post counts as sponsored if Instagram shows the paid partnership label or the caption carries an ad tag such as #ad, #sponsored or #광고; giveaways and TikTok LIVE incentive tags are left out.
Sponsored posts are rare, and rarer on TikTok
- 0.89% of Instagram creator posts carry a sponsored disclosure, about 1 in 112; on TikTok it is 0.29% of videos, about 1 in 348. (390,061 Instagram and 262,494 TikTok accounts)
- The share of accounts with at least one sponsored post rises with size: on Instagram from 3.9% of nano accounts to 21.8% of accounts with 1M+ followers; on TikTok from 1.5% to 14.7%. (390,061 Instagram and 262,494 TikTok accounts)
- Across all accounts with 1,000+ followers, 9.8% of Instagram accounts and 4.7% of TikTok accounts posted a sponsored post in 13 months. (390,061 Instagram and 262,494 TikTok accounts)
- 63% of sponsored Instagram posts use Instagram's paid partnership label; the other 37% disclose only with a caption tag such as #ad. (178,509 sponsored posts)
- Sponsored posts peak in November and dip in January: 1.01% of Instagram posts in November 2025 against 0.74% in January 2026, and 0.38% against 0.24% on TikTok. (20.0M Instagram posts, 15.5M TikTok videos)
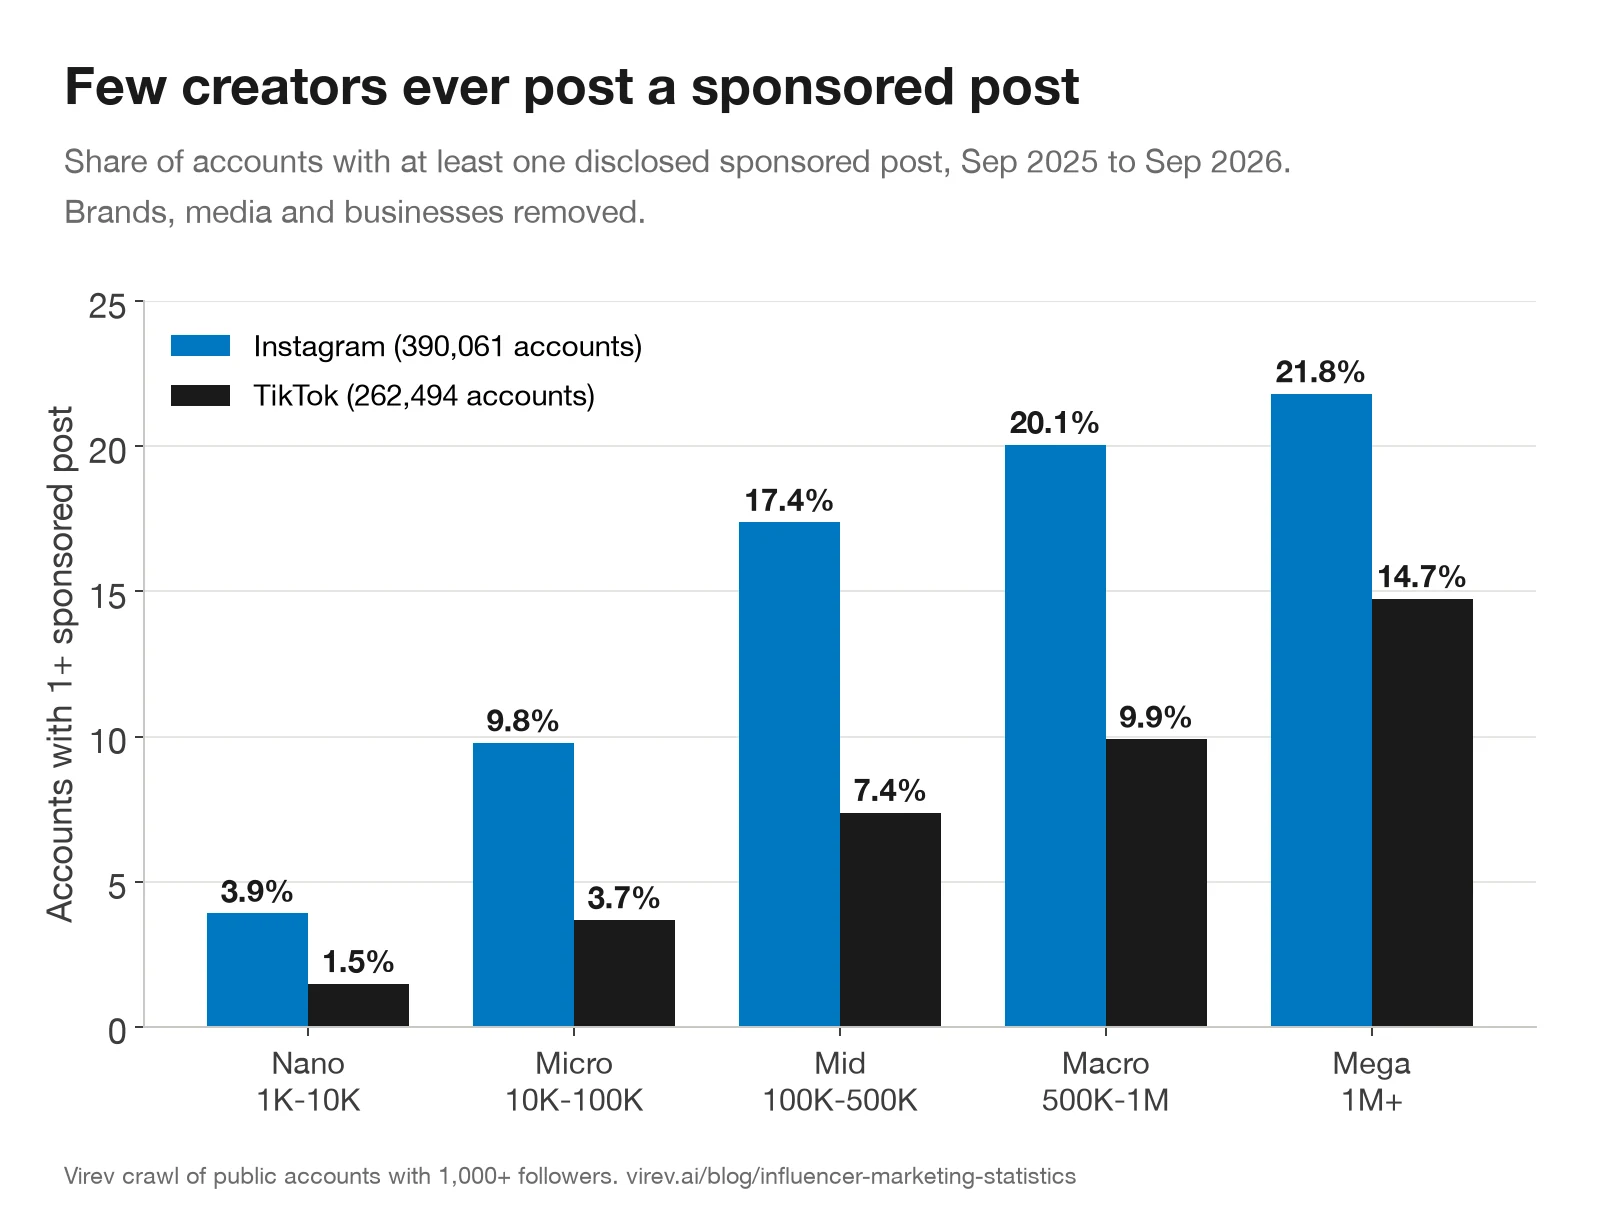
The 9.8% here counts every account that is not a brand, including the many our profile model has not labelled. Our income study, which keeps only accounts labelled as individual creators, puts it at 16.7%. Both say the same thing: most creators with an audience never post a disclosed ad in a year.
Formats and reactions
- Reels are 54% of Instagram creator posts, carousels 27% and single images 20%. Among 80,566 creators who posted in both periods, the reel share rose from 45% (Sep to Nov 2025) to 48% (Jun to Aug 2026). (20.0M Instagram posts)
- A TikTok view brings about twice the likes of an Instagram Reel view: 7.3 likes per 100 views against 3.3, for the median account.
- Instagram creators get 2.6 comments per 100 likes; TikTok creators get 1.6 comments and 5.5 shares per 100 likes.
- The median Instagram creator posts every 2 days, the median TikTok creator every day.
What a view costs a brand, and pays a creator
- At published rates a YouTube sponsored video costs a brand $144 per 1,000 views, about 35 times the $4.14 YouTube pays creators from ads; a TikTok sponsored video costs $72, 180 times Creator Rewards' $0.40 (medians from the rates, YouTube pay and TikTok pay studies).
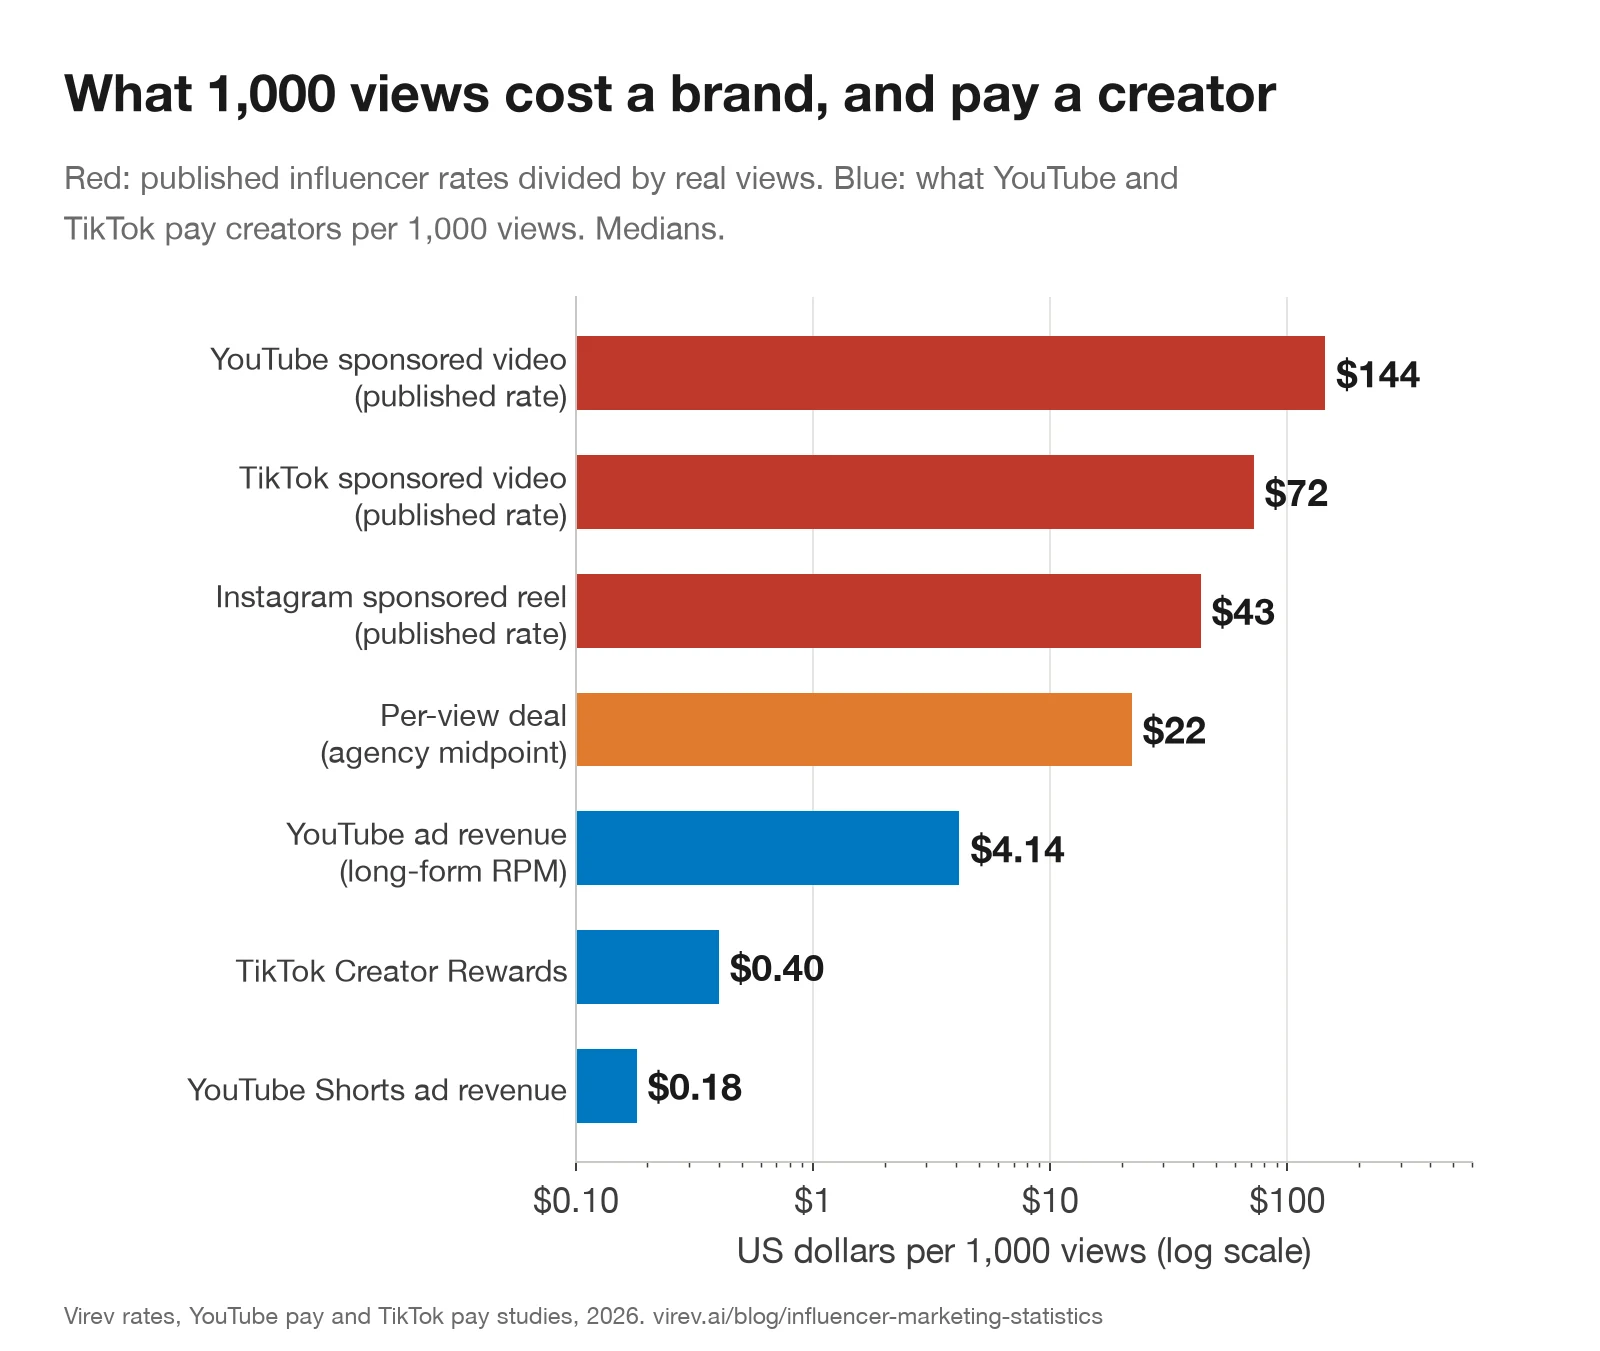
A creator's views are worth far more to a brand than to the platform that shows them. That is why the TikTok pay study finds that TikTok creators with deals earn more from them than from Creator Rewards, and why the brand side should price on views, not followers.
Sponsored post statistics
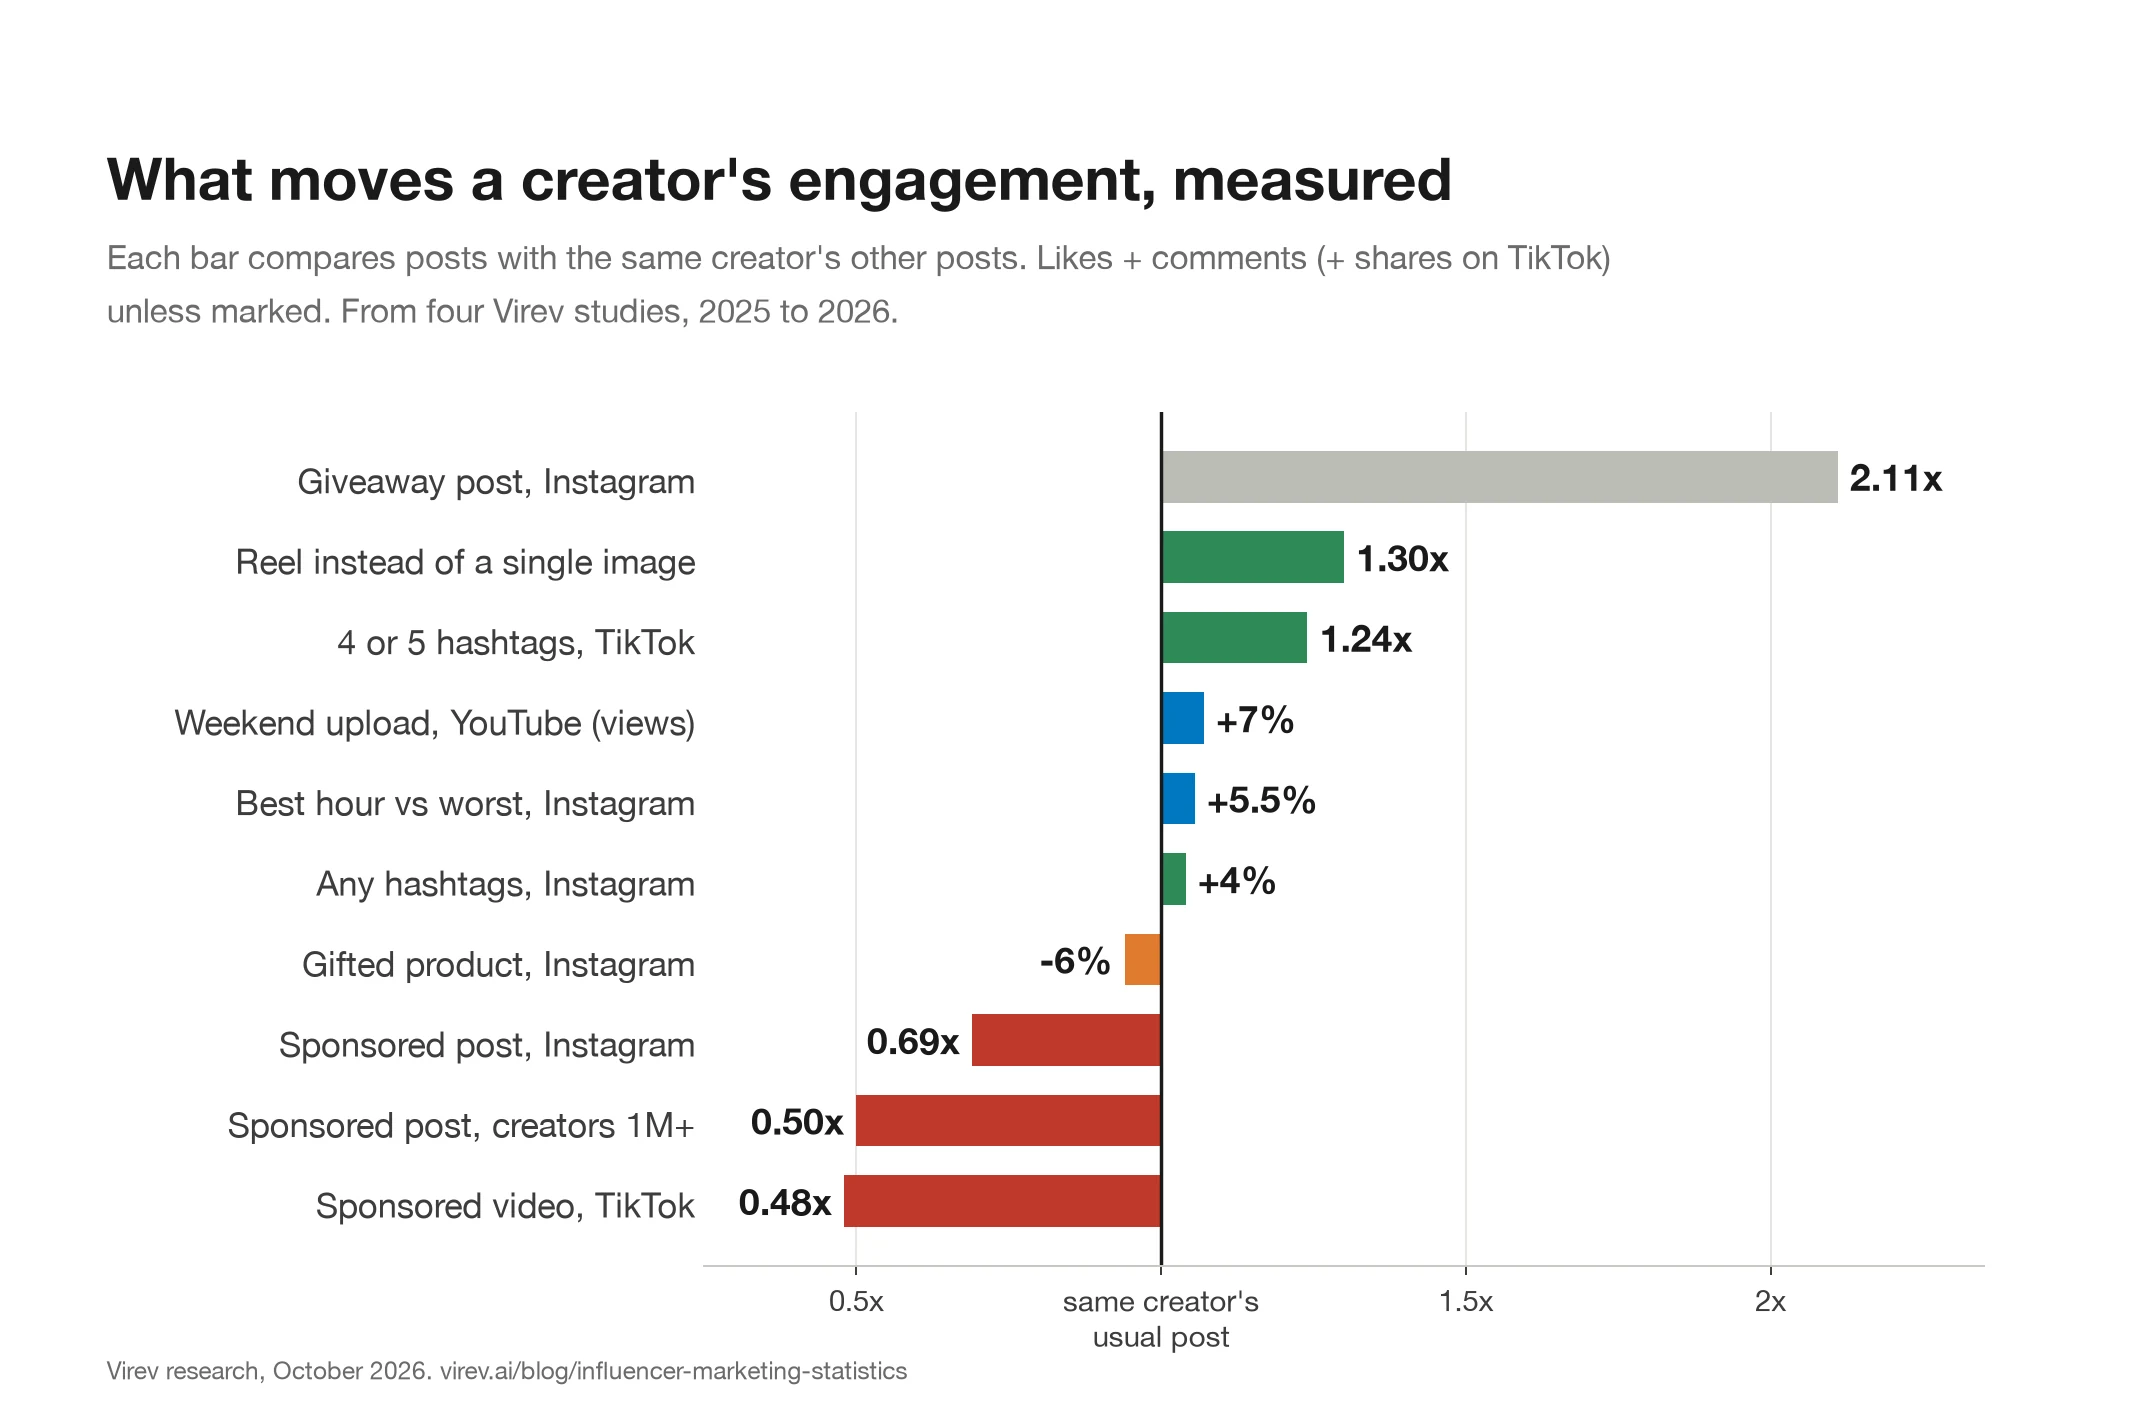
- A sponsored Instagram post gets 0.69x the likes and comments of the same creator's usual post. (175,104 sponsored posts, 38,176 creators, Aug 2025 to Sep 2026, Sponsored post study)
- Two out of three sponsored Instagram posts did worse than the creator's median normal post. (175,104 sponsored posts, Aug 2025 to Sep 2026, Sponsored post study)
- Posts that carry both Instagram's paid partnership label and #ad get 0.61x the creator's usual engagement; the paid label alone gets 0.67x. (38,387 and 73,414 posts, Aug 2025 to Sep 2026, Sponsored post study)
- Gifted-product posts with no ad tag get 0.94x the usual engagement, and discount code or affiliate posts 0.86x. (30,466 gifted and 55,521 affiliate posts, Aug 2025 to Sep 2026, Sponsored post study)
- Giveaway posts get 2.11x the usual engagement, mostly because entry rules ask for comments and tags. (64,351 giveaway posts, Aug 2025 to Sep 2026, Sponsored post study)
- The sponsored drop grows with size: nano creators keep 0.91x of their usual engagement, creators with 1M+ followers 0.50x. (19,488 nano and 16,889 mega sponsored posts, Aug 2025 to Sep 2026, Sponsored post study)
- Sponsored reels keep 0.85x of the creator's usual views, so people still watch and react less. (144,669 sponsored reels, Aug 2025 to Sep 2026, Sponsored post study)
- Collab posts with the brand as co-author get 0.79x the usual engagement, against 0.64x for creator-only sponsored posts. (57,042 collab and 118,062 creator-only posts, Aug 2025 to Sep 2026, Sponsored post study)
- Parenting (0.86x) and beauty (0.81x) creators lose least on sponsored posts; comedy (0.50x) and pets (0.55x) lose most. (sponsored posts with a known category, Aug 2025 to Sep 2026, Sponsored post study)
- No country reaches 1.0x on sponsored posts: the United Kingdom is at 0.82x, the United States 0.77x and Japan 0.67x. (155 to 1,601 creators per country, Aug 2025 to Sep 2026, Sponsored post study)
- A sponsored TikTok video gets 0.48x the likes, comments and shares of the same creator's usual video, and 72% do worse than usual. (32,934 sponsored videos, 10,379 creators, Aug 2025 to Sep 2026, Sponsored post study)
- A sponsored reel gets 0.89x the views of the creator's normal reels on Instagram; a sponsored TikTok video gets 0.75x. (31,663 Instagram and 9,163 TikTok creators, Aug 2025 to Sep 2026, Influencer rates study)
Engagement rate statistics
Instagram engagement statistics
- The median Instagram engagement rate is 1.89% for public accounts with 1,000 or more followers. (431,494 Instagram accounts, read Jul to Oct 2026, Instagram engagement benchmarks)
- The median Instagram engagement rate falls from 2.99% at 1K to 10K followers to 0.77% above 1 million. (431,494 Instagram accounts, read Jul to Oct 2026, Instagram engagement benchmarks)
- At 10K to 50K followers, the middle half of Instagram accounts runs from 0.59% to 5.21%, a factor of nine. (126,791 Instagram accounts, read Jul to Oct 2026, Instagram engagement benchmarks)
- Individual creators earn 2.4 times the Instagram engagement rate of brand accounts at 1K to 10K followers, and 5 times above 1 million. (53,934 creators, 37,728 brand accounts, read Jul to Oct 2026, Instagram engagement benchmarks)
- An Instagram engagement rate built from the median post is 53% to 64% of the rate built from the average post, in every follower tier. (431,494 Instagram accounts, read Jul to Oct 2026, Instagram engagement benchmarks)
- Among Instagram creators with 10K to 100K followers, dance creators lead at 4.3% and health and wellness creators trail at 1.3%. (creators with 10K to 100K followers, 19 categories, read Jul to Oct 2026, Instagram engagement benchmarks)
- A typical Instagram Reel gets about 3 likes per 100 views, from 3.1 at 1K to 10K followers to 3.6 above 1 million. (315,582 accounts with 3+ Reels, read Jul to Oct 2026, Instagram engagement benchmarks)
- The median Instagram account with 1K to 10K followers gets 107 Reel views per 100 followers; above 1 million it gets 20. (315,582 accounts with 3+ Reels, read Jul to Oct 2026, Instagram engagement benchmarks)
- Once you count per view, the tier gap closes: 3.3% of people who watch a nano creator's reel like or comment, and 3.4% for creators with 1M+ followers. (391,731 Instagram creators, Aug 2025 to Sep 2026, Micro and nano study)
TikTok engagement statistics
- The median TikTok engagement rate is 5.70% by followers, and 8.3 likes, comments and shares per 100 views. (274,473 TikTok accounts, 3.2M videos, read Aug to Oct 2026, TikTok engagement benchmarks)
- The median TikTok engagement rate by followers falls from 18.30% at 1K to 10K followers to 1.04% above 1 million. (274,473 TikTok accounts, read Aug to Oct 2026, TikTok engagement benchmarks)
- Per 100 views, TikTok engagement stays near 8 at every size: 9.0 at 1K to 10K followers and 9.1 above 1 million. (274,473 TikTok accounts, read Aug to Oct 2026, TikTok engagement benchmarks)
- A typical TikTok video reaches 61 views per 100 followers at 1K to 10K followers, and 6 above 1 million. (274,473 TikTok accounts, read Aug to Oct 2026, TikTok engagement benchmarks)
- In the median TikTok account, the most-viewed of 12 recent videos holds 31% to 40% of all their views. (274,473 TikTok accounts, read Aug to Oct 2026, TikTok engagement benchmarks)
- TikTok shares outnumber comments about 2 to 1 for small accounts and 3 to 1 above 1 million followers. (274,473 TikTok accounts, read Aug to Oct 2026, TikTok engagement benchmarks)
- Per view, a brand video on TikTok earns 40% to 72% of the engagement a creator video earns. (66,670 creators, 8,080 brand accounts, read Aug to Oct 2026, TikTok engagement benchmarks)
Check a single account against these medians with the Instagram engagement rate calculator or the TikTok engagement rate calculator.
Influencer pricing and income statistics
Influencer rates
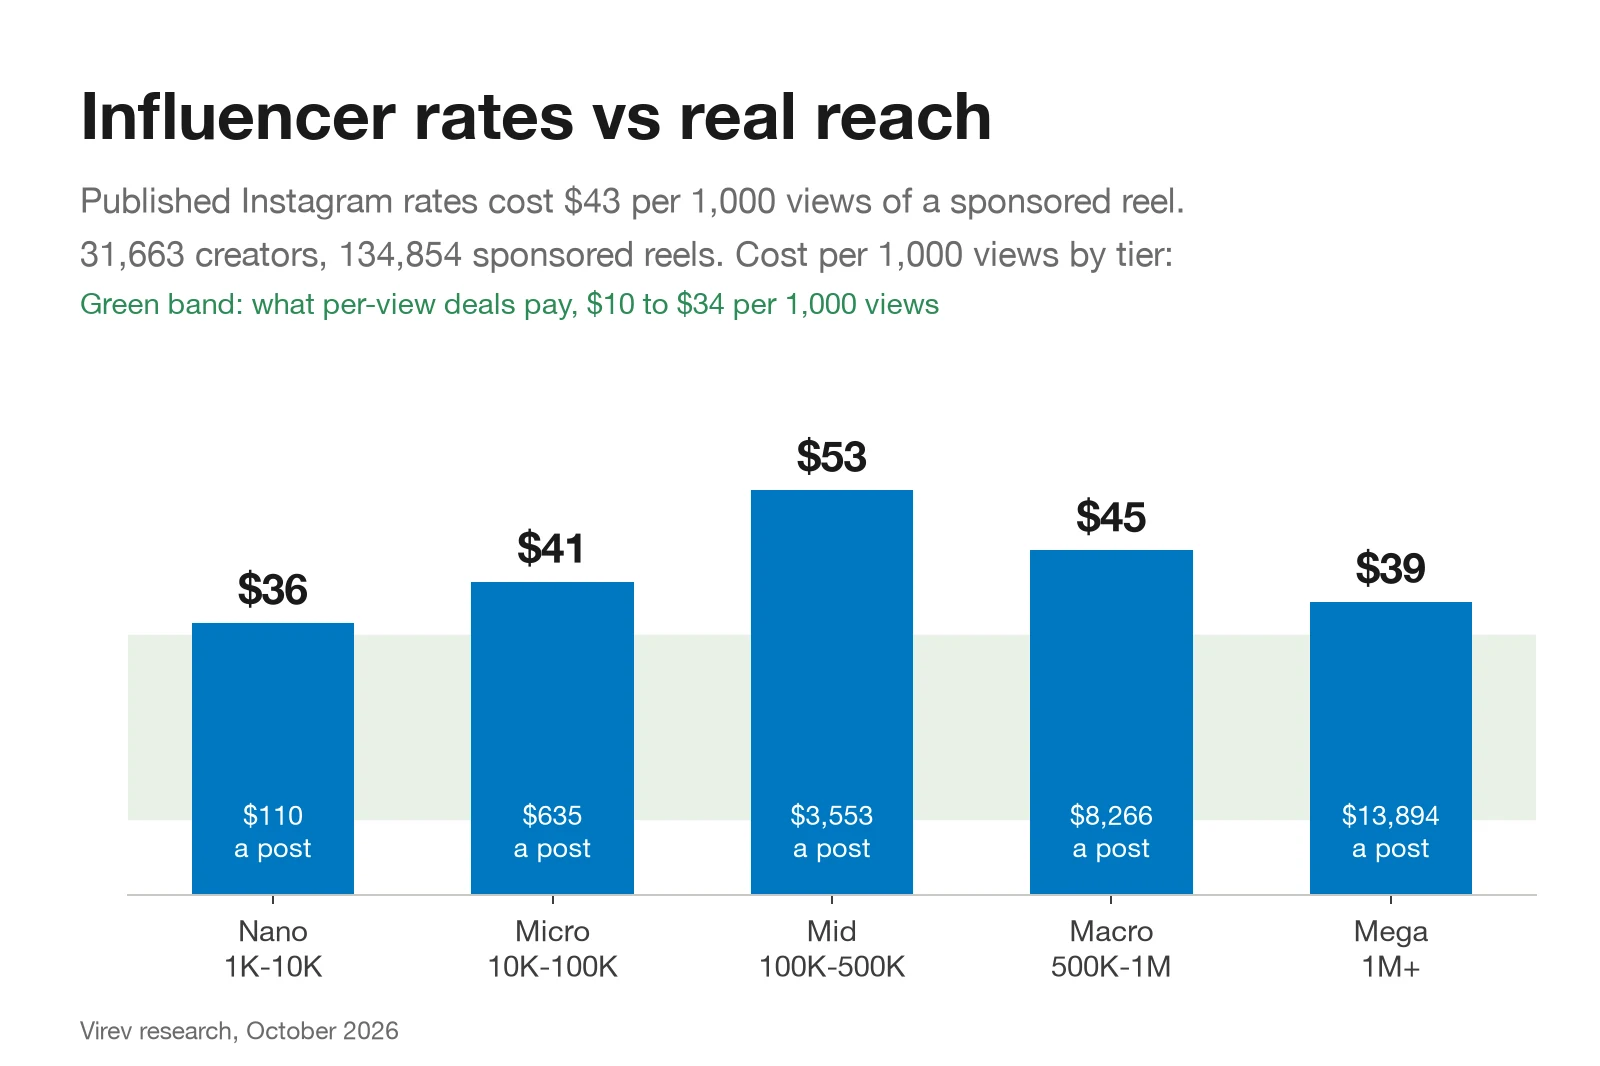
- Published influencer rates cost a median $43 per 1,000 views of a sponsored Instagram reel. (31,663 Instagram creators, 134,854 sponsored reels, Aug 2025 to Sep 2026, Influencer rates study)
- On TikTok the same published-rate math gives $72 per 1,000 views; on YouTube, $144 per 1,000 views of a channel's usual video. (9,163 TikTok creators; 9,546 YouTube channels, Aug 2025 to Sep 2026, Influencer rates study)
- Published price tables put a 1K to 10K Instagram creator at $37 to $191 a post and a 1M+ creator at $10,000 to $42,011. (56 published Instagram price ranges, 2025 to 2026, Influencer rates study)
- Follower-based price tables cost 1.96x what the same views earn in per-view deals at $22 per 1,000. (31,663 Instagram creators, 134,854 sponsored reels, Aug 2025 to Sep 2026, Influencer rates study)
- Inside one follower tier at one table price, the cheaper quarter of creators gives 5 to 7 times more views per dollar than the dearer quarter. (31,663 Instagram creators, 134,854 sponsored reels, Aug 2025 to Sep 2026, Influencer rates study)
- At the global table, a sponsored reel costs $71 per 1,000 views from a US creator and $16 from an Indian creator, whose reels reach 104% of followers. (1,457 US and 927 Indian creators, Aug 2025 to Sep 2026, Influencer rates study)
Influencer income
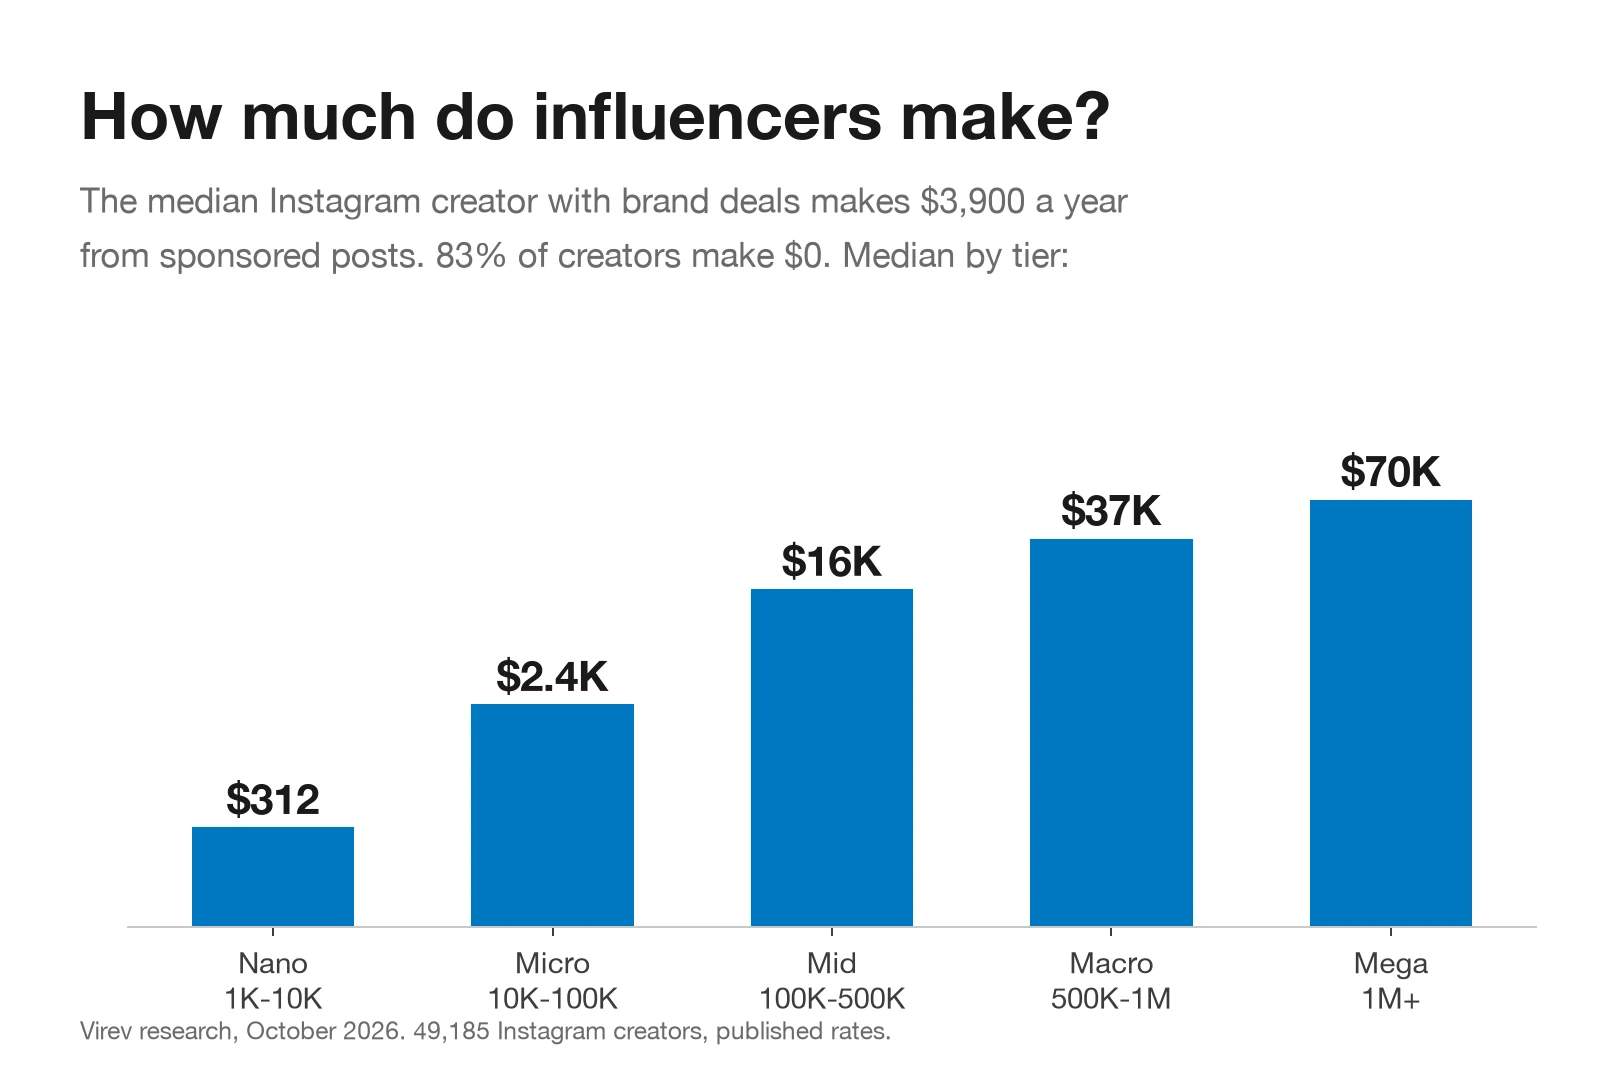
- The median Instagram creator with at least one brand deal earns about $3,900 a year from sponsored posts at published rates. (8,201 creators with deals, of 49,185, Aug 2025 to Sep 2026, Influencer income study)
- 83% of Instagram creators posted no disclosed sponsored content in about a year; on TikTok, 95%. (49,185 Instagram and 46,620 TikTok creators, Aug 2025 to Sep 2026, Influencer income study)
- The top 1% of Instagram creators with deals start at $253,000 a year from sponsored posts. (8,201 creators with deals, Aug 2025 to Sep 2026, Influencer income study)
- Creators of every size publish about the same number of sponsored posts, a median of 3 to 5 a year. (8,201 creators with deals, Aug 2025 to Sep 2026, Influencer income study)
- 79% of Instagram creators with 10,000 to 100,000 followers had no sponsored post in the period read. (17,961 micro creators, Aug 2025 to Sep 2026, Influencer income study)
- Food, parenting, home and fashion creators get deals most often (29% to 39% of them); musicians and artists least (4% and 5%). (49,185 Instagram creators, Aug 2025 to Sep 2026, Influencer income study)
- The top 1% of Instagram creators take 54% of all estimated sponsorship money. (49,185 Instagram creators, Aug 2025 to Sep 2026, Influencer income study)
Micro and nano influencers
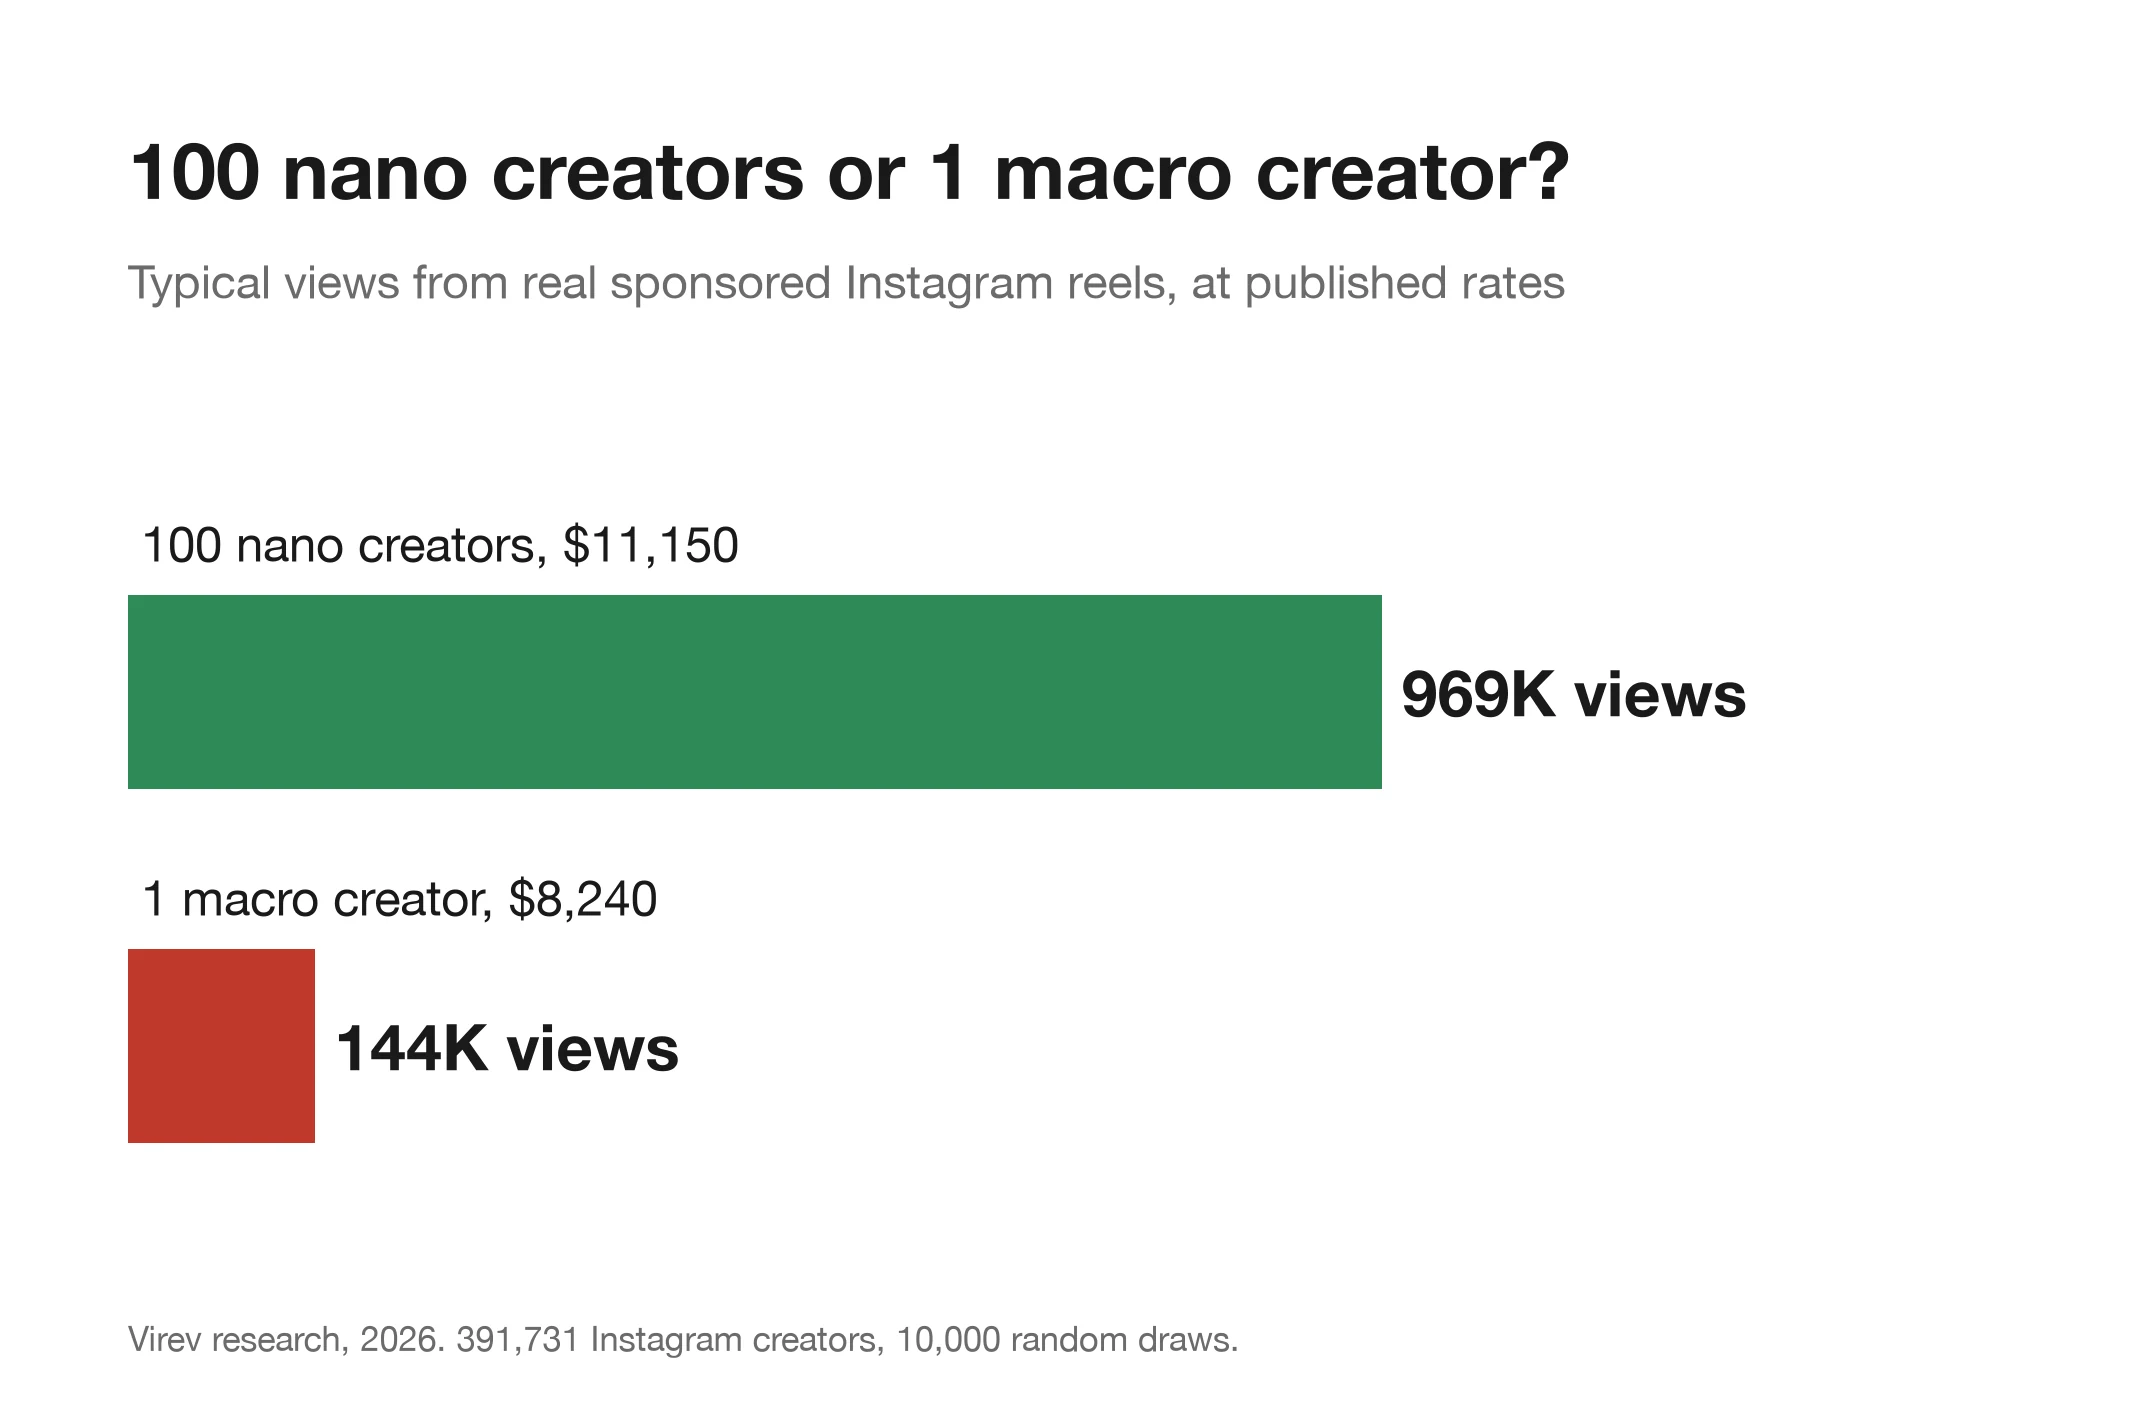
- 100 nano creators at published rates got a typical 969,000 views for $11,150; one macro creator got 144,000 views for $8,240. (131,664 sponsored reels, 10,000 simulated campaigns, Aug 2025 to Sep 2026, Micro and nano study)
- The 100 nano creators got more views than the one macro creator in 91% of the 10,000 random draws. (10,000 simulated campaigns, Aug 2025 to Sep 2026, Micro and nano study)
- A nano creator's usual reel gets views equal to 65% of followers; a creator with 1M+ followers, 15%. (391,731 Instagram creators, Aug 2025 to Sep 2026, Micro and nano study)
- Only 3.9% of nano Instagram creators posted any sponsored content in 13 months. (140,464 nano creators, Aug 2025 to Sep 2026, Micro and nano study)
- Nano creators are cheaper per view than larger creators in 15 of 17 niches; the gap is largest in sports, at 3.7x. (creators with a known niche, Aug 2025 to Sep 2026, Micro and nano study)
The Instagram money calculator applies the same published rates and view ratios to one handle.
YouTube and TikTok pay statistics
YouTube pay statistics
- YouTube pays a median $4.14 per 1,000 long-form views, from 73 creators who showed their AdSense numbers. (73 creators, 226 figures from 92 YouTubers, 2017 to 2026, YouTube pay study)
- YouTube Shorts paid a median $0.18 per 1,000 views since 2024. (15 creators, 2024 to 2026, YouTube pay study)
- For the same creator, a long-form YouTube view earns 36 times a Shorts view, in figures from 2024 on. (9 creators who disclosed both, 2024 to 2026, YouTube pay study)
- Finance YouTubers got a median $12.55 per 1,000 views, about four times entertainment, lifestyle and education channels at a little above $3. (226 disclosed figures, 2017 to 2026, YouTube pay study)
- On the same channel, YouTube videos of 8 minutes or more paid 2.3 to 3.5 times what shorter ones paid per view. (creators who disclosed both lengths, 2017 to 2026, YouTube pay study)
TikTok pay statistics
- TikTok's Creator Rewards and Creativity Program paid a median $0.40 per 1,000 views. (115 creators, 135 figures, Apr 2023 to Sep 2026, TikTok pay study)
- A median 45% of a TikTok video's views qualify for pay, and creators get $0.65 per 1,000 qualified views. (16 creators (share qualified), 77 creators (rate), 2023 to 2026, TikTok pay study)
- TikTok creators with mostly US, UK, Japanese or Korean viewers got $0.42 per 1,000 views; those with viewers mostly outside the program countries got $0.05. (22 and 9 creators, 2023 to 2026, TikTok pay study)
- 63% of TikTok videos with 10 million+ views in the eight program countries since April 2026 were 60 seconds or shorter, so they earned nothing from Creator Rewards. (2,092 videos with 10M+ views, Apr to Sep 2026, TikTok pay study)
- In the eight Creator Rewards countries, 36% of creator videos ran over one minute in Q3 2026, against 22% elsewhere and about 11% in 2022. (creators with 10,000+ followers, 2022 to Q3 2026, TikTok pay study)
- Creator Rewards pays about 18 times what TikTok's old Creator Fund paid ($0.02 per 1,000 views, 2020 to 2023). (20 Creator Fund creators, 115 current-program creators, 2020 to 2026, TikTok pay study)
The YouTube money calculator and TikTok money calculator use these medians.
Best time to post statistics
Best time to post on Instagram
- On Instagram, the best 3-hour window (midnight to 3 AM local time) beats the worst (9 AM to noon) by 5.5% for the same creator. (46,839 Instagram creators, 2.6M posts, Aug 2025 to Sep 2026, Best time to post on Instagram)
- Sunday is the best Instagram day for all five follower tiers and 12 of 13 creator categories. (46,839 Instagram creators, 2.6M posts, Aug 2025 to Sep 2026, Best time to post on Instagram)
- Creators post less on weekends: 12% of Instagram posts go out on Saturday and 13% on Sunday, against 15% on each weekday. (46,839 Instagram creators, 2.6M posts, Aug 2025 to Sep 2026, Best time to post on Instagram)
- Instagram creators with over a million followers get 15% more from a midnight post than a midday post; for creators under 10,000 the best-to-worst gap is 4%. (46,839 Instagram creators, 2.6M posts, Aug 2025 to Sep 2026, Best time to post on Instagram)
- A reel gets 30% more likes and comments than a single image from the same Instagram creator, about five times the best-hour effect. (46,839 Instagram creators, 2.6M posts, Aug 2025 to Sep 2026, Best time to post on Instagram)
- A post that goes up less than 3 hours after the creator's previous one gets 4.4% under average on Instagram and 6.5% under on TikTok. (46,839 Instagram and 53,318 TikTok creators, Aug 2025 to Sep 2026, Best time to post on Instagram)
Best time to post on TikTok
- TikTok videos posted 6 to 9 AM local time get 3.0% more engagement and 1.6% more views than the same creator's average video. (53,316 creators, 3.5M videos, Aug 2025 to Sep 2026, Best time to post on TikTok)
- On TikTok the best window (6 to 9 AM) beats the worst (9 PM to midnight) by 3.7% for engagement and 2.8% for views. (53,316 creators, 3.5M videos, Aug 2025 to Sep 2026, Best time to post on TikTok)
- A TikTok video gets 60% of its day-6 views in its first 24 hours. (40,481 videos read twice or more, Aug to Sep 2026, Best time to post on TikTok)
- 12% of TikTok videos go up less than an hour after the creator's previous video, and those get 8.1% less engagement and 7.1% fewer views. (53,316 creators, 3.5M videos, Aug 2025 to Sep 2026, Best time to post on TikTok)
Best time to post on YouTube
- YouTube videos uploaded on Saturday or Sunday get 7.0% more views than the same channel's Tuesday to Thursday uploads. (6,212 channels, 173,516 long-form videos, Jun 2025 to Sep 2026, Best time to post on YouTube)
- On YouTube, the best common 3-hour upload window beats the worst by 3.4% in views. (6,212 channels, 173,516 long-form videos, Jun 2025 to Sep 2026, Best time to post on YouTube)
- Pooled across channels, Sunday YouTube videos get 56% more views per subscriber than Wednesday videos; within the same channel the gap is 7.4%. (6,212 channels, 173,516 long-form videos, Jun 2025 to Sep 2026, Best time to post on YouTube)
- A YouTube video uploaded less than an hour after the channel's previous upload gets 12% fewer views. (6,212 channels, 173,516 long-form videos, Jun 2025 to Sep 2026, Best time to post on YouTube)
- Within the same YouTube channel, a 30 to 60 minute video gets 12% more views than average and a 1 to 4 minute video 23% fewer. (6,212 channels, 173,516 long-form videos, Jun 2025 to Sep 2026, Best time to post on YouTube)
Hashtag statistics
- An Instagram post with hashtags gets 1.04x the likes and comments of the same account's posts without them; on TikTok, 1.10x. (35.3M posts, 651,116 accounts, Aug 2025 to Sep 2026, Hashtag study)
- Four or five hashtags scored best: 1.08x on Instagram and 1.24x on TikTok. (35.3M posts, 651,116 accounts, Aug 2025 to Sep 2026, Hashtag study)
- Instagram posts with six or more hashtags fell from 24.7% in October 2025 to 2.7% in August 2026, after the five-tag limit. (19.8M Instagram posts, Aug 2025 to Sep 2026, Hashtag study)
- The average Instagram post went from 3.7 hashtags to 2.1. (19.8M Instagram posts, Aug 2025 to Sep 2026, Hashtag study)
- #fyp and #viral score 1.01x on TikTok, against the same account's videos with the same number of tags and no generic tag. (15.5M TikTok videos, Aug 2025 to Sep 2026, Hashtag study)
- 31% of tagged TikTok videos carry #fyp, #foryou, #foryoupage or a variant. (15.5M TikTok videos, Aug 2025 to Sep 2026, Hashtag study)
- Accounts with a million followers do 7% worse with hashtags on both apps; nano and micro accounts do 5% to 14% better. (35.3M posts, 651,116 accounts, Aug 2025 to Sep 2026, Hashtag study)
- 28% of Instagram accounts and 16% of TikTok accounts used no hashtags on at least 90% of their posts. (35.3M posts, 651,116 accounts, Aug 2025 to Sep 2026, Hashtag study)
South Korea and Japan statistics
The Korean and Japanese studies are written in Korean and Japanese and use creators who write captions in that language or list that country.
South Korea
- Korean-language Instagram creators have a median engagement rate of 4.2% at 1K to 10K followers, 2.7% at 10K to 100K and 1.1% at 100K to 500K. (2,965 Korean creators, 139,890 posts, Mar to Sep 2026, Korea influencer marketing data (KO))
- 48% of Korean creators posted at least one ad or sponsored post in seven months. (2,965 Korean creators, 139,890 posts, Mar to Sep 2026, Korea influencer marketing data (KO))
- In Korean beauty, 4 of every 10 creator posts carry an ad or sponsorship disclosure. (2,965 Korean creators, 139,890 posts, Mar to Sep 2026, Korea influencer marketing data (KO))
- 86% of Korean ad and sponsored posts disclose only in the caption; 14% use Instagram's paid partnership label. (2,965 Korean creators, 139,890 posts, Mar to Sep 2026, Korea influencer marketing data (KO))
- Korean #광고 (ad) posts get 69% of the creator's usual engagement; 협찬 (sponsored product) posts get 89%. (2,965 Korean creators, 139,890 posts, Mar to Sep 2026, Korea influencer marketing data (KO))
- 54% of South Korean Instagram creators had a sponsored post, and those publish a median 13 a year, three times the rate elsewhere. (374 South Korean creators, Aug 2025 to Sep 2026, Influencer income study)
- Korean price tables for 10K to 100K Instagram creators (₩300,000 to ₩1.5M a post) come to ₩14 to ₩69 per view. (104 prices from 45 Korean sources; 2,411 Instagram creators, 2026, Korea influencer rates (KO))
- Korean YouTube price tables come to ₩81 to ₩264 per view, more than YouTube video ads at ₩30 to ₩100. (69 Korean YouTube channels, 2026, Korea influencer rates (KO))
- At Korean price tables, a sponsored reel costs $13 per 1,000 views, the cheapest market in the rates study. (644 South Korean creators, Aug 2025 to Sep 2026, Influencer rates study)
- A Korean nano creator's usual reel gets 1.45 times as many views as the account has followers. (3,222 Korean creators, 168,928 posts, Aug 2025 to Sep 2026, Korea micro and nano (KO))
- 21% of Korean nano creators posted an ad in 13 months, against 3.9% in the global sample. (3,222 Korean creators, Aug 2025 to Sep 2026, Korea micro and nano (KO))
- Korean TikTok videos posted 6 to 9 AM get 9.2% more engagement and 5.1% more views than the creator's usual video. (973 Korean creators, 58,319 videos, Aug 2025 to Sep 2026, Korea best time to post (KO))
- Korean Instagram posts on Saturday and Sunday get 5.1% more engagement than weekday posts. (2,798 Korean creators, 166,594 posts, Aug 2025 to Sep 2026, Korea best time to post (KO))
- Korean TikTok videos with hashtags get 1.18x the engagement of the same account's untagged videos; on Instagram, 1.03x. (3,098 Korean accounts, 142,839 posts, Aug 2025 to Sep 2026, Korea hashtag study (KO))
- Korean YouTubers earn a median ₩2,659 per 1,000 long-form views and ₩161 per 1,000 Shorts views. (85 figures from 44 Korean YouTubers, Apr 2021 to Sep 2026, Korea YouTube pay (KO))
- A Korean channel with 100K to 1M subscribers earns a median ₩1.09M a month in ad revenue from new uploads. (539 channels, read Oct 2026, Korea YouTube pay (KO))
Japan
- Japanese posts that say the product was provided get 0.86x the creator's usual engagement; posts with the paid partnership label get 0.64x. (4,400 Japanese creators, 226,150 posts, Aug 2025 to Sep 2026, Japan gifting study (JA))
- Japan has the largest sponsored-post drop of nine countries, at 0.67x the creator's usual engagement. (980 Japanese creators, Aug 2025 to Sep 2026, Japan sponsored post study (JA))
- In Japan, 100 nano creators got a typical 1.89M views from PR reels for about ¥2.02M; one macro creator got 260K views for about ¥1.46M. (2,522 Japanese creators, 7,093 PR posts, Aug 2025 to Sep 2026, Japan micro and nano (JA))
- A Japanese nano creator's usual reel gets views equal to 167% of followers, against 65% in the global sample. (2,522 Japanese creators, Aug 2025 to Sep 2026, Japan micro and nano (JA))
- Japanese TikTok videos posted 6 to 9 AM get 4.3% more engagement and 4.0% more views, yet 46% of Japanese videos go up 6 to 9 PM. (2,526 Japanese creators, 150,385 videos, Aug 2025 to Sep 2026, Japan best time to post (JA))
- Japanese Instagram posts with six or more hashtags fell from 33.3% in October 2025 to 3.7% in August 2026. (3,352 Japanese creators, 166,600 posts, Aug 2025 to Sep 2026, Japan hashtag study (JA))
Three cases behind the numbers
Medians hide people. Three cases from the studies show what the numbers look like for one creator or one brand.
Tom Daley, 15 sponsored posts. The Olympic diving champion (@tomdaley, 4 million followers) posted 15 sponsored posts in the 11 months we read, 12 with Instagram's paid partnership label, for brands such as Rimmel London, Renault and Tesco Mobile. At the $22,700 table price for his size that is $375,000 a year. His sponsored reels got a median 290,000 views, under half his usual 627,000, which is the sponsored drop from the list above in one account. Influencer income study
AllanTheShearer, 155.7 million views and no pay. A UK sheep shearer with 783,000 followers posted a 35-second video on April 20, 2026. Virev's crawler counted 155.7 million views. Because it is under one minute, it could not earn anything from TikTok's Creator Rewards. Since April 2026, 63% of the 10M+ view videos in the program countries were that short. TikTok pay study
BISSELL, $92 per 1,000 views. The vacuum maker ran 21 paid partnership reels with 18 creators from November 2025 to August 2026. At table prices the reels would cost $42,009 and they got 455,020 views, $92 per 1,000, more than twice the Instagram median. 15 of the 18 creators got fewer views on the BISSELL reel than on their usual reel. Influencer rates study
How these numbers were measured, and what can be wrong
- Accounts: public Instagram, TikTok and YouTube accounts with 1,000+ followers or subscribers, read by Virev's crawler between June and October 2026 and exported read-only from our production database. Most studies remove brands, media, businesses and organizations by Virev's profile label or the Instagram category.
- Same-creator comparisons: most effects are a post divided by the same creator's usual post, then the median across creators or posts. This removes account size and content quality from the result. Pooled numbers across accounts, which most published studies use, give much bigger gaps; the YouTube study shows 56% pooled against 7.4% within a channel.
- Sponsored detection: Instagram's paid partnership label, or an ad tag in the caption. TikTok's label is not in our data, so TikTok uses caption tags only. Hand checks found 86 to 95 of 100 caption-detected posts correct. Undisclosed deals are counted as normal posts.
- Prices are published rate tables applied by follower count, not what any creator charged. Income figures are estimates with a wide band; the income study gives $1,400 to $9,800 around the $3,900 median.
- Pay figures come from creators who chose to show their numbers, which may favor channels that earn more.
- Coverage: our crawler finds accounts through other accounts, so it undercounts the smallest creators. Country and category are known for a minority of accounts.
- New numbers: the monthly shares count the posts in our crawl, which holds more recent posts per account than older ones, so months are not sampled equally. The reel trend is measured within the same 80,566 creators for that reason. Posting gaps are in whole days.
Download every statistic
influencer-marketing-statistics-2026.csv has one row per statistic: topic, platform, the plain sentence, the number, sample, period, source study and a link to the section. Each study's own CSV, linked from its "Download the data" section, has the full tables. To find creators by these numbers, such as engagement per view, sponsored history or country, use Virev creator search. To save a post you want to cite, use the Instagram downloader.