



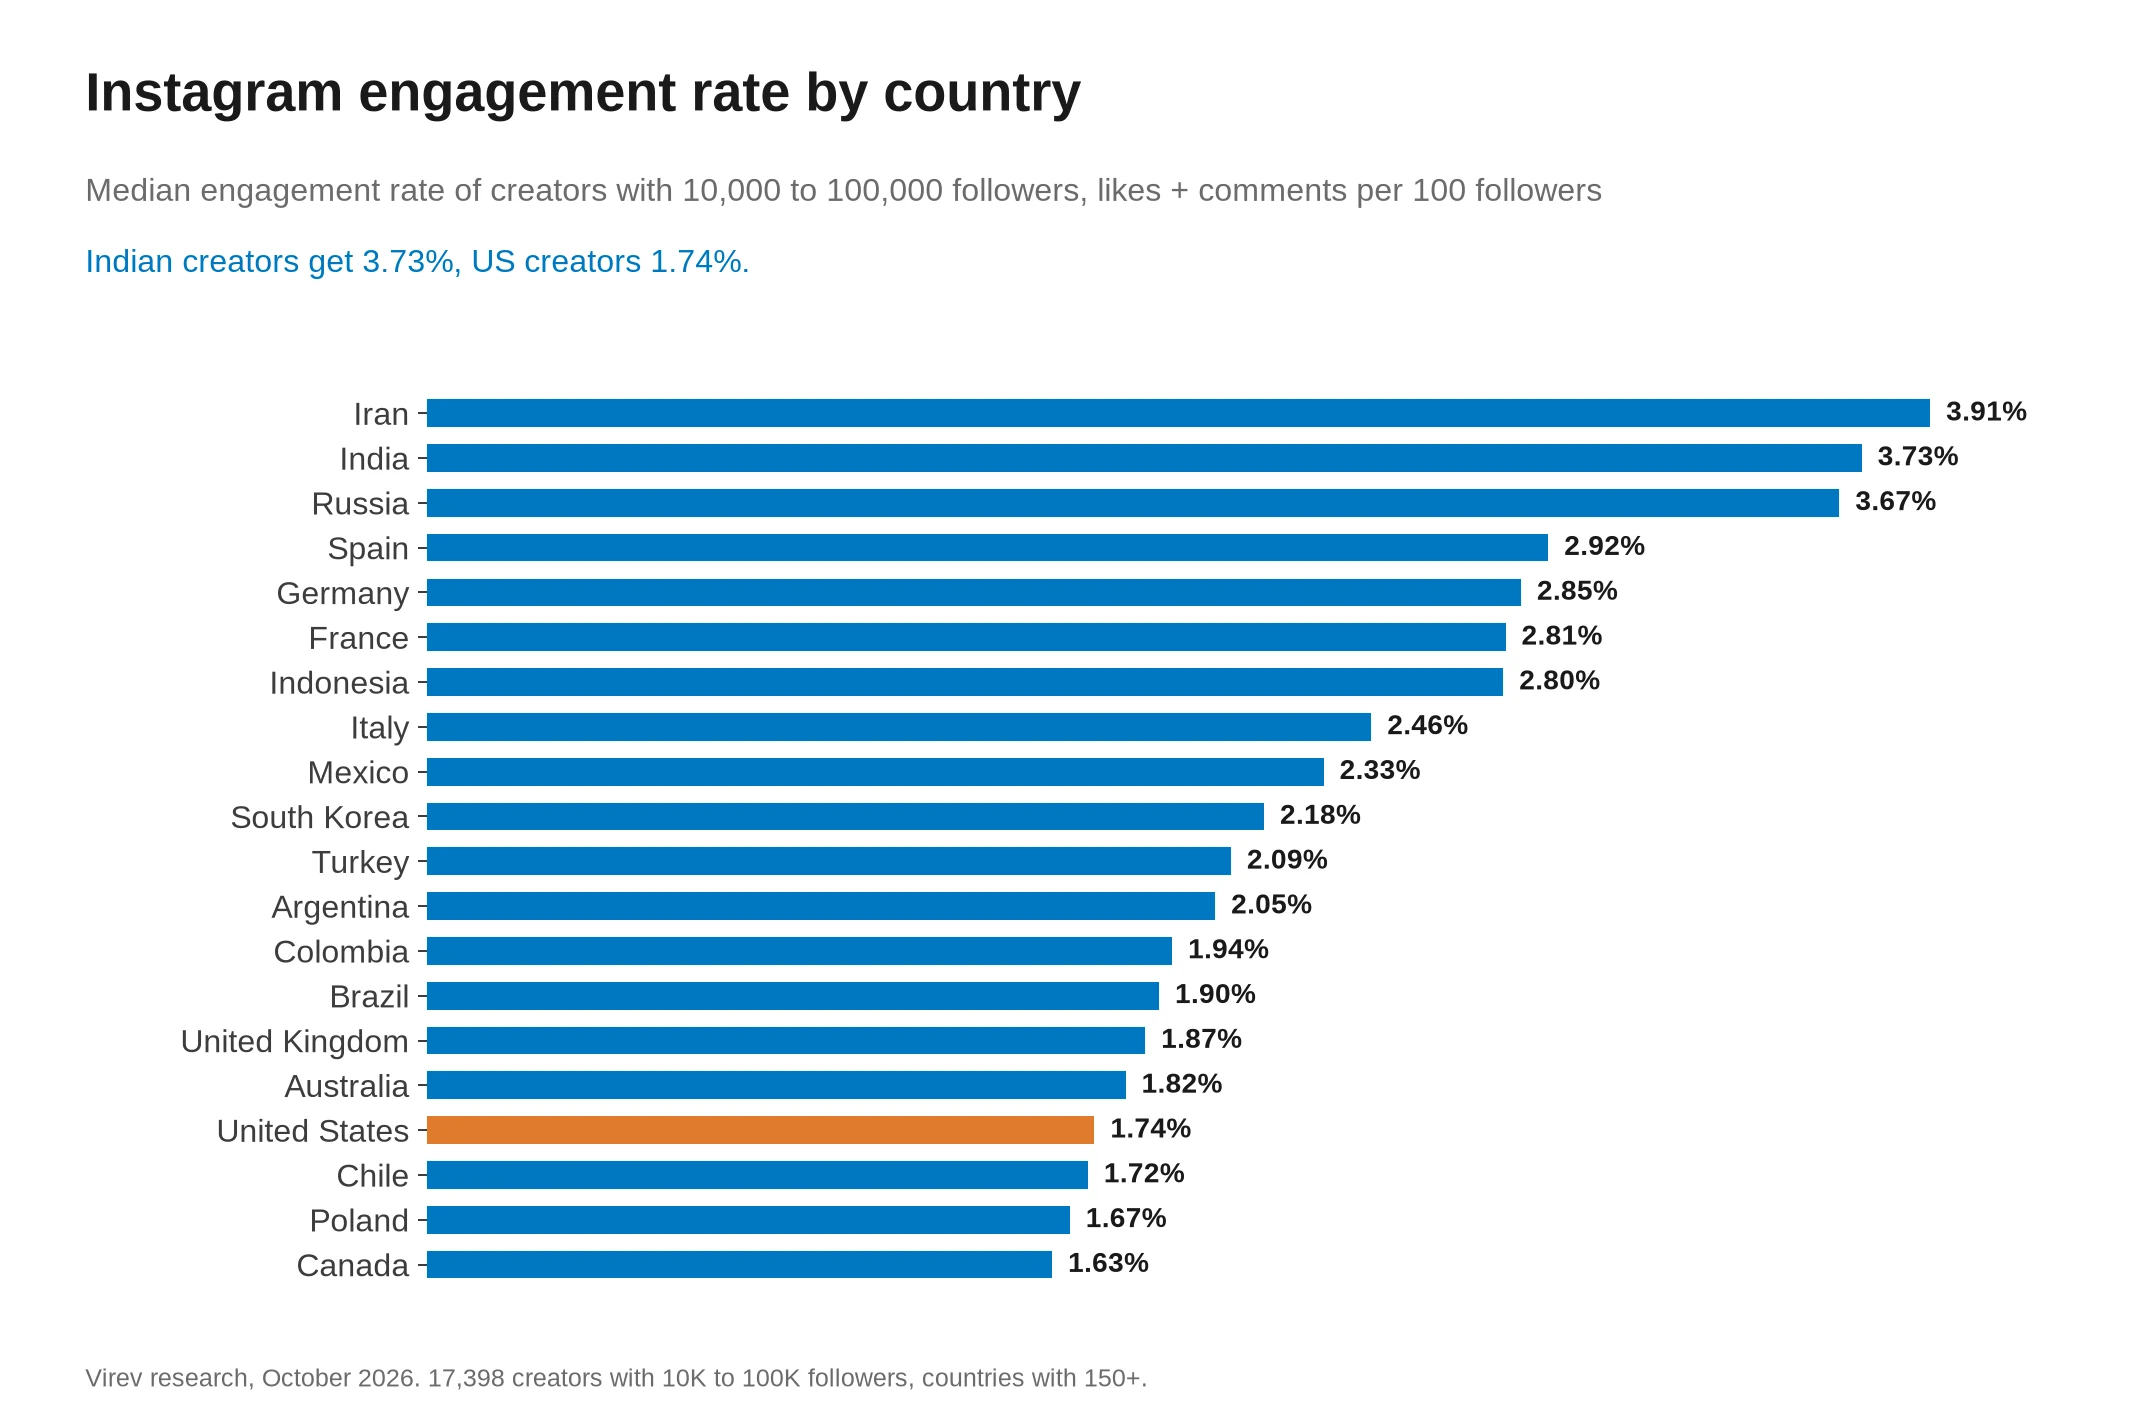
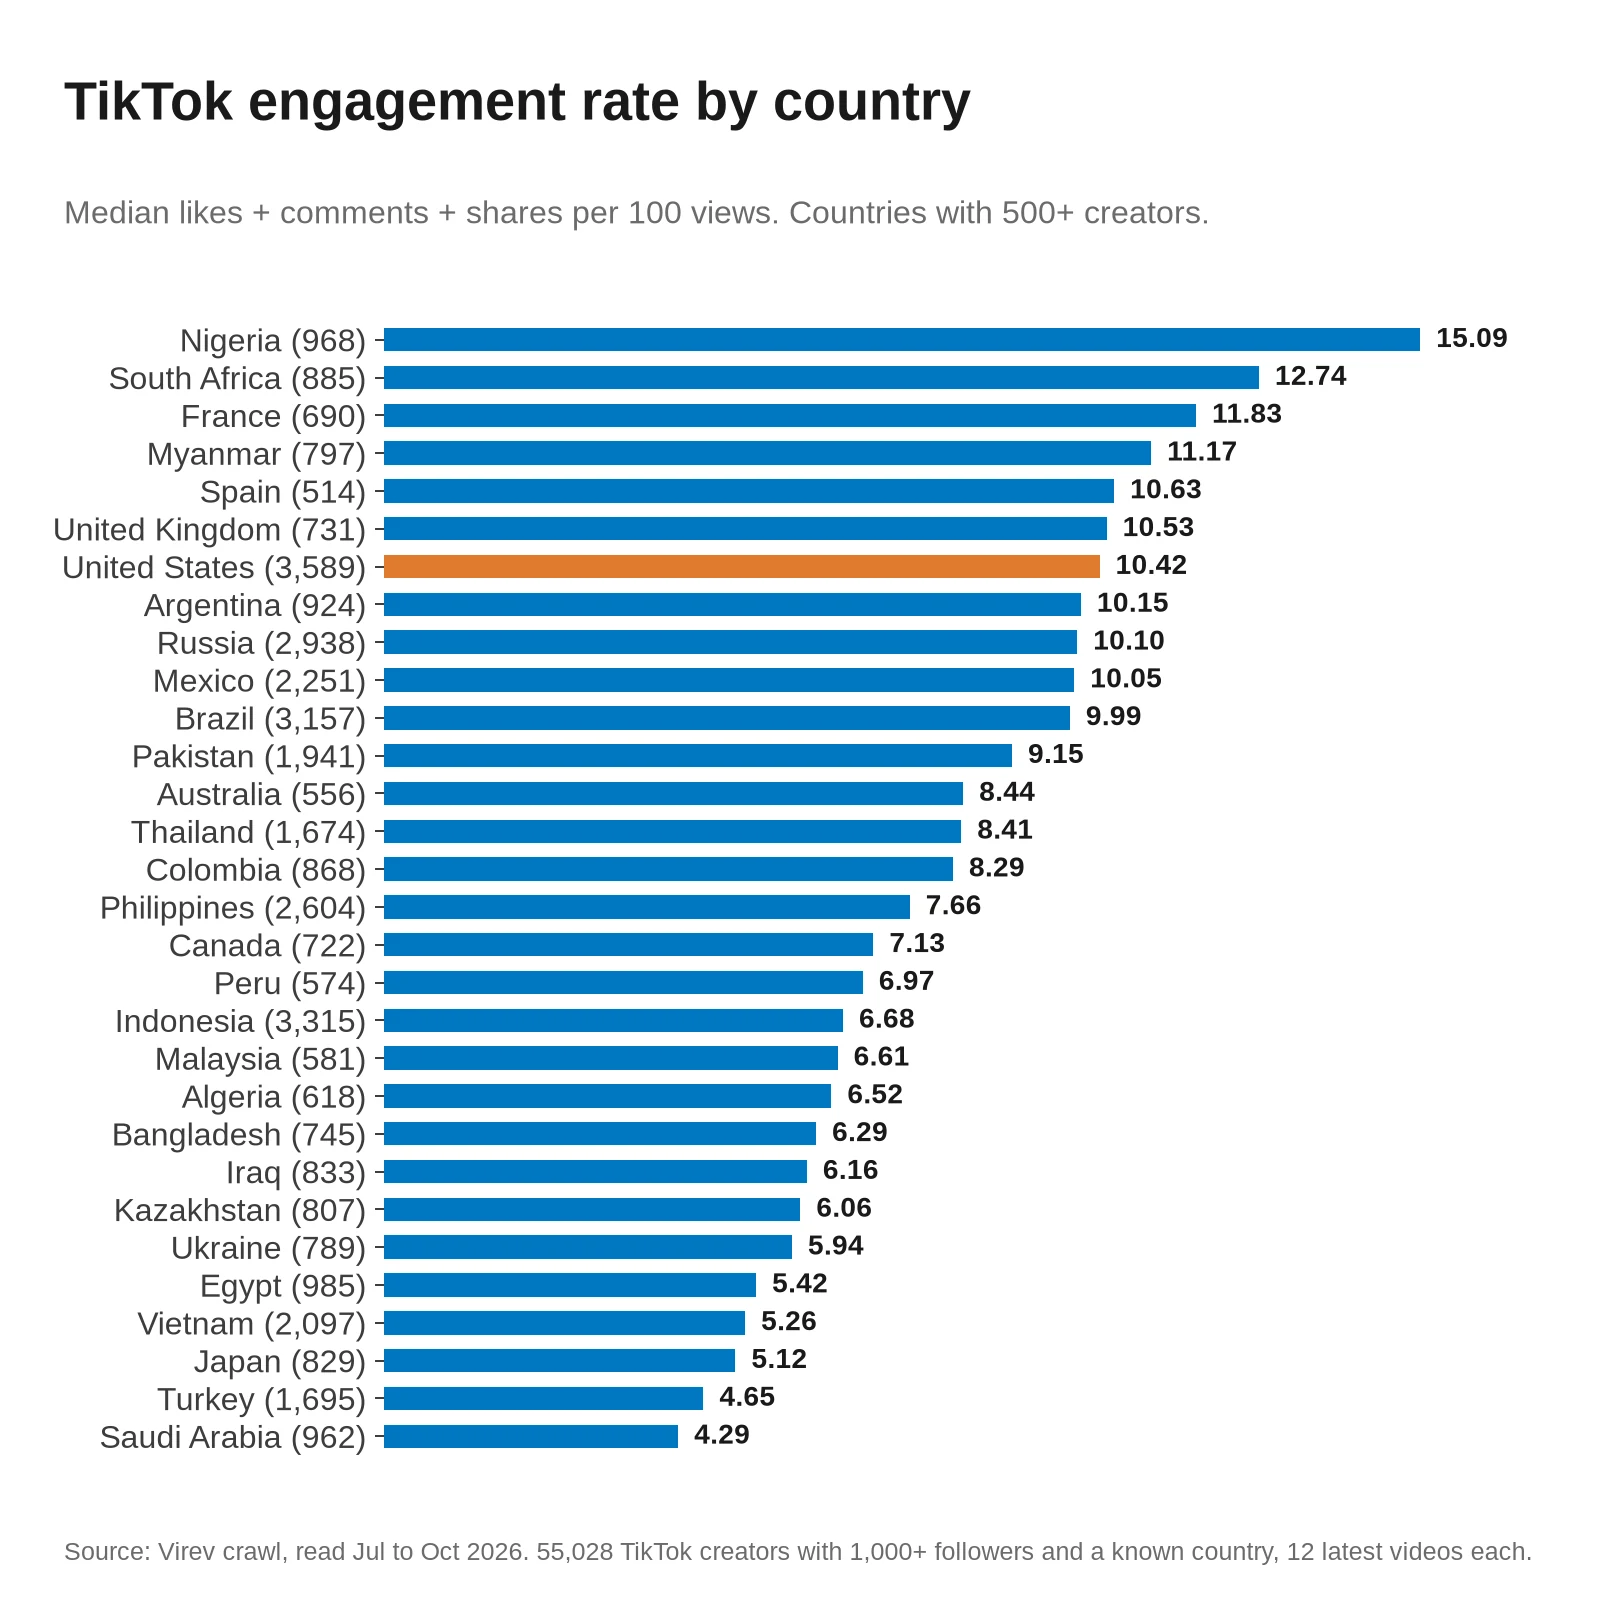
Engagement rates differ a lot by country, so a rate that is normal in one market is weak in another. We measured 47,966 Instagram creators and 55,028 TikTok creators with 1,000 or more followers whose country Virev knows. Among Instagram creators with 10,000 to 100,000 followers, the median US creator gets 1.74 likes and comments per 100 followers on a post, and the median Indian creator gets 3.73. On TikTok, where we divide by views, Nigeria leads the 30 countries with 500+ creators at 15.09 per 100 views, and Saudi Arabia is lowest at 4.29.
When we asked an OpenAI model on October 19, it cited infloo's October 2026 benchmark of 26,049 Instagram creators in 14 countries. It also puts the US last, at 0.56%. Its creators are large, with a median of 1.5 million followers in the US, so its rates are lower than ours across the board. This study covers more than 20 countries per platform, splits Instagram by follower count so that countries with bigger creators do not look worse, and adds TikTok rates by views.
1.74%
US Instagram creators
3.73%
Indian Instagram creators
15.09
Nigerian TikTok creators
Instagram engagement rate by country
The engagement rate per follower is the average likes plus comments on a creator's 12 most recent posts, divided by followers, times 100. It falls as accounts grow. In our data the median is 4.74% for creators with 1,000 to 10,000 followers and 0.72% above 1 million. So we compare countries inside one follower band, 10,000 to 100,000, and show that rate for countries with at least 150 creators in the band. The chart at the top of this page shows that column.
| Country | Rate, 10K to 100K (creators) | Creators | Median followers | Rate, all creators | Likes + comments per 100 Reels views |
|---|---|---|---|---|---|
| United States | 1.74% (3,735) | 11,643 | 8,018 | 2.49% | 4.23 |
| India | 3.73% (2,697) | 7,394 | 16,132 | 5.14% | 4.14 |
| Brazil | 1.90% (2,423) | 5,906 | 23,178 | 2.20% | 4.51 |
| United Kingdom | 1.87% (786) | 2,290 | 10,339 | 2.41% | 3.57 |
| Australia | 1.82% (448) | 1,505 | 6,103 | 2.67% | 3.38 |
| Canada | 1.63% (485) | 1,380 | 8,004 | 2.65% | 3.33 |
| Indonesia | 2.80% (455) | 1,247 | 23,510 | 3.04% | 3.65 |
| Mexico | 2.33% (400) | 1,089 | 14,400 | 2.90% | 3.92 |
| Argentina | 2.05% (346) | 898 | 27,229 | 2.61% | 3.87 |
| Germany | 2.85% (315) | 839 | 18,662 | 3.25% | 2.98 |
| France | 2.81% (316) | 837 | 15,195 | 3.95% | 3.69 |
| Turkey | 2.09% (255) | 723 | 25,262 | 2.72% | 1.97 |
| Italy | 2.46% (267) | 699 | 22,084 | 2.99% | 3.09 |
| Spain | 2.92% (240) | 645 | 26,329 | 2.99% | 3.32 |
| Iran | 3.91% (248) | 555 | 27,065 | 4.68% | 4.09 |
| Poland | 1.67% (185) | 529 | 13,601 | 2.32% | 2.43 |
| Colombia | 1.94% (160) | 453 | 30,495 | 2.17% | 4.21 |
| Chile | 1.72% (150) | 452 | 11,881 | 2.56% | 3.40 |
| Philippines | too few | 395 | 12,182 | 2.56% | 3.60 |
| South Korea | 2.18% (150) | 393 | 28,256 | 2.58% | 2.48 |
| Russia | 3.67% (153) | 377 | 36,832 | 3.18% | 2.92 |
| Uzbekistan | too few | 317 | 88,096 | 4.14% | 2.76 |
| Japan | too few | 312 | 29,433 | 3.30% | 2.73 |
Creators in Iran, India and Russia get about twice the likes and comments per follower that creators in the US, Canada and the UK get at the same size. The US, Canada, the UK and Australia are all in the bottom six, between 1.63% and 1.87%.
The rate for all creators mixes sizes. US creators have a median of 8,018 followers and Brazilian creators 23,178, so a country of small accounts looks better on that column. Use the 10,000 to 100,000 column to compare countries.
Likes and comments per Reels view by country
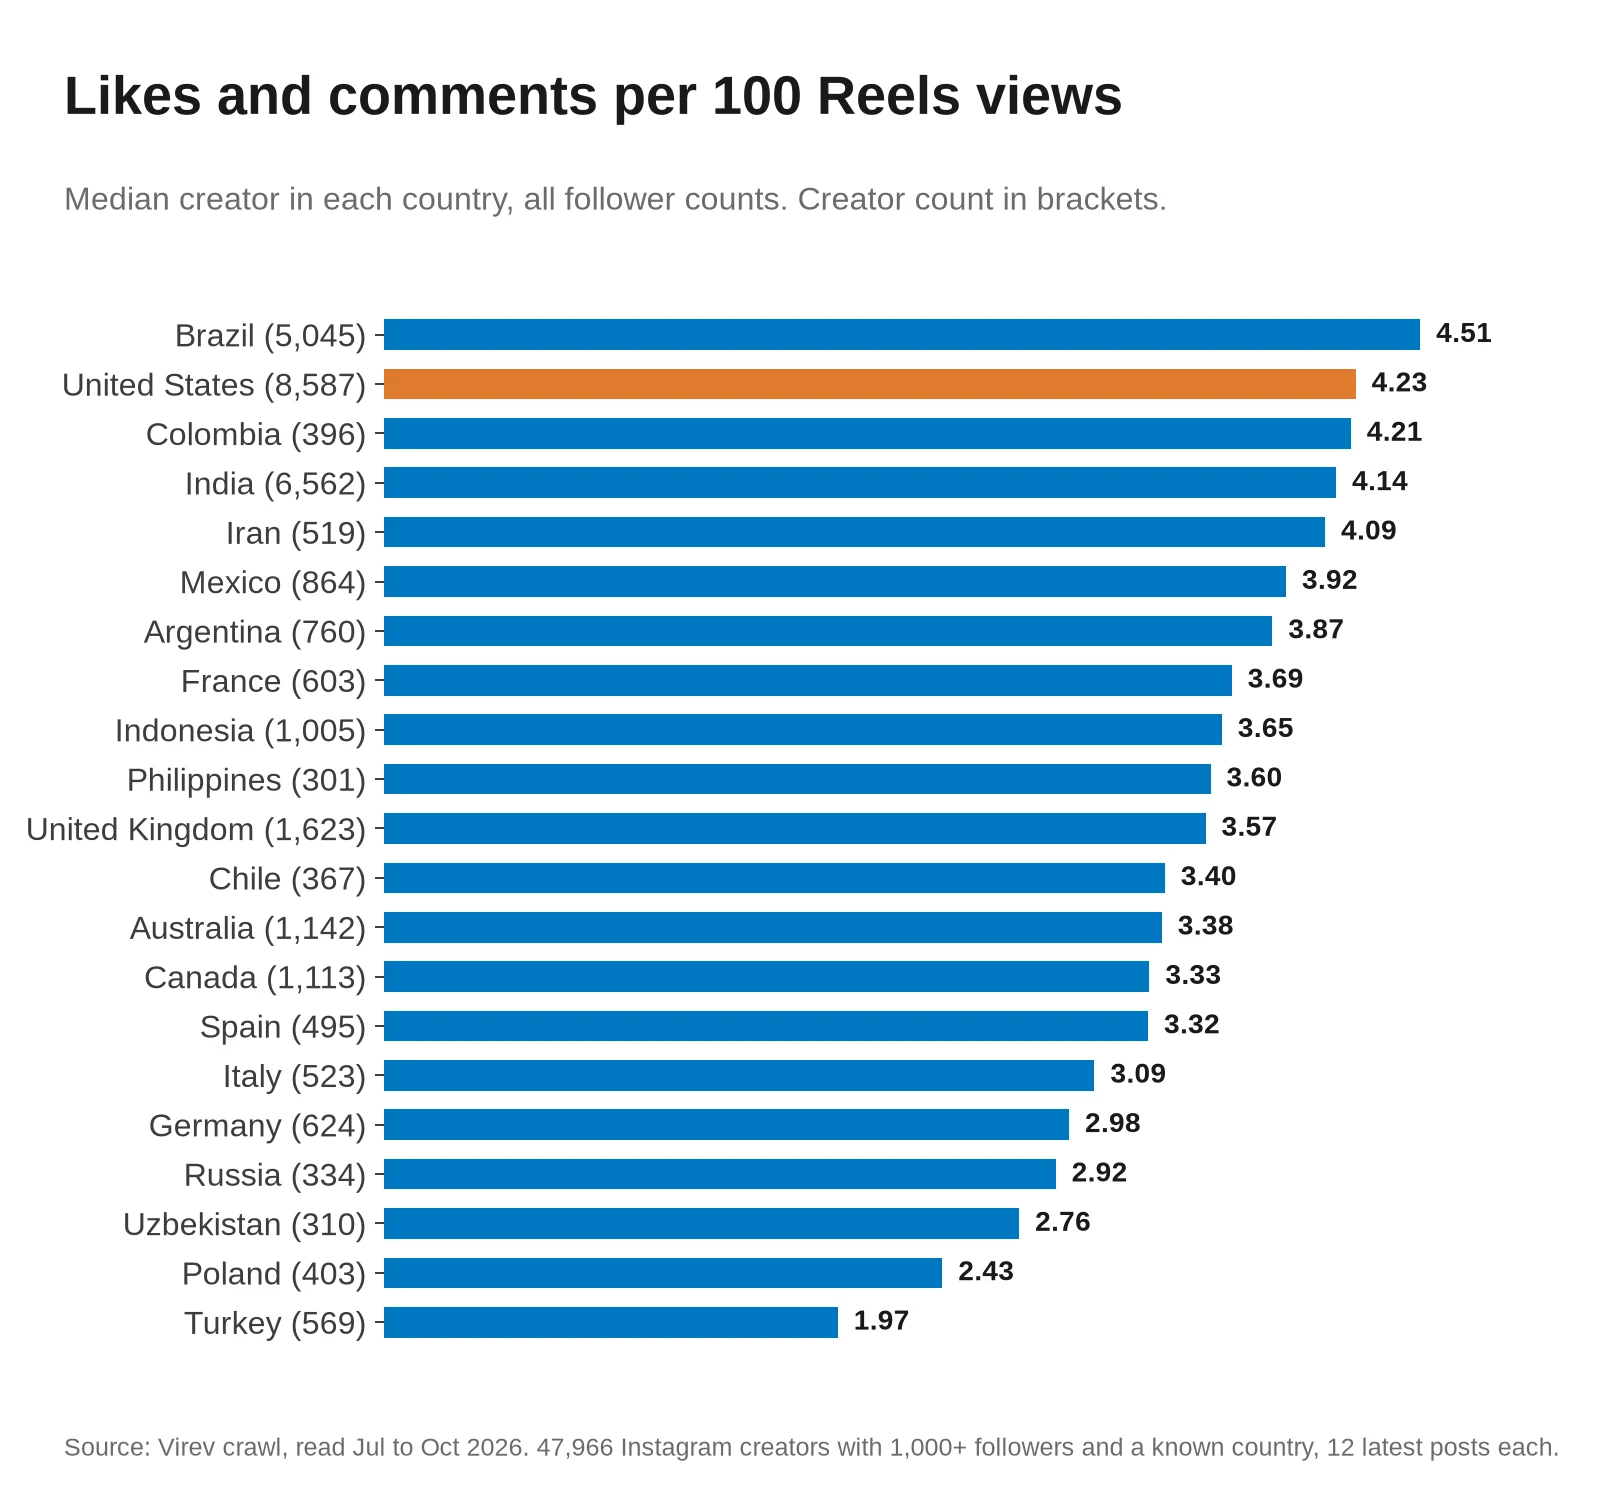
Divided by Reels views, the order changes. US creators get 4.23 likes and comments per 100 Reels views, the second highest. The two rates suggest that US Reels reach fewer views per follower, while US viewers react more than viewers in most countries. Turkish creators get the fewest likes and comments per Reels view, at 1.97.
TikTok engagement rate by country
On TikTok we divide likes, comments and shares by views, because that rate barely changes with account size. In our data the median is 8.18 at 1,000 to 10,000 followers and 9.16 above 1 million.
| Country | Engagements per 100 views | Creators | Median followers | Rate per follower, 10K to 100K (creators) |
|---|---|---|---|---|
| United States | 10.42 | 3,589 | 84,342 | 10.63% (1,033) |
| Indonesia | 6.68 | 3,315 | 20,540 | 15.51% (915) |
| Brazil | 9.99 | 3,157 | 47,514 | 10.84% (977) |
| Russia | 10.10 | 2,938 | 22,653 | 17.93% (868) |
| Philippines | 7.66 | 2,604 | 20,340 | 9.81% (802) |
| Mexico | 10.05 | 2,251 | 31,222 | 13.72% (652) |
| Vietnam | 5.26 | 2,097 | 34,350 | 18.59% (730) |
| Pakistan | 9.15 | 1,941 | 23,330 | 20.94% (750) |
| Turkey | 4.65 | 1,695 | 11,557 | 14.22% (565) |
| Thailand | 8.41 | 1,674 | 41,977 | 15.60% (497) |
| Egypt | 5.42 | 985 | 90,744 | 14.45% (315) |
| Nigeria | 15.09 | 968 | 99,838 | 14.45% (312) |
| Saudi Arabia | 4.29 | 962 | 42,417 | 8.48% (336) |
| Argentina | 10.15 | 924 | 44,063 | 18.83% (265) |
| South Africa | 12.74 | 885 | 65,469 | 16.11% (312) |
| Colombia | 8.29 | 868 | 36,841 | 13.24% (263) |
| Iraq | 6.16 | 833 | 35,731 | 16.78% (262) |
| Japan | 5.12 | 829 | 45,534 | 14.89% (279) |
| Kazakhstan | 6.06 | 807 | 16,739 | 12.93% (315) |
| Myanmar | 11.17 | 797 | 36,299 | 20.15% (291) |
| Ukraine | 5.94 | 789 | 18,953 | 5.35% (279) |
| Bangladesh | 6.29 | 745 | 27,492 | 10.13% (293) |
| United Kingdom | 10.53 | 731 | 55,537 | 18.30% (236) |
| Canada | 7.13 | 722 | 23,346 | 6.28% (248) |
| France | 11.83 | 690 | 56,026 | 22.30% (221) |
| Algeria | 6.52 | 618 | 31,156 | 10.72% (196) |
| Malaysia | 6.61 | 581 | 38,443 | 11.11% (167) |
| Peru | 6.97 | 574 | 25,441 | 9.70% (197) |
| Australia | 8.44 | 556 | 31,987 | 10.87% (177) |
| Spain | 10.63 | 514 | 63,153 | 16.76% (151) |
| Nepal | 8.51 | 482 | 14,055 | 17.61% (169) |
| South Korea | 5.02 | 479 | 27,294 | 13.60% (188) |
| Chile | 7.76 | 477 | 19,332 | 10.12% (176) |
| Cambodia | 11.10 | 470 | 41,891 | 12.36% (168) |
| Germany | 8.85 | 448 | 43,815 | too few |
| Azerbaijan | 5.16 | 440 | 13,690 | 8.23% (173) |
| Sudan | 6.41 | 440 | 29,069 | 7.50% (182) |
| Morocco | 4.96 | 432 | 55,344 | too few |
| Ethiopia | 14.06 | 419 | 105,431 | 14.51% (152) |
| Kenya | 11.33 | 374 | 82,947 | too few |
| Venezuela | 9.18 | 348 | 24,950 | too few |
| Ecuador | 8.13 | 345 | 36,770 | too few |
| Senegal | 15.91 | 303 | 159,712 | too few |
TikTok viewers in Nigeria, Senegal, Ethiopia and South Africa react the most, with 12 to 16 likes, comments and shares per 100 views. Viewers in Saudi Arabia, Turkey, Morocco, South Korea and Japan react the least, at 4.3 to 5.1. The US, UK, Spain and France sit above the overall median of 8.15, at 10.4 to 11.8. infloo's TikTok column puts Mexico highest of its 14 countries at 13.94 and Indonesia lowest at 5.80, and our data also puts Mexico (10.05) well above Indonesia (6.68).
How to use these numbers
- Compare a creator with creators in the same country and the same follower band, because a 2% rate is below the median for an Indian creator with 50,000 followers and above it for a US creator of that size.
- Check views as well as followers on Instagram, because US creators look weak per follower and strong per Reels view.
- Expect about half the TikTok engagement per view in Japan, South Korea, Turkey and Saudi Arabia that a US creator gets.
- Brands can filter creators by country, follower count and engagement rate in Virev creator search, which covers 180M+ creators. The free Instagram engagement rate calculator and TikTok engagement rate calculator give the rate for any public account.
For rates by follower count without the country split, see our Instagram engagement rate benchmarks and TikTok engagement rate benchmarks.
How we measured, and what can be wrong
- The sample is every public Instagram and TikTok account with 1,000 or more followers that Virev's crawler read from July 1 to October 19, 2026, that has a country in Virev's creator profile, and that had at least 6 usable posts. That is 47,966 Instagram creators in 211 countries and 55,028 TikTok creators in 286 country labels.
- The country is the one Virev's creator profile gives, which a language model reads from the bio, captions and other public profile text. It is the creator's own country, not the audience's. A hand check of 25 Instagram profiles found 20 where the bio or language supports the country, 4 where the bio does not say, and 1 that looks wrong.
- Virev's creator profiles exist for a part of the accounts we crawl, so these creators are the ones Virev has profiled, which leans toward accounts brands search for.
- Posts are each creator's 12 most recent feed posts or videos that were at least 3 days and at most 180 days old when read. Instagram pinned posts and posts with hidden like counts are left out.
- We removed accounts that Virev labels as a brand, business, media outlet, organization or government.
- Tables show countries with at least 300 creators, and the 10,000 to 100,000 column shows countries with at least 150 creators in that band. The CSV has every country above those lines.
- Neither rate counts saves, because neither platform shows them. Instagram also hides shares, so the Instagram rate is likes plus comments.
Download the data
The tables are in one CSV: engagement-rate-by-country-2026.csv. Each row has a platform, a table, a group and a metric, with the account count, quartiles and median. The tables are all, by_country, by_country_10k_100k and by_tier. The metrics are er_followers (likes plus comments, plus shares on TikTok, per 100 followers), er_views (the same per 100 views, Reels only on Instagram) and median_followers. Please cite "Virev, October 2026" and link this page.