



On Instagram, post on Sunday, and late in the evening: from 9 PM to 3 AM local time. On TikTok, post from 6 to 9 AM. Those are the best slots in our data. They are also worth less than most guides suggest. We compared 6.1 million posts with other posts by the same creator. The best 3-hour window on Instagram beats the worst by 5.5%. On TikTok the gap is 3.7%.
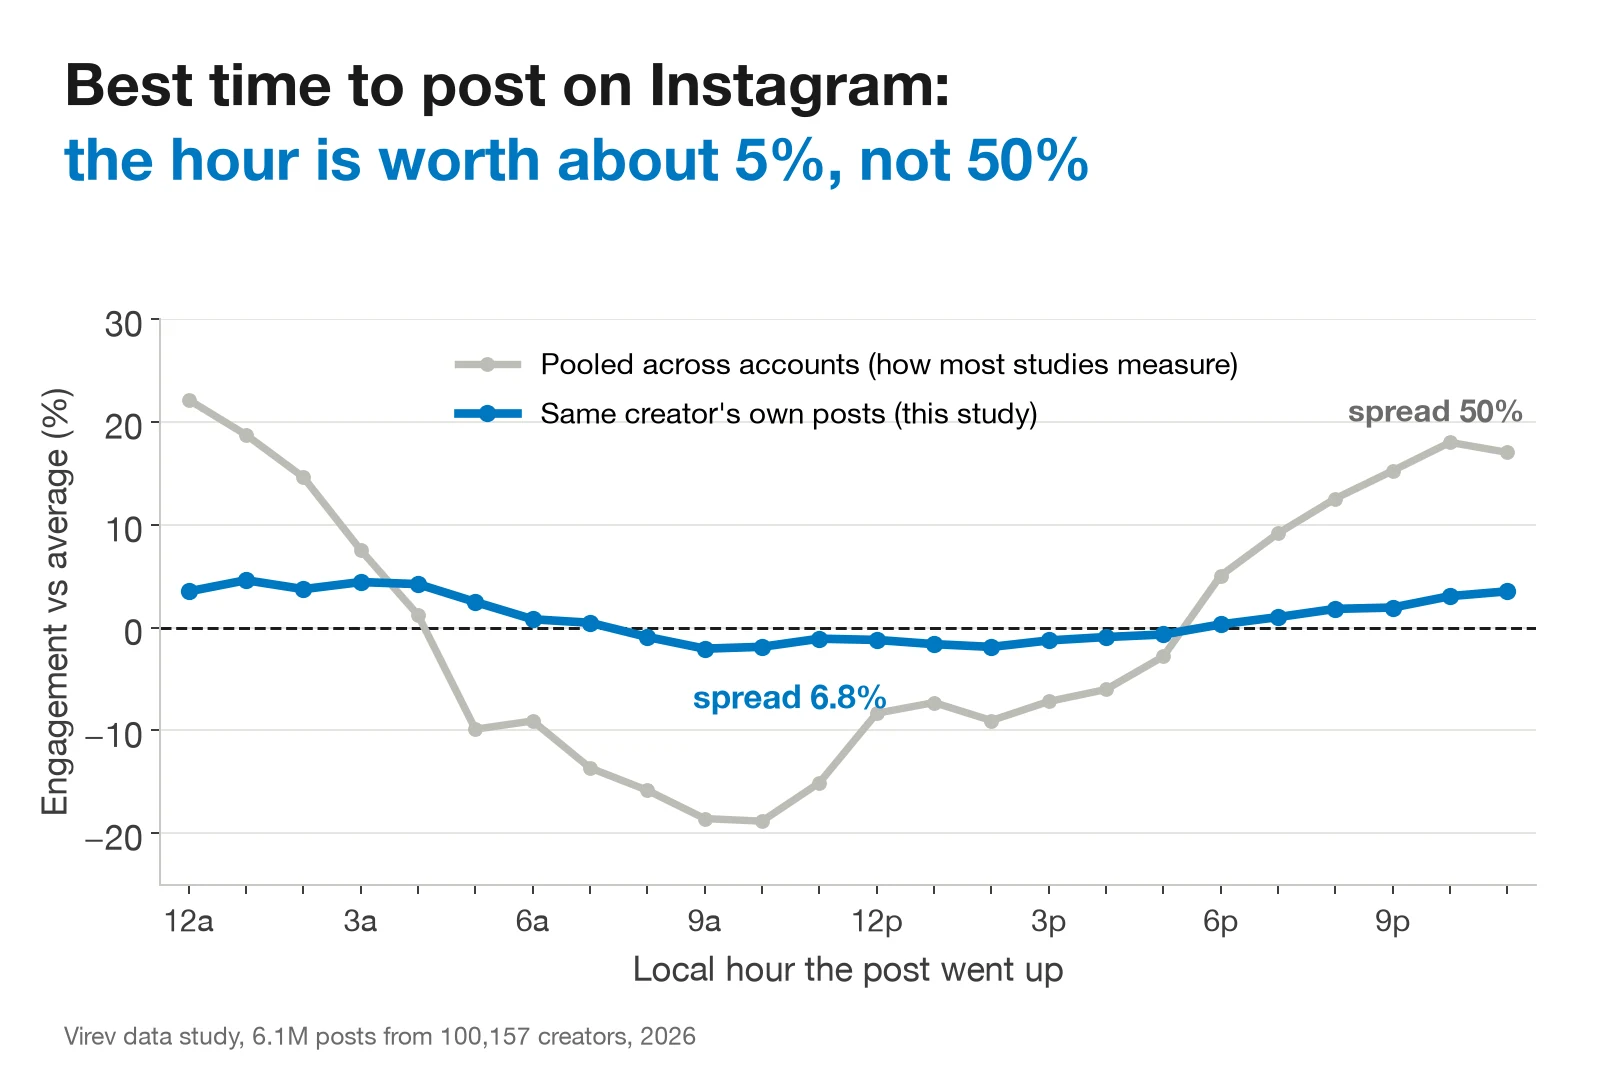
The best-known studies come from scheduling tools. They pool all their customers' posts and compare engagement rates hour by hour. Measured that way, the hours on Instagram differ by 50% in our data too. Most of that gap comes from who posts at each hour. Small accounts post late at night, and small accounts have higher engagement rates. Once each post is compared with the same creator's own average, the gap shrinks to a few percent.
For TikTok on its own, with views, regional heatmaps and posting frequency, read our study of the best time to post on TikTok.
5.5%
3.7%
TikTok
30%
Reel vs image
The short answer, with the size of the effect
All times are the creator's local time. "Gap" is how much more the best slot gets than the worst, for the same creator.
| App | Best window | Worst window | Gap | Best day | Day gap |
|---|---|---|---|---|---|
| 12 to 3 AM | 9 AM to noon | 5.5% | Sunday | 5.6% | |
| TikTok | 6 to 9 AM | 9 PM to midnight | 3.7% | Sunday | 2.2% |
The worst day is Wednesday on both apps. "Day gap" is Sunday against Wednesday.
On Instagram, the whole evening is above average. Posts from 6 to 9 PM get 1.0% more than the creator's average, 9 PM to midnight 2.7% more, and midnight to 3 AM 3.9% more. Working hours are below average: 9 AM to 6 PM runs 0.9% to 1.6% under. On TikTok, the early morning stands out: 6 to 9 AM gets 3.0% more. Every other window sits within 1% of average.
Combine the day and the hour, and the best Instagram slot is Saturday night into Sunday: posts from midnight to 3 AM on Sunday get 11% more than the creator's average. The worst slots are weekday mornings, at 3% under. That is a 15% gap between the single best and worst slot. Fewer than 1 in 200 Instagram posts in our data go out in that best slot.
Why other studies find much bigger gaps
The top results for this question come from Buffer, Hootsuite and Sprout Social. Buffer analyzed 9.6 million Instagram posts and 7.1 million TikTok posts from its customers. Sprout Social measured about 2 billion engagements across 307,000 profiles. Their method is a median engagement rate per time slot, across all accounts. They do not agree with each other: Buffer finds Saturday the best day for TikTok, and Sprout Social finds Sunday the worst. On Instagram, Buffer ranks Thursday 9 AM first, and Sprout Social Monday 2 to 4 PM.
We ran their method on our data first.
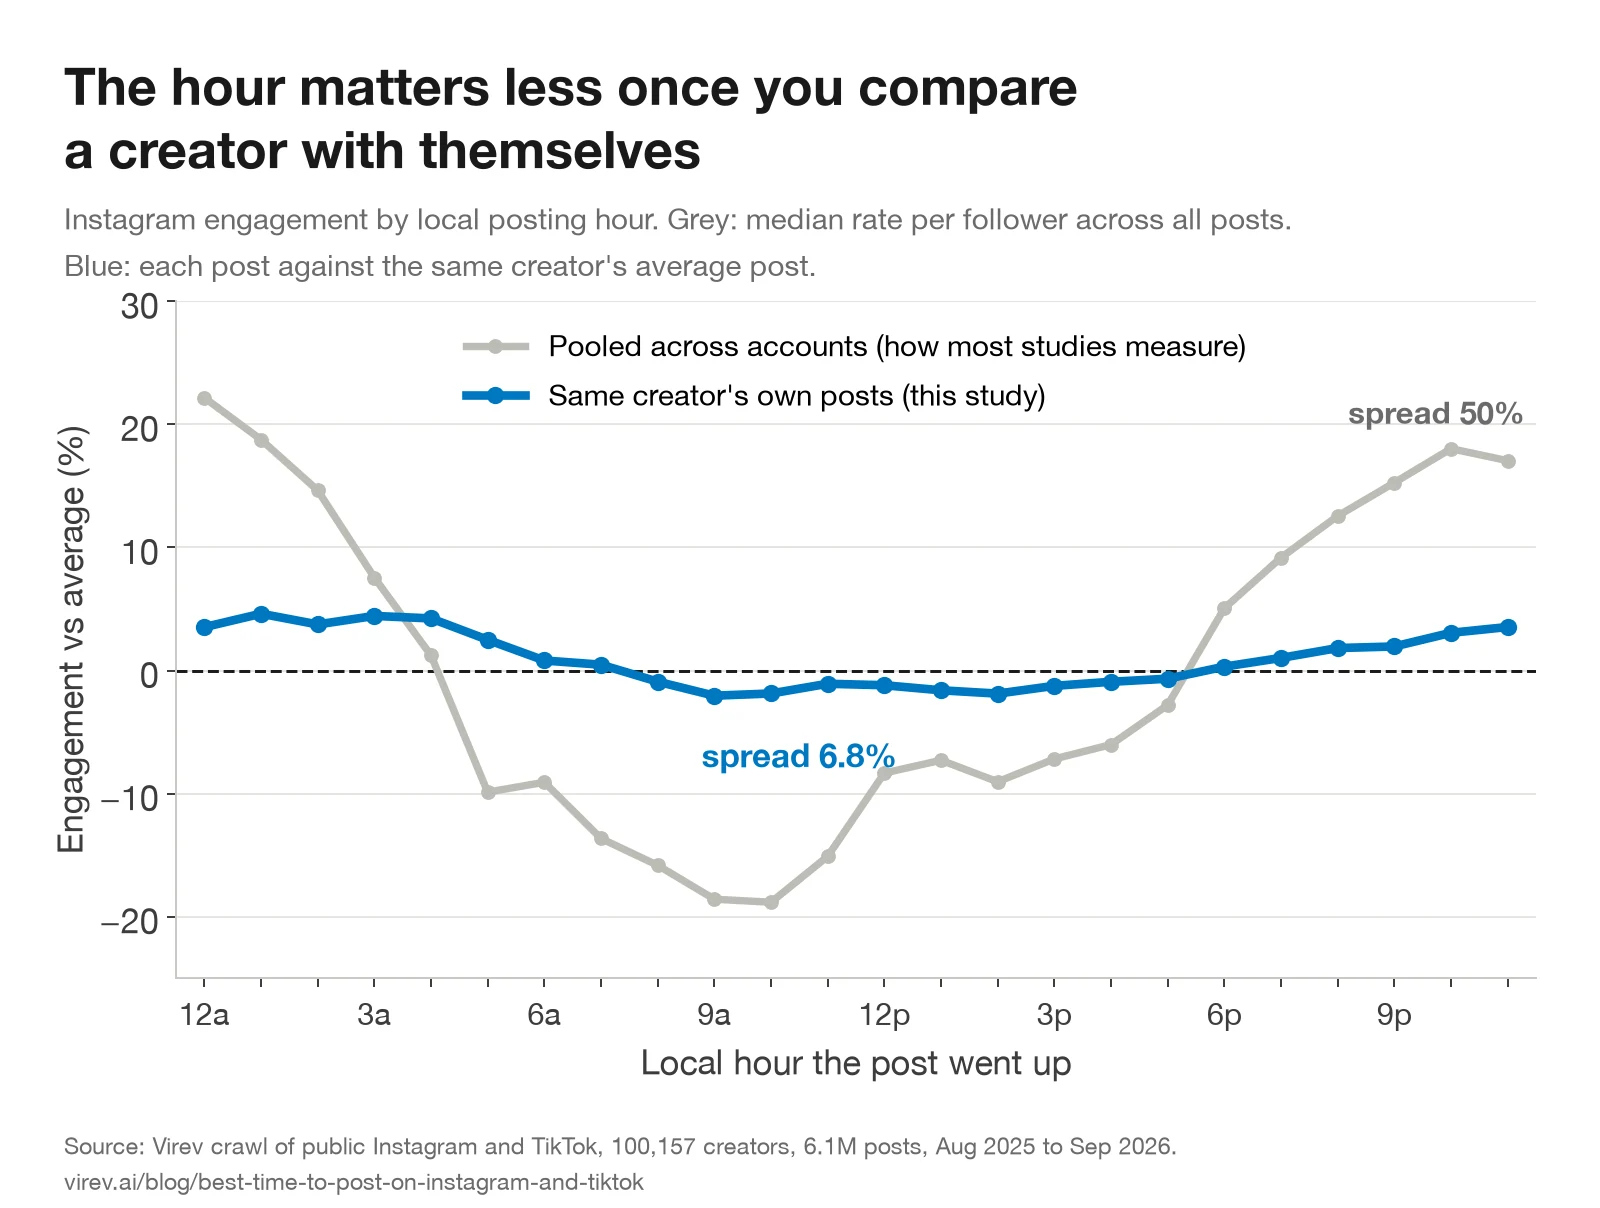
Pooled across accounts, the best hour on Instagram gets 50% more engagement per follower than the worst. On TikTok, 33%. Compared within each creator, the gaps are 6.8% and 5.4% by single hour.
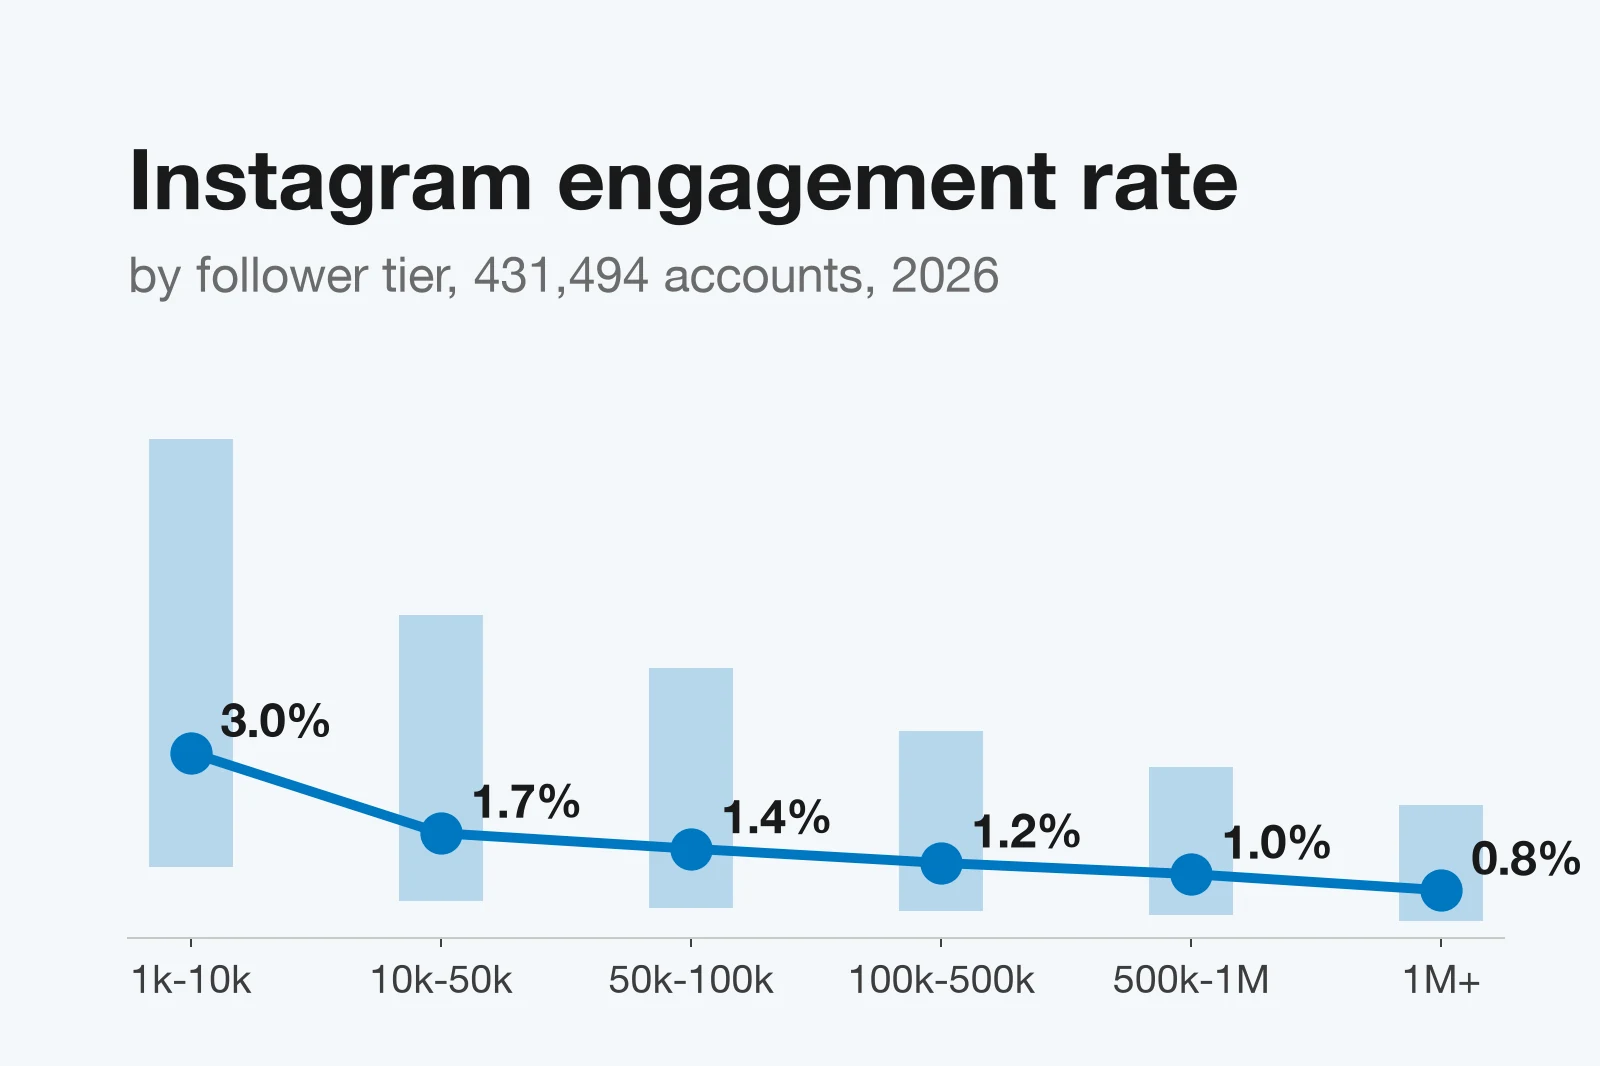
The difference is who posts when. Instagram posts from midnight to 3 AM come from accounts with a median of 14,115 followers. Posts from 6 to 9 PM come from accounts with 26,186. Smaller accounts have higher engagement rates at any hour (see our Instagram engagement rate benchmarks). So the pooled night peak is partly a small-account peak. On TikTok the pooled method even flips the answer: 6 to 9 AM looks like the worst window (12% under the median), and within creators it is the best (3.0% over).
The scheduling-tool studies have one more limit: their data is their customers, mostly brand accounts. Ours is creators.
Instagram: weekend nights do best
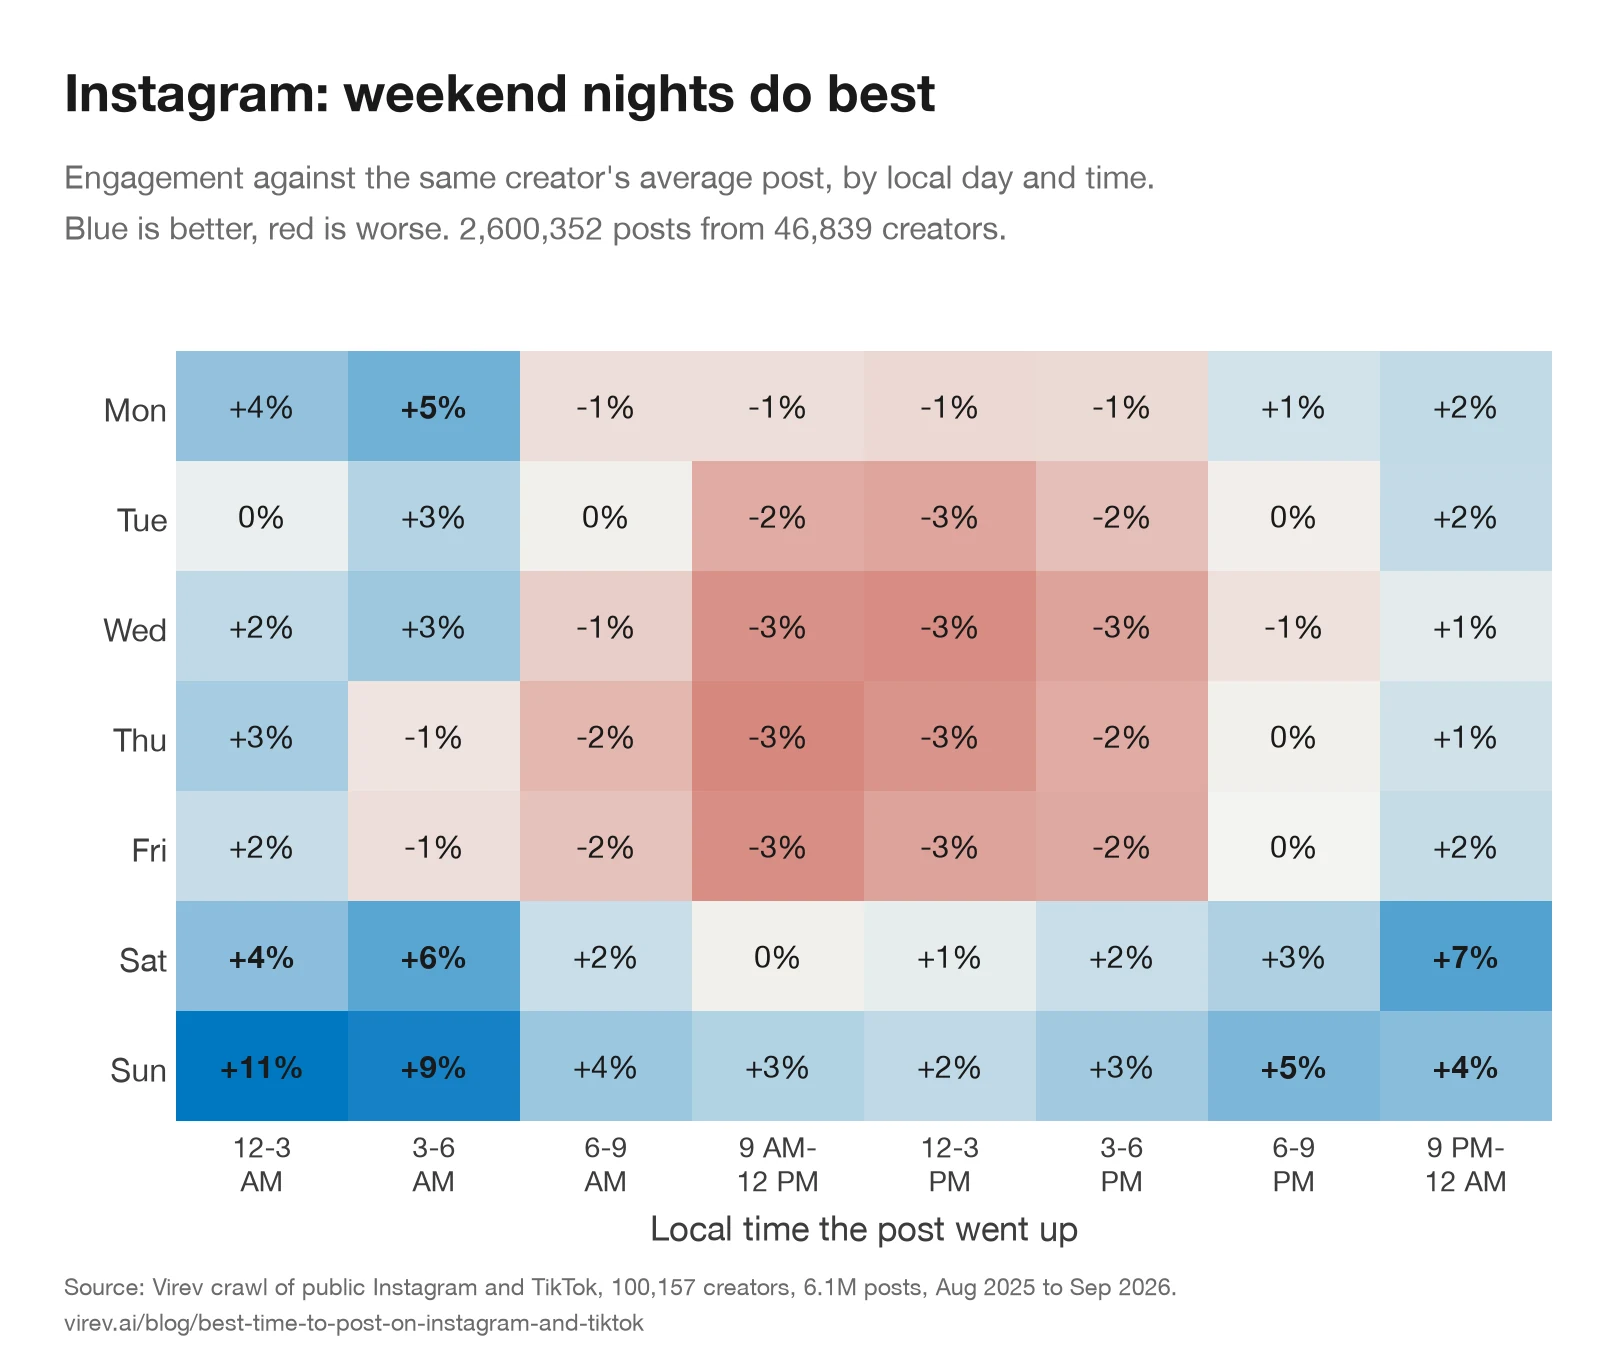
Two patterns hold on Instagram. Weekend posts beat weekday posts, at every hour. And evening posts beat daytime posts, on every day. They hold in almost every group we split out:
- Sunday is the best day for all five follower tiers, 12 of 13 categories (travel creators do best on Saturday) and 13 of 18 countries.
- Midnight to 3 AM or 9 PM to midnight is the best window for all five tiers and 11 of 13 categories.
- 6 to 9 PM has a quarter of all posts and gets 1.0% over average. It is the busiest window and only a little above average.
TikTok: early mornings do best, by a little
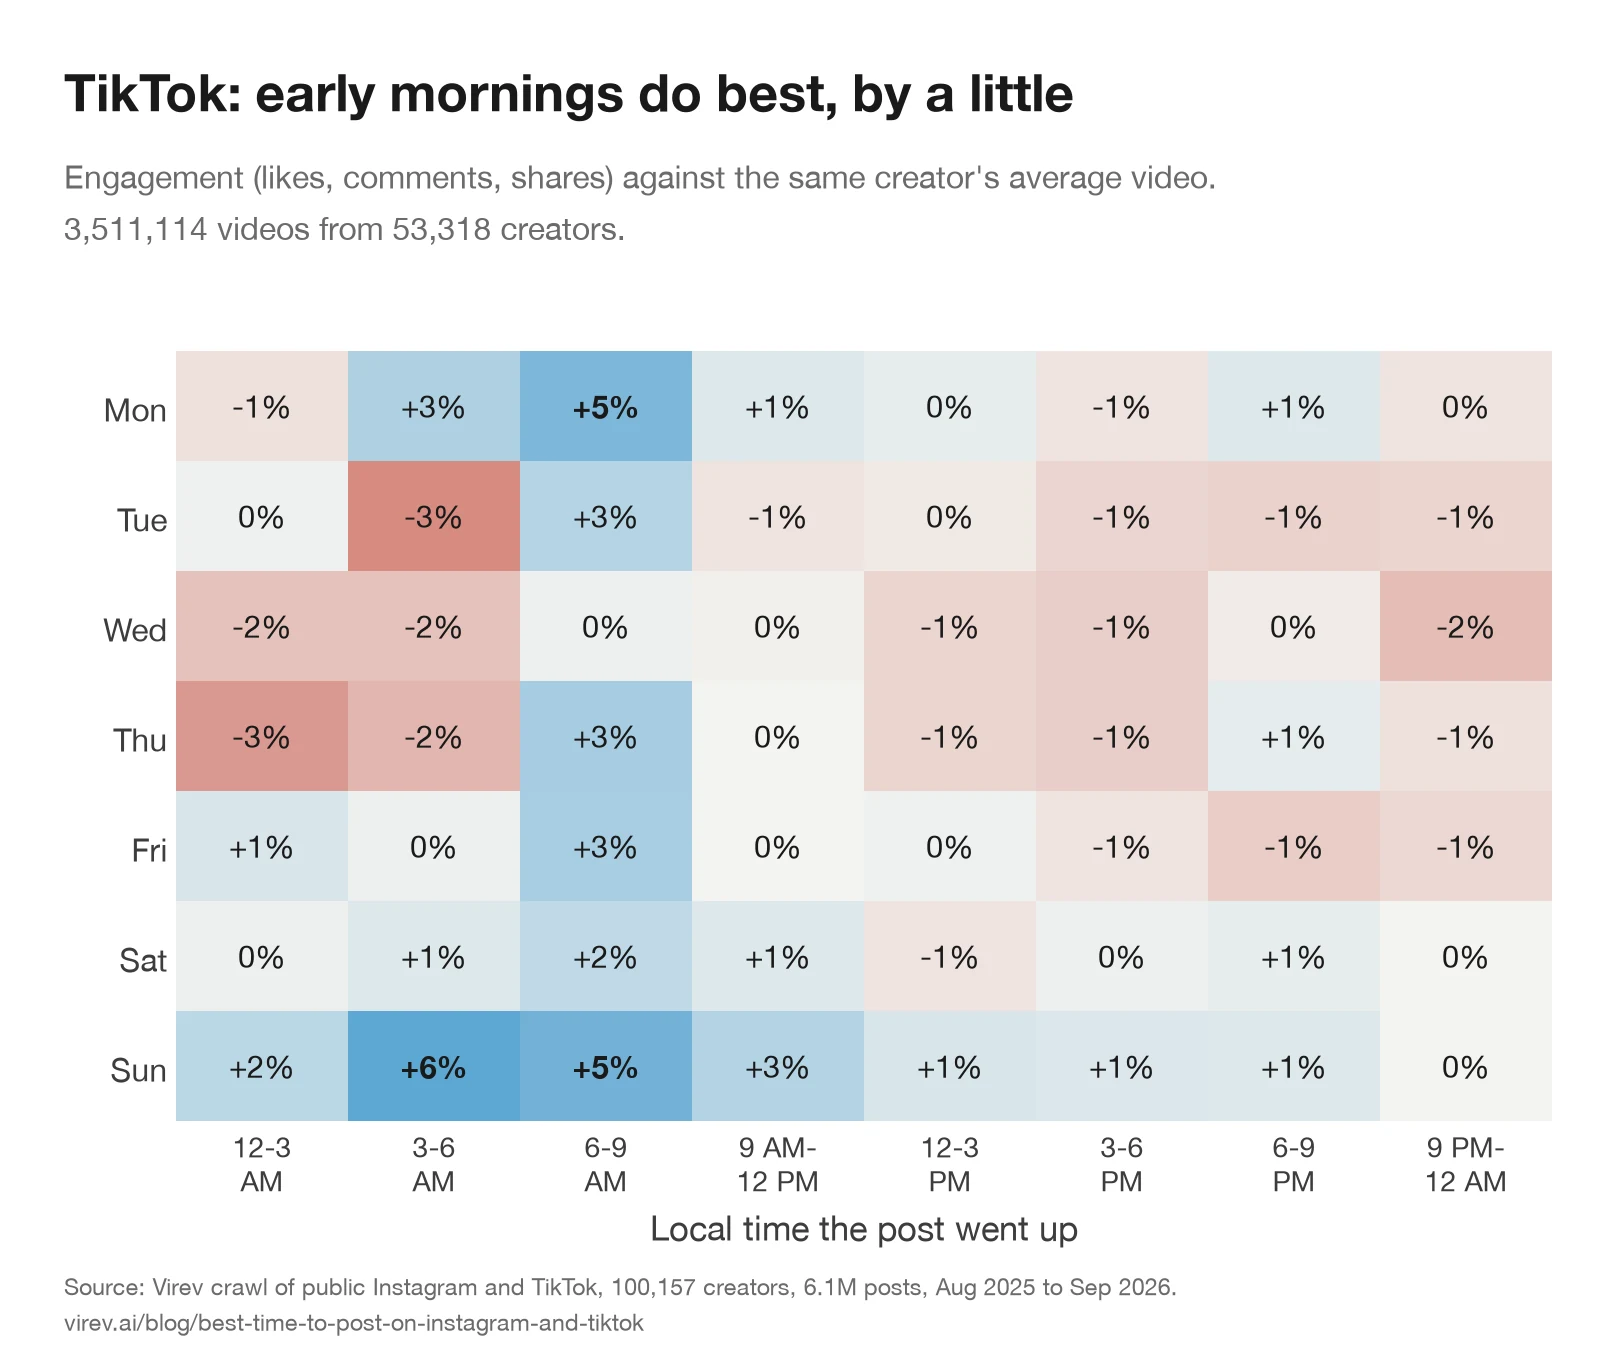
TikTok is flatter. The 6 to 9 AM window is the best in 12 of 15 categories and 18 of 30 countries. Sunday morning is the best slot, at 5% to 6% over average. Most other cells are within 1%.
One reason TikTok is flatter: the For You feed keeps showing a video for days, to people who do not follow the creator. The first hours matter less when most views come later. Views follow the same pattern as engagement here (the CSV has both).
Sunday is the best day on both apps
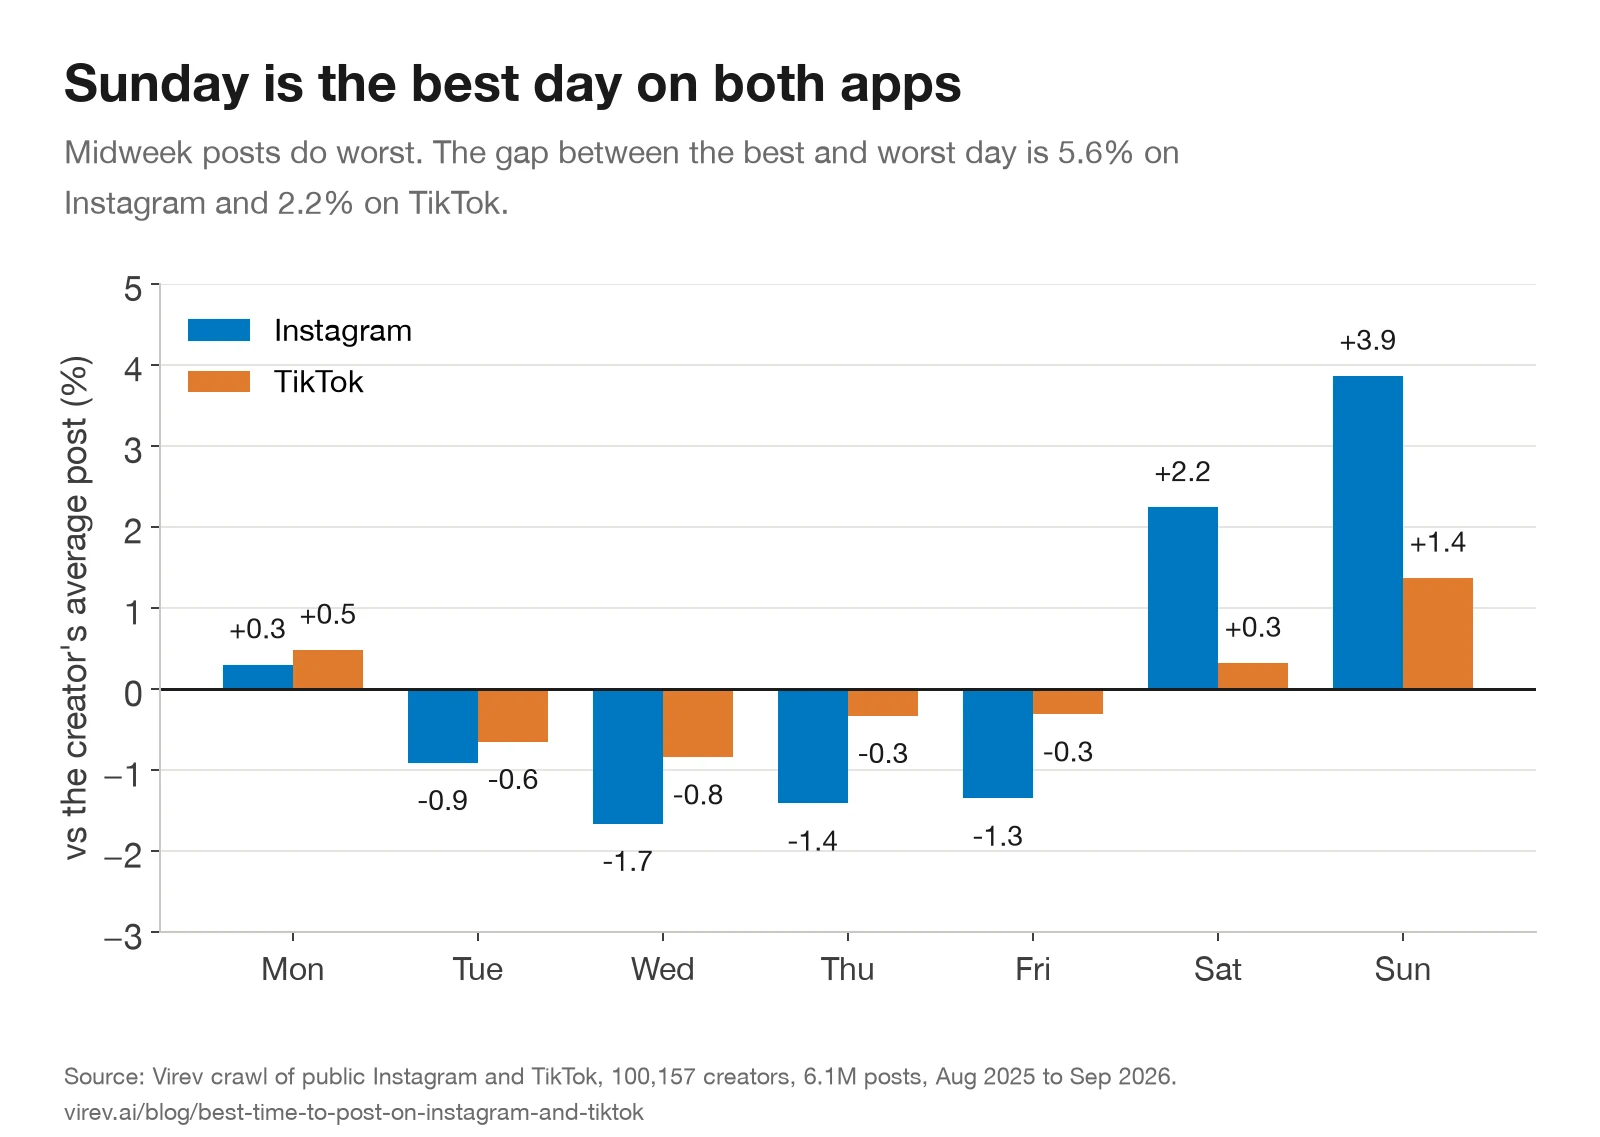
Creators post less on weekends: 12% of Instagram posts go out on Saturday and 13% on Sunday, against 15% on each weekday. Fewer posts compete for the same feed, and people scroll more at home. Both may explain the weekend lift. Our data shows the lift, not the reason.
This is the opposite of the advice on the top pages for this query. Buffer calls Friday and Saturday the worst days for Instagram, and Sprout Social the whole weekend. For a creator compared with themselves, the weekend is the best time.
Big Instagram accounts gain more from timing
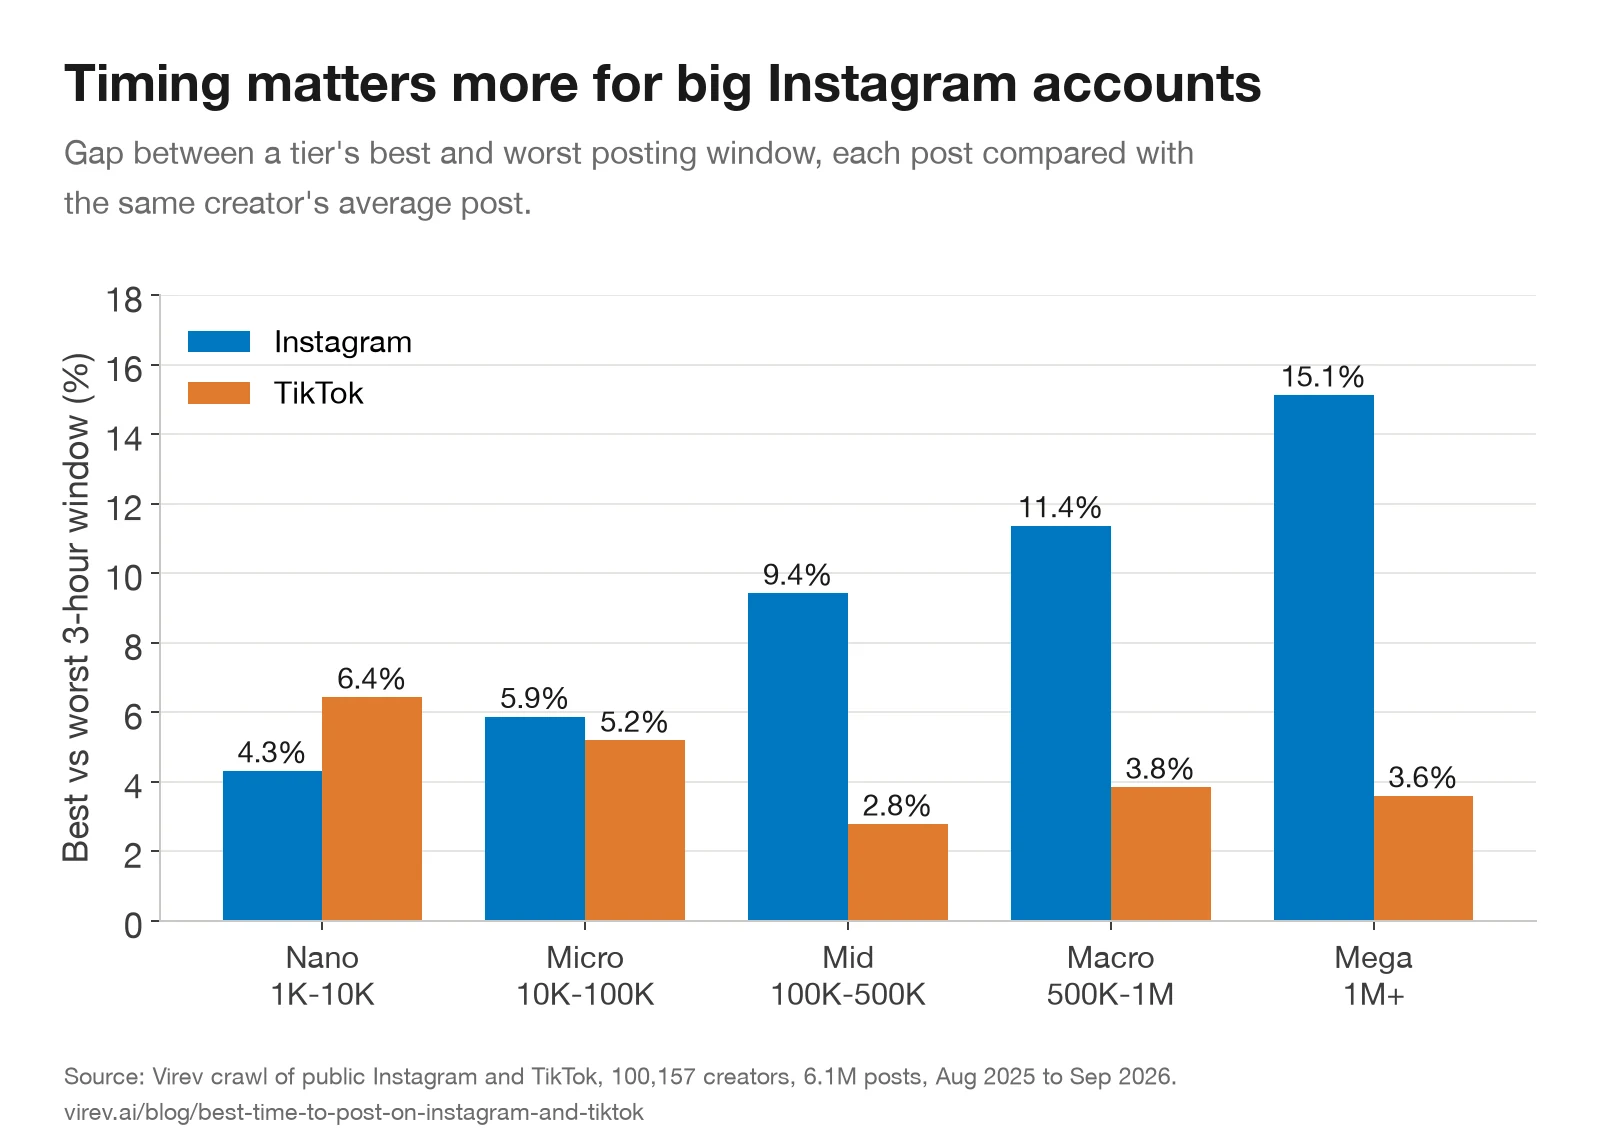
| Tier | Instagram best window | Instagram gap | TikTok best window | TikTok gap | Best day (both) |
|---|---|---|---|---|---|
| Nano, 1K to 10K | 12-3 AM | 4.3% | 6-9 AM | 6.4% | Sun / Mon |
| Micro, 10K to 100K | 12-3 AM | 5.9% | 6-9 AM | 5.2% | Sun / Sun |
| Mid, 100K to 500K | 12-3 AM | 9.4% | 6-9 AM | 2.8% | Sun / Sun |
| Macro, 500K to 1M | 12-3 AM | 11.4% | 9 PM-12 AM | 3.8% | Sun / Sun |
| Mega, 1M+ | 12-3 AM | 15.1% | 9 PM-12 AM | 3.6% | Sun / Sun |
On Instagram the time effect grows with size. A creator with over a million followers gets 15% more from a post at midnight than from one at midday. For creators under 10,000 followers, the gap between their best and worst window is 4%. Large accounts have followers in many time zones, so a late post in one country lands in the evening of another. On TikTok the pattern runs the other way, and the gaps stay small.
By country
"Gap" is the best 3-hour window against the worst, for the same creator. "Weekend lift" is weekend posts against weekday posts. Instagram, countries with 700 or more creators:
| Country | Creators | Best window | Gap | Best day | Weekend lift |
|---|---|---|---|---|---|
| United States | 9,738 | 12-3 AM | 7.2% | Sun | +5.1% |
| India | 6,239 | 12-3 AM | 6.4% | Sun | +1.0% |
| Brazil | 4,889 | 9 PM-12 AM | 4.2% | Sun | +5.8% |
| South Korea | 4,017 | 9 PM-12 AM | 4.1% | Sat | +5.6% |
| Japan | 2,903 | 9 PM-12 AM | 3.5% | Sun | +3.4% |
| United Kingdom | 1,938 | 9 PM-12 AM | 4.5% | Sun | +4.4% |
| Australia | 1,296 | 9 PM-12 AM | 3.8% | Sat | +5.2% |
| Canada | 1,148 | 12-3 AM | 6.8% | Sun | +3.6% |
| Indonesia | 1,050 | 12-3 AM | 10.4% | Sun | +4.3% |
| Mexico | 920 | 9 PM-12 AM | 7.0% | Sun | +3.1% |
| Thailand | 897 | 12-3 AM | 18.4% | Sun | +5.8% |
| France | 746 | 12-3 PM | 2.6% | Sun | +2.7% |
| Argentina | 731 | 6-9 AM | 15.3% | Mon | +1.5% |
| Germany | 713 | 9 PM-12 AM | 5.7% | Sun | +3.0% |
TikTok, the ten largest countries:
| Country | Creators | Best window | Gap | Best day | Weekend lift |
|---|---|---|---|---|---|
| Thailand | 4,880 | 6-9 AM | 5.8% | Sun | +1.6% |
| United States | 3,425 | 6-9 AM | 4.4% | Sun | +2.4% |
| Indonesia | 3,213 | 6-9 AM | 10.8% | Sun | +1.0% |
| Brazil | 3,068 | 12-3 AM | 4.3% | Sat | +2.6% |
| Russia | 2,861 | 6-9 AM | 9.9% | Tue | +1.3% |
| Japan | 2,526 | 6-9 AM | 9.9% | Mon | +0.5% |
| Philippines | 2,486 | 6-9 AM | 11.4% | Sun | +2.8% |
| Mexico | 2,179 | 9 AM-12 PM | 5.0% | Mon | -1.6% |
| Vietnam | 2,031 | 6-9 AM | 4.3% | Sat | +0.8% |
| Pakistan | 1,823 | 6-9 AM | 3.5% | Mon | +0.7% |
The Instagram answer is the same almost everywhere: late evening, and Sunday. France is the exception: its best window is midday, and every window there is within 3%. Thailand, Argentina and Indonesia show the largest gaps, but they also have the fewest creators, so their numbers move most from chance. Country comes from Virev's creator profile. Korean, Japanese and Thai creators without a profile country are placed by the script they write in. US creators are placed in Eastern time, which blurs the US numbers by up to three hours.
By format and category
| Instagram format | Posts | Creators | vs creator's average | Best window | Best day |
|---|---|---|---|---|---|
| Reel | 1,494,103 | 44,515 | +4.7% | 12-3 AM | Sunday |
| Carousel | 736,273 | 41,024 | +1.5% | 12-3 AM | Sunday |
| Single image | 369,900 | 31,045 | -19.4% | 9 PM-12 AM | Sunday |
Reels, carousels and single images all do best on Sunday and late in the evening. The format matters much more than the time: a creator's single image gets 19% less than their average post, and a reel 5% more.
Instagram categories, by creator category from Virev's profile:
| Category | Creators | Best window | Gap | Best day |
|---|---|---|---|---|
| Music | 5,170 | 12-3 AM | 6.0% | Sun |
| Comedy & entertainment | 4,740 | 12-3 AM | 4.2% | Sun |
| Lifestyle | 3,020 | 12-3 AM | 5.4% | Sun |
| Sports | 2,629 | 12-3 AM | 9.3% | Sun |
| Photography & art | 2,464 | 12-3 AM | 6.4% | Sun |
| Food | 2,266 | 12-3 AM | 5.8% | Sun |
| Fitness | 1,674 | 9 PM-12 AM | 2.9% | Sun |
| Beauty | 1,608 | 9 PM-12 AM | 8.1% | Sun |
| Education & business | 1,553 | 12-3 AM | 7.3% | Sun |
| Fashion | 1,452 | 6-9 AM | 8.5% | Sun |
| Travel | 1,378 | 12-3 AM | 12.6% | Sat |
| Parenting & family | 1,031 | 12-3 AM | 7.7% | Sun |
| Dance | 652 | 6-9 PM | 13.9% | Sun |
Every Instagram category but travel does best on Sunday. Most do best after 9 PM. On TikTok, 6 to 9 AM is the best window for 12 of 15 categories. The exceptions are music (midnight to 3 AM), fitness (6 to 9 PM) and pets (midnight to 3 AM).
What matters more than the clock
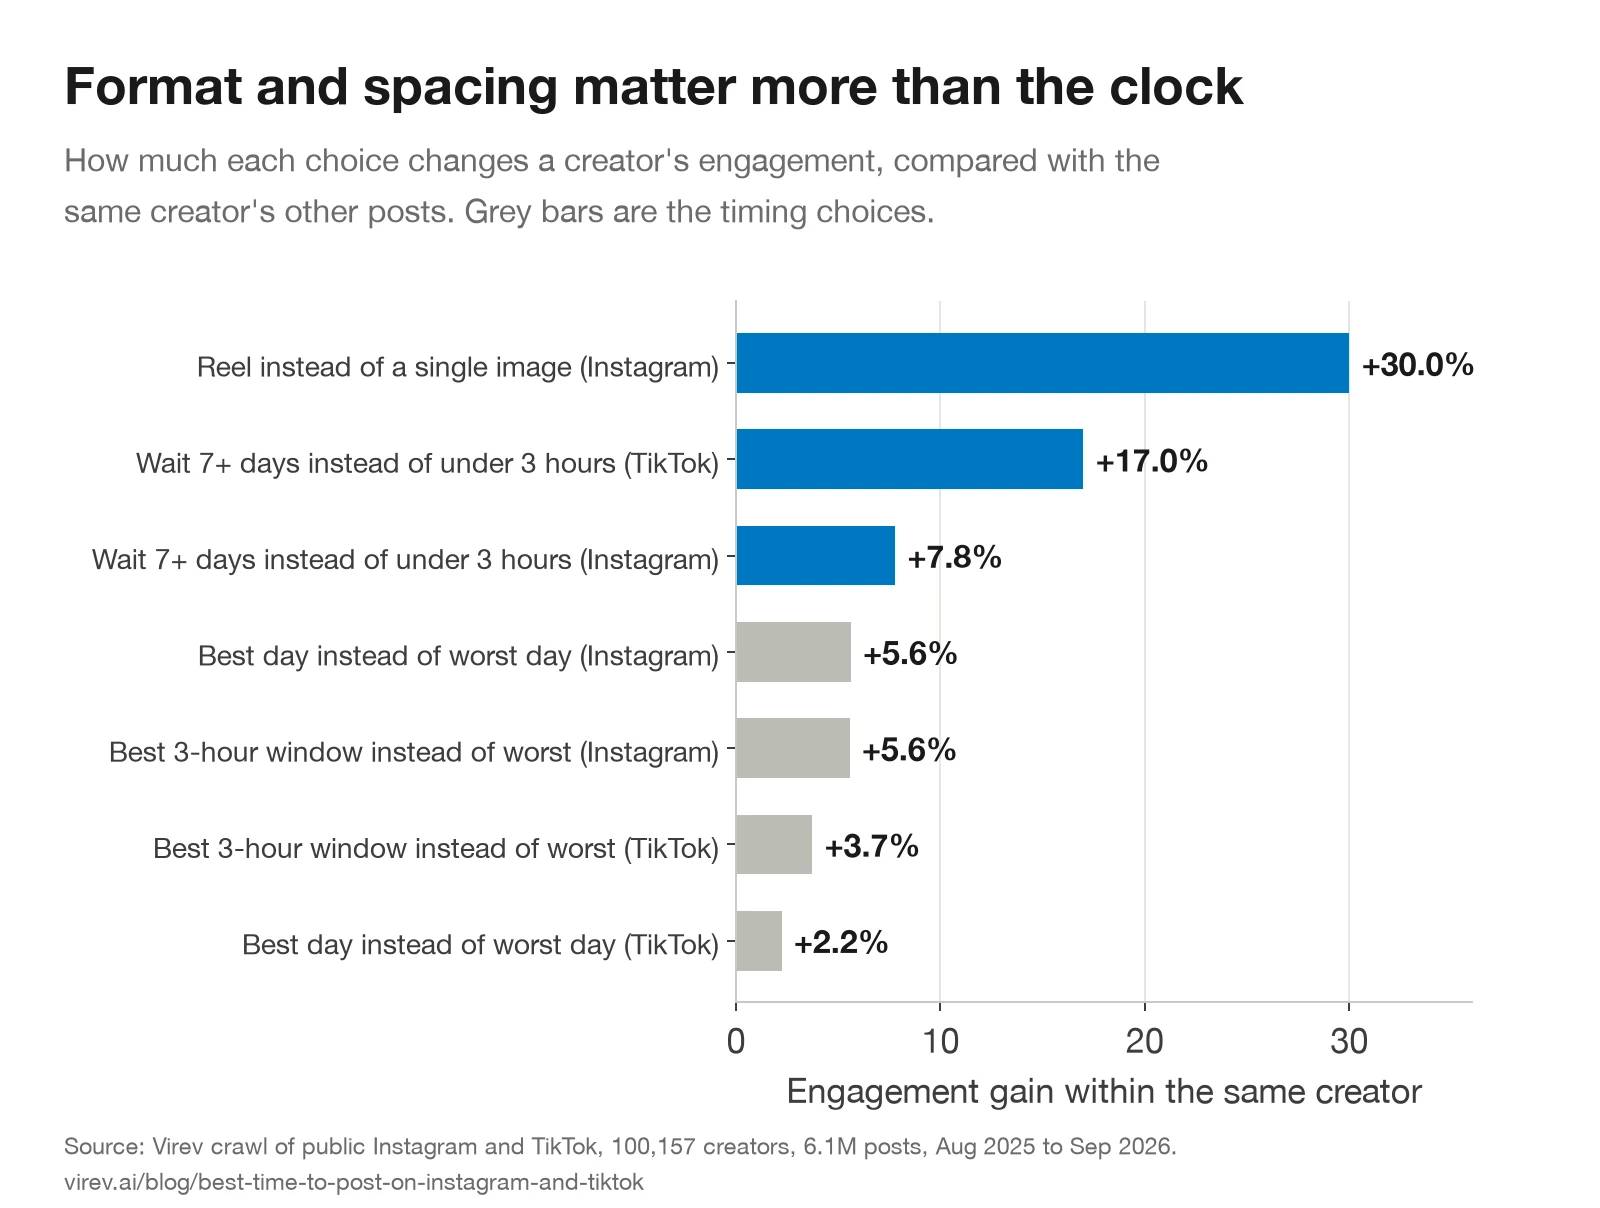
Two choices change a creator's engagement more than the time. The first is the format. On Instagram, a reel gets 30% more than a single image from the same creator. The second is spacing. A post that goes up less than 3 hours after the creator's previous post gets 4.4% under average on Instagram and 6.5% under on TikTok. Posts after a break of a week or more do best, at 3.0% and 9.4% over. Part of that comes from what creators post after a break, such as a comeback or a big project. But two posts in one afternoon split the same audience.
A model that holds format, spacing and the month fixed gives the same answer for the clock: the best Instagram window beats the worst by 7.3%, and Sunday beats Wednesday by 5.8%. On TikTok: 4.4% and 2.4%.
Two creators with opposite results
The averages hide large swings for single creators. We took 13,190 Instagram creators with at least 8 posts at night (9 PM to 3 AM) and 8 by day (9 AM to 3 PM). For each, we compared the typical night post with the typical day post.
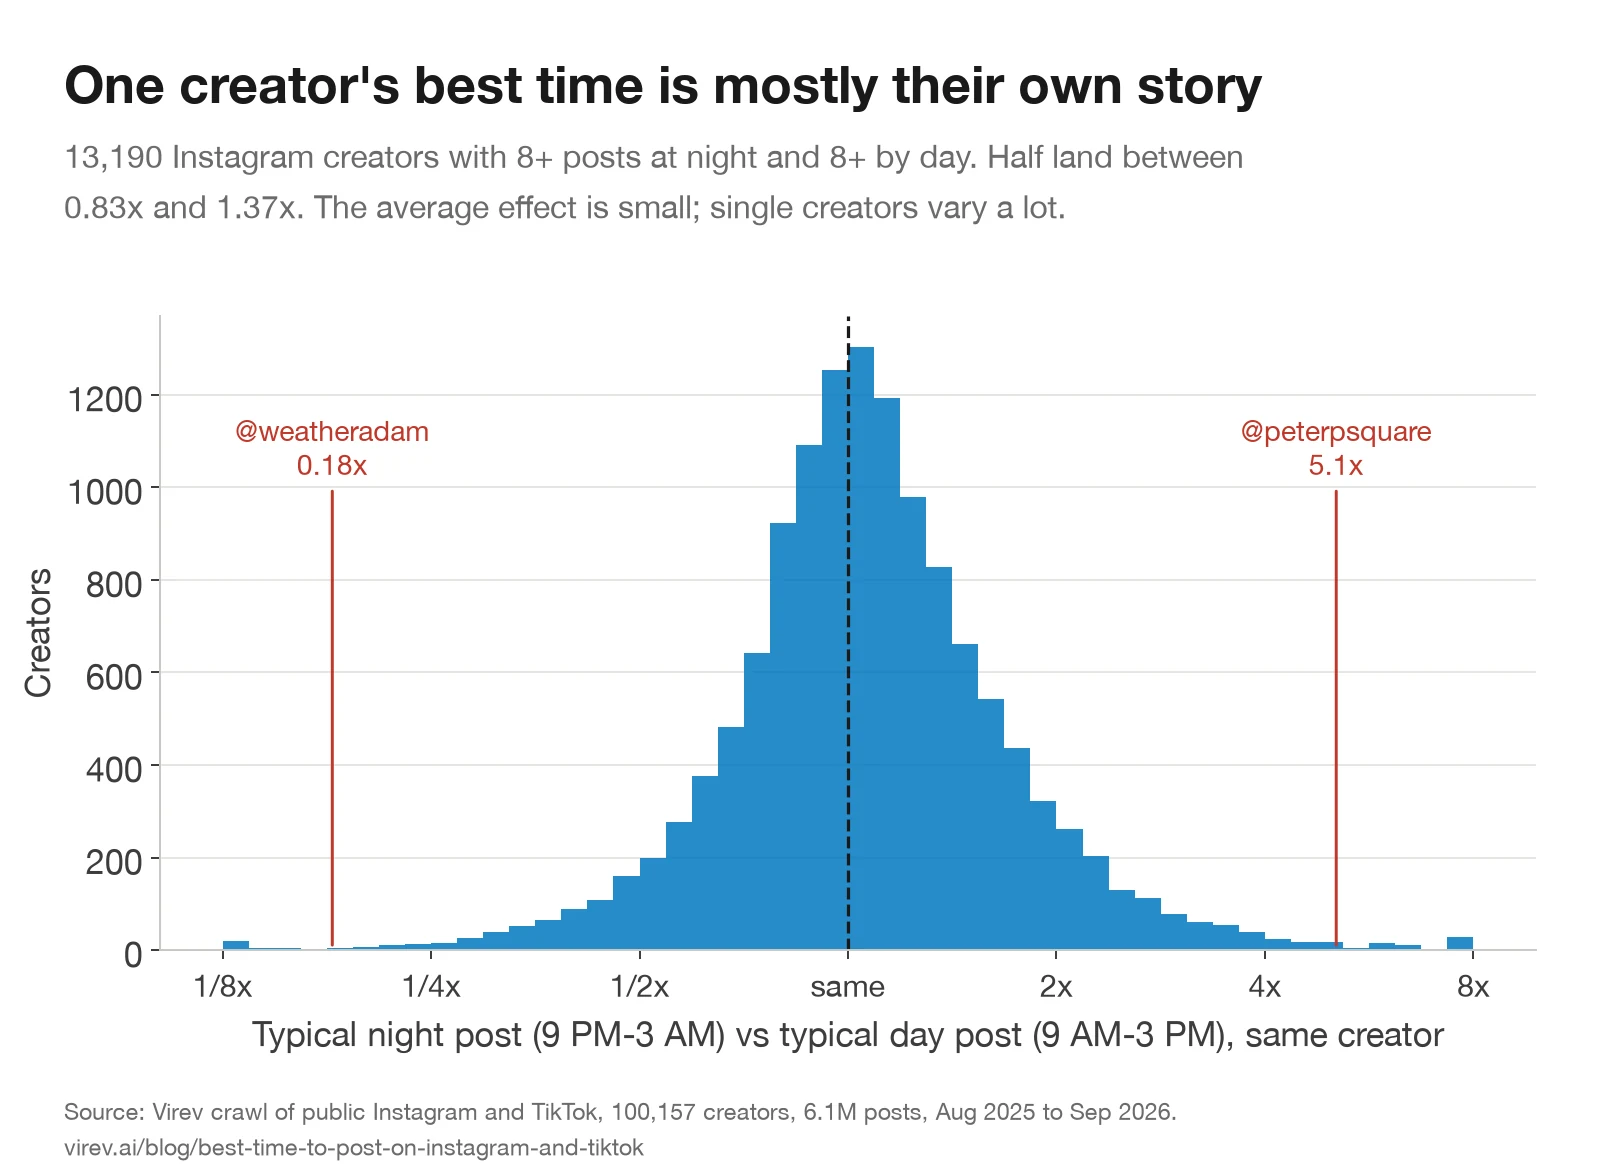
56% of these creators did better at night. Half land between 0.83x and 1.37x. A tenth do worse than 0.63x, and a tenth better than 1.86x. Two of the extremes show why.
Peter Okoye, 5.1x at night. Peter Okoye (@peterpsquare, 12.2 million followers) of P-Square posted 16 times at night between June and August 2026, local time in Lagos. Seven of those were parts of a video series tagged #TheyLied, his side of a public dispute, posted between 9 PM and 1 AM. The last part went up at 3:18 AM and had 526,000 likes and 76,000 comments when we checked it on October 2. His day posts in the same months were tour dates and single announcements. Within the same month, his night posts still beat his day posts: in July by 11 times, in August by more than 2 times. He chose the night for his biggest posts. In summer, 10 PM in Lagos is also 10 PM in London and 5 PM in New York. The clock did not make the series big. He put the series at that hour.
Adam Krueger, 0.18x at night. Adam Krueger (@weatheradam, 2.3 million followers) is a Southern California TV meteorologist. His morning posts, 6 AM to noon Pacific time, are mostly his music parodies of the forecast. "If Radiohead did the weather" went up at 8:50 AM and had 400,000 likes. His evening posts are storm updates and short reactions. Morning posts: median 19,214 likes and comments. Evening posts: median 3,804. His best time is the time he posts his best format.
| Creator | Followers | Median night | Median day | Night vs day |
|---|---|---|---|---|
| @peterpsquare (Nigeria) | 12,247,088 | 198,510 | 22,945 | 5.07x |
| @dr.rawdy (Colombia) | 2,159,017 | 28,221 | 12,622 | 2.50x |
| @goldengracekitchen (United States) | 774,985 | 1,269 | 539 | 2.68x |
| @liliput_farhan (Bangladesh) | 638,099 | 14,217 | 4,300 | 2.81x |
| @weatheradam (United States) | 2,347,793 | 3,804 | 24,958 | 0.18x |
| @nyusha_nyusha (Russia) | 4,840,245 | 8,276 | 16,705 | 0.48x |
| @shabanasfamily (India) | 1,844,469 | 1,414 | 5,155 | 0.30x |
| @denisejvlia (Philippines) | 525,001 | 15,973 | 31,708 | 0.61x |
Likes plus comments. Night is 9 PM to 3 AM and day is 9 AM to 3 PM, local time. Each creator has at least 15 posts in each window. "Night vs day" compares the typical post in each window, so it can differ from the ratio of the two medians. Adam Krueger's row uses Eastern time, like every US creator in the study, so his night window is 6 PM to midnight in Los Angeles.
For any single creator, the content of the post decides far more than its hour. A creator who sees a night or day pattern in their own posts should check which posts went out when before changing the schedule.
What to do with this
For creators
- On Instagram, move some posts to Sunday and to the late evening. Expect a few percent more, not double.
- On TikTok, try 6 to 9 AM. The rest of the day is close to even.
- Choose the format first. On Instagram, a reel over a single image is worth 30%. Our guide to choosing Instagram formats for a creator campaign covers when each fits.
- Space posts at least 3 hours apart, and longer on TikTok.
- Test your own account with your own posts. Compare each post with your median post, not with your best one. Our Instagram engagement rate calculator and TikTok engagement rate calculator give the median-post rate.
For brands
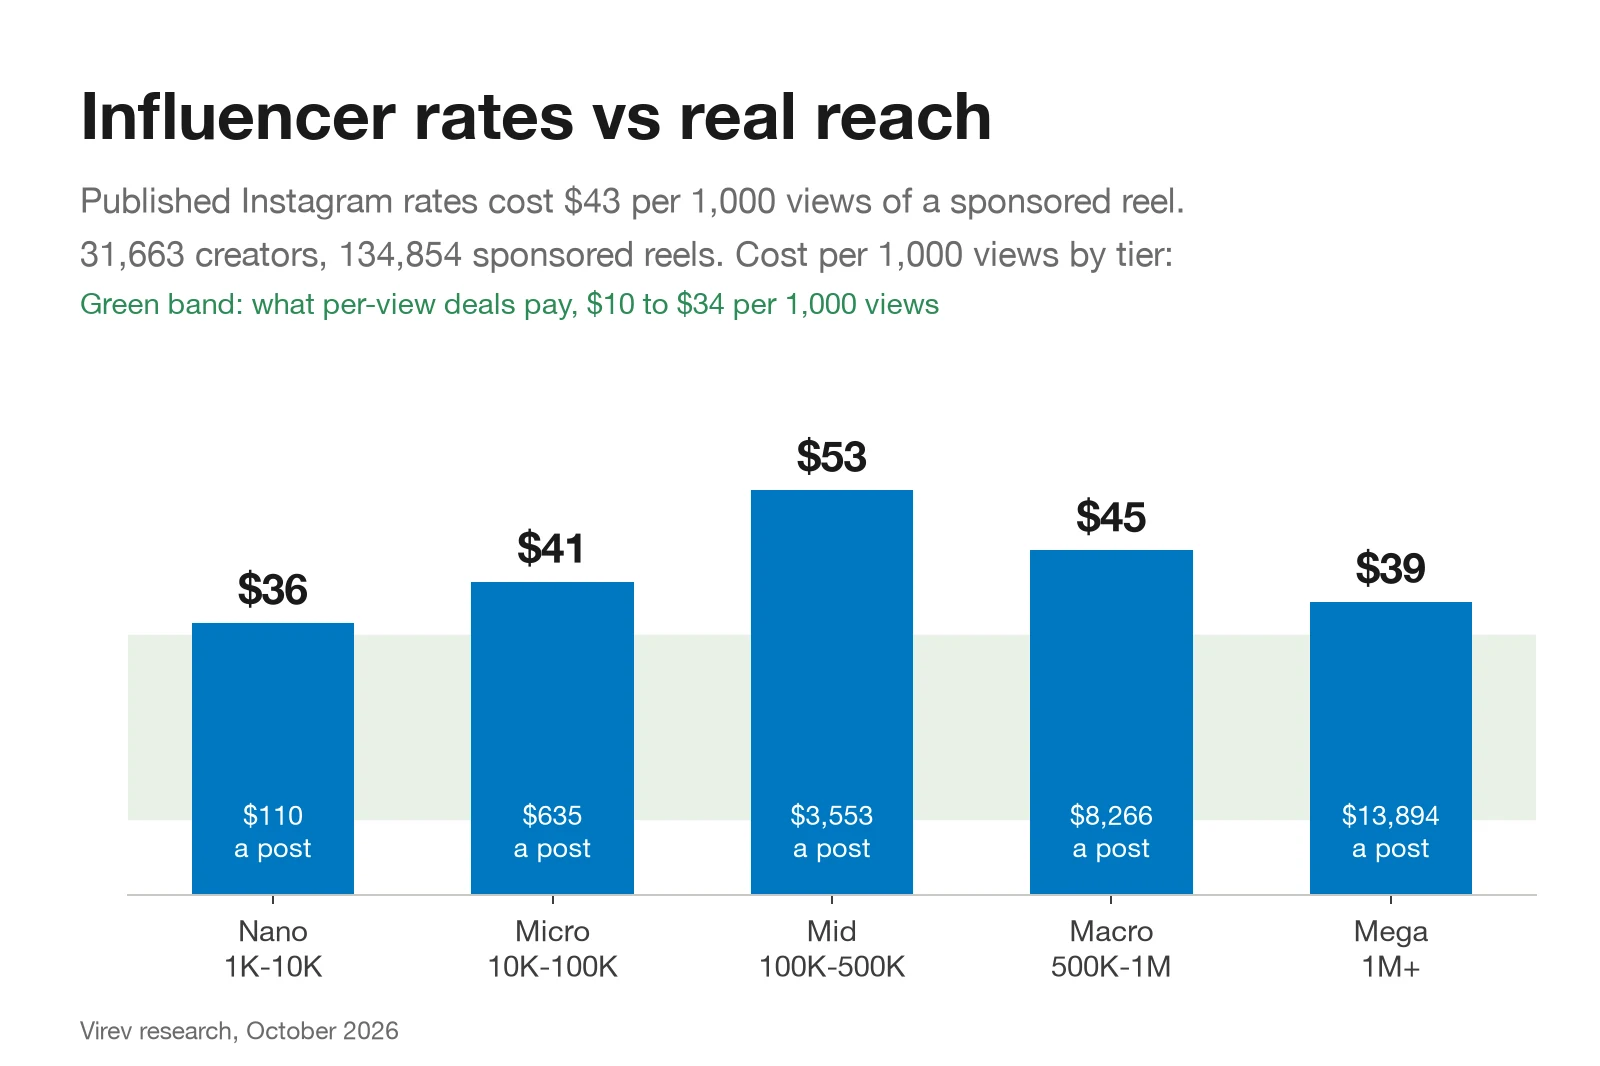
- Do not let a creator's post time decide the price of a deal. A post at the best time gets about 5% more.
- When you compare campaign posts, compare each with the creator's own usual post, not with other creators' rates. The same mistake that makes hours look 50% apart makes creators look further apart than they are. Our note on comparing creators without letting one viral post dominate shows the method.
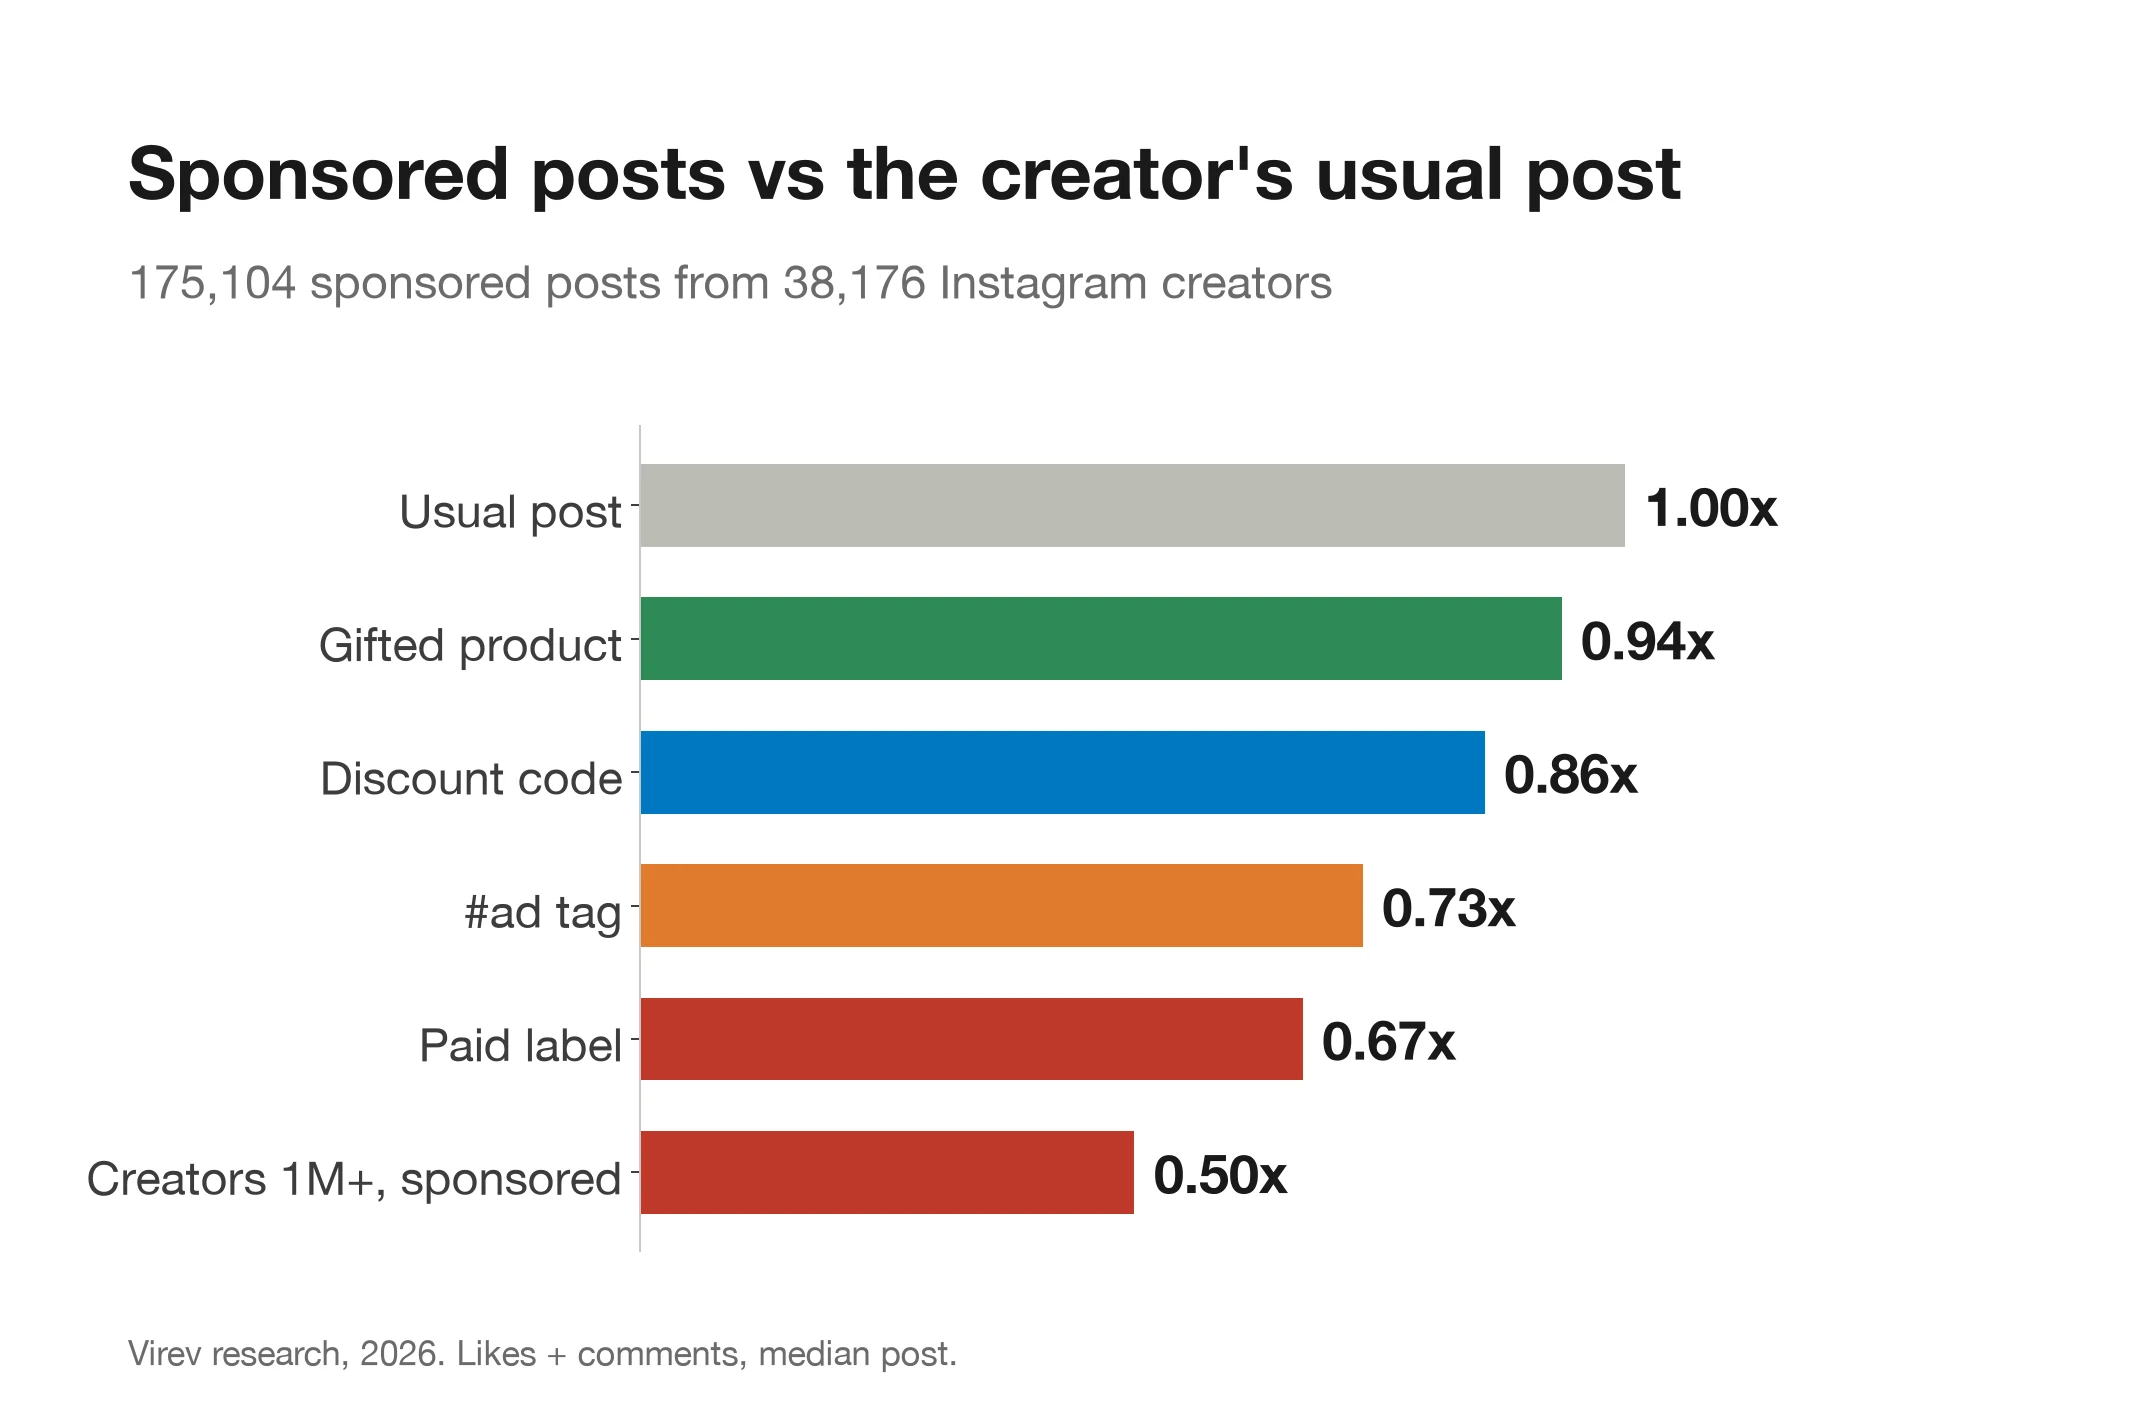
- A sponsored post loses much more than a bad hour: 31% on average, in our sponsored post engagement study.
- Virev creator search shows each creator's recent posts and engagement, so you can see their own pattern before a campaign.
How we measured, and what can be wrong
- Accounts: public Instagram and TikTok accounts with 1,000+ followers read by Virev's crawler between June and October 2026. We removed brands, media, businesses and organizations by Virev's profile label or Instagram category.
- Posts: Instagram feed posts and reels, not pinned, with likes visible, at least 3 days old at the read and posted within a year before it. TikTok videos with the same age rules. We removed posts with Instagram's paid partnership label, TikTok posts with ad tags, and giveaways, because they follow other rules. Each creator needed at least 10 posts.
- Local time: from the creator's country in Virev's profile (39,799 Instagram and 47,687 TikTok creators), or from the script of their captions for Korean, Japanese and Thai creators without a country (7,040 and 5,631). Countries with several time zones use the main one: Eastern for the United States and Canada, Sydney for Australia, Sao Paulo for Brazil, Mexico City for Mexico, Jakarta for Indonesia, Moscow for Russia. Daylight saving is applied.
- Hand check: we read the bio and recent captions of 100 random Instagram and 60 random TikTok creators. The first pass found one Indonesian account filed as Japanese because of the hashtag #fypシ, which contains a Japanese character. We changed the rule to require Japanese hiragana in at least half of the captions, which removed 8,240 accounts, most of them on TikTok. Of the 159 creators left, 140 (88%) have the right local clock within one hour. One was in another country, 7 were in the western US or Canada (2 to 3 hours off), 7 were US creators whose city we could not find, and 4 had too little text to tell.
- Round-the-clock accounts: we dropped 2,368 creators who put more than a third of their posts between 1 and 6 AM local time. Most of these run on a wrong time zone or a scheduler that posts all day.
- Measure: for each post, the log of likes plus comments (plus shares on TikTok) minus the creator's average log. We report the average for each group as a percentage over or under the creator's average post. Results are the same if each creator counts once, and if each post is compared only with the same creator's posts in the same month. The month check rules out creators who changed both their schedule and their size during the year.
- Final counts: we read engagement at least 3 days after posting. A post may get its first likes faster at one hour than another and still end up with the same total. This study measures the total.
- Choice: creators choose when to post, and they may save their best posts for certain times, as Peter Okoye did. This is an observational study. It shows what posts at each time got, not what moving one post would do.
- Precision: with over a million posts per platform, the standard error of each 3-hour window is 0.1 to 0.9 percentage points. Gaps of 1% between windows in large groups are real, but small. Small countries and categories move more by chance.
For engagement rates by follower tier, see our Instagram engagement rate benchmarks and TikTok engagement rate benchmarks.
Download the data
The aggregate tables behind every chart are in one CSV: best-time-to-post-2026.csv. It has the result for each local hour, 3-hour window, weekday and weekday-by-window slot on both platforms, plus each tier, country, category and format by window and by day, with post counts, creator counts, the pooled engagement rate index and the model estimates. Please cite "Virev, October 2026" and link this page.
Sources
- When Is the Best Time to Post on Instagram
- The best time to post on Instagram [2026 data]
- Best times to post on Instagram in 2026
- The Best Time to Post on TikTok in 2026
- Best Times to Post on TikTok in 2026
- Best Time to Post on TikTok in 2026
- PART 8b. The chapter ends here. #TheyLied
- If Radiohead did the weather