



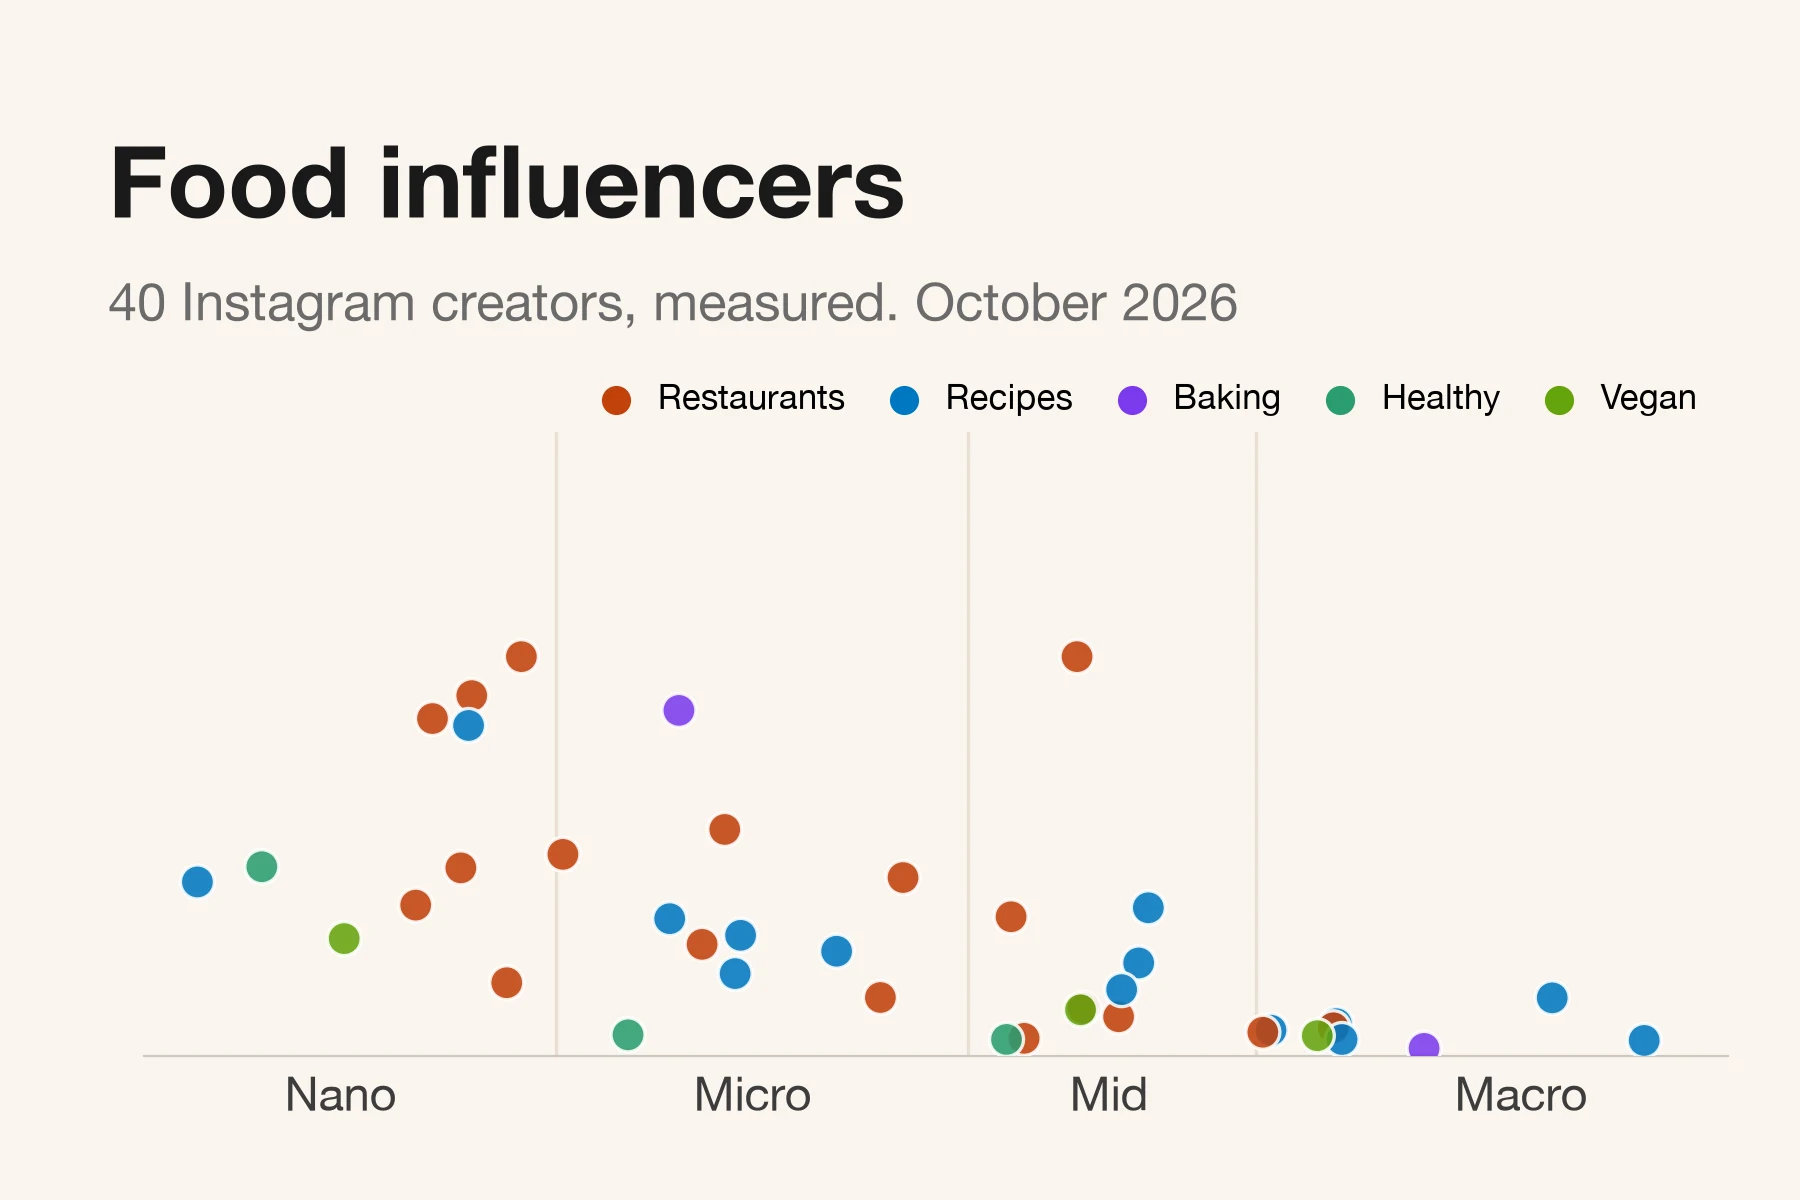
This is a list of 40 food influencers on Instagram, grouped by size, with numbers we measured ourselves. For each one you get the follower count, the engagement rate of their typical post, how often they post, one recent post and a note on which brands they suit. We picked them from 3,077 food creators that Virev's crawler read between August 22 and September 30, 2026, and opened every profile by hand on October 6.
The pages that rank for "food influencers" are lists of famous names and database exports. Amra and Elma's top 100 starts with Gordon Ramsay. The Social Shepherd's top 35 groups creators by vegan, chef and recipes, with follower counts and no engagement numbers. Influencer Hero's top 120 shows an engagement rate per account but no date and no word on how it was counted. None of them says what happens to a food creator's numbers on a paid post. This list has 21 creators under 100,000 followers, splits food into restaurants, recipes, baking, healthy and vegan, names 9 New York creators, and measures 5,714 real sponsored food posts.
3,077
Food creators measured
40
Creators on this list
0.75x
Sponsored post response
How to read the numbers
- Typical ER is likes plus comments on the creator's median post, divided by followers. We use the median post because one viral Reel can lift an average far above what a sponsored post will get.
- Posts/wk is the pace across the 9 most recent posts on their Instagram grid, read on October 6.
- Recent post, likes links to one recent food post, with the date and the likes we read on Instagram on October 6. Instagram rounds counts above 10,000.
- Followers come from Virev's last read of each account, between August 22 and September 30, 2026. Five accounts have grown a lot since; the notes say which.
- Watch the comments. 381 food creators in our set ask people to "comment RECIPE" to get a link by direct message. On those posts, comments are 17% of all likes and comments, against 4% on other posts. A high comment count on a recipe account often means an automated reply, not a conversation.
To check a food account that is not on this list, paste the handle into the Instagram engagement rate calculator. It shows the average and the median-post rate side by side. For TikTok creators, use the TikTok engagement rate calculator.
For context, the median food creator's typical post ER is 2.42% for nano, 0.92% for micro, 0.57% for mid and 0.46% for macro accounts. 38 of the 40 creators below beat the median of their tier.
Nano food influencers (1,000 to 10,000 followers)
| Creator | Followers | Typical ER | Posts/wk | Recent post, likes |
|---|---|---|---|---|
| Leeza D.S. | 8,244 | 21.57% | 1.4 | Aug 26: 1,925 |
| MartEats | 6,247 | 14.44% | 4.0 | Jul 23: 889 |
| Mandy | 5,015 | 13.52% | 1.1 | Aug 6: 617 |
| Sarah Foley | 5,877 | 7.54% | 0.9 | Jul 11: 437 |
| Julia Mao | 7,595 | 2.94% | 4.3 | Sep 4: 191 |
| Jen | 4,566 | 6.04% | 1.5 | Jul 24: 290 |
| Let's Whip It Up | 6,136 | 13.24% | 1.0 | Aug 5: 780 |
| Texas BBQ Professor | 1,348 | 6.97% | 3.5 | Aug 27: 123 |
| Madison | 3,062 | 4.70% | 6.7 | Aug 29: 153 |
| Maddie Jerew | 1,932 | 7.58% | 1.3 | Sep 3: 165 |
- Leeza D.S. (@leezainfl), Orlando. Things to do and eat around Orlando, with brunch spots and the full street address in each caption. Her typical post, 21.57%, is the highest in the nano tier. Fits Orlando restaurants, attractions and local events.
- MartEats (@marteats_), Minnesota. A realtor who reviews Minnesota food four times a week, with 27K followers on TikTok. His #ad post for the Mo' Bettahs opening in Burnsville got 2.25 times his usual response. Fits restaurant openings and food festivals in the Twin Cities.
- Mandy (@mandy.munchies), Bay Area. Yelp Elite, covering soft openings in Cupertino and Sunnyvale, matcha bars and milk tea. Her Gozen Kamicha post got 74 comments on 617 likes. Fits Bay Area cafe and dessert openings.
- Sarah Foley (@sarahhheats), New York. NYC restaurant posts that open with the place and neighborhood, such as Balade in the East Village. Fits NYC restaurants and rooftop venues.
- Julia Mao (@maochows), New York. Koreatown, brunch and Asian restaurants, plus food travel. Her one labeled post this year, for Good Hour Matcha, got 0.73 times her usual response. Fits NYC restaurants and drink brands.
- Jen (@jendafoodie), New York. Omakase, milk tea and cocktail lounges, one or two posts a week, with a media agency named in her bio. Fits Asian restaurants and dessert shops in NYC.
- Let's Whip It Up (@letswhipitup), US. Two hosts, Danielle McPartlin and Kristin Kay, test viral recipes such as a ground-chicken pizza crust with 50 g of protein. They post about once a week. Fits kitchen tools and high-protein food.
- Texas BBQ Professor (@txbbqprofessor), Texas. One "must order" item per barbecue joint, such as the Sloppy Juan at Zavala's. One viral post lifts his average to 41.72%; his typical post is 6.97%. He had 1,728 followers on October 6. Fits Texas barbecue joints and smoker brands.
- Madison (@devourplantbased), Chicago. Small vegan businesses around Chicago, down to which ice cream toppings are vegan, plus UGC work. Fits vegan products and Chicago shops.
- Maddie Jerew (@nourishingmaddie), Australia. Protein snacks and food memes for runners and gym-goers, training for the Melbourne Marathon, with a Macro Mike code in her bio. Fits protein snacks and sports nutrition in Australia.
Micro food influencers (10,000 to 100,000 followers)
| Creator | Followers | Typical ER | Posts/wk | Recent post, likes |
|---|---|---|---|---|
| Rachy Eats | 25,691 | 9.08% | 4.3 | Jul 13: 3,130 |
| Did You Eat Yet? | 10,398 | 8.08% | 0.8 | Jul 14: 608 |
| Joratty | 69,587 | 7.15% | 1.4 | Aug 5: 3,806 |
| Lauren Scala | 61,319 | 2.34% | 1.1 | Sep 1: 1,090 |
| Calvin Eng | 22,636 | 4.47% | 0.4 | Aug 11: 1,419 |
| James Rubio | 18,886 | 5.50% | 5.4 | Jul 28: 926 |
| Zainab | 28,067 | 4.83% | 0.6 | Jul 20: 1,166 |
| Lindsay | 48,009 | 4.20% | 3.6 | Aug 27: 1,905 |
| Brigie | 27,229 | 3.30% | 3.0 | Aug 23: 820 |
| Emma Harrison | 19,883 | 13.85% | 3.0 | Aug 15: 1,481 |
| Katie | 14,961 | 0.85% | 3.1 | Aug 5: 108 |
- Rachy Eats (@rachyeatsdmv), Washington DC area. Restaurant openings and food trucks across the DMV, about four posts a week, with 76K on TikTok and a talent manager in her bio. Fits DC-area restaurant openings.
- Did You Eat Yet? (@jeet_yet_chi), Chicago. Chicago food events and destination dining. His post on the Windy City Smokeout got 262 comments on 608 likes. Fits Chicago food festivals and restaurants.
- Joratty (@jorattyy), New York. Selfie-style reactions to cheap and viral food across the Bronx, Washington Heights and Staten Island, such as $10 steak, fries and rice. Typical post 7.15% at 69,587 followers. Fits fast food and casual chains that want humor.
- Lauren Scala (@laurenscala), New York. TV host and restaurant reporter for NBC New York with four Emmys. Her recent posts cover Tokyo-style pizza, a cheese conveyor belt and food at the US Open. Fits NYC restaurant openings and food events.
- Calvin Eng (@calvinhungry), Brooklyn. His bio points to Bonnie's, his Cantonese restaurant in Brooklyn, and to his Salt Sugar MSG cookbook. He posts about once every two weeks; his one labeled post this year got 2.09 times his usual. Fits Cantonese pantry brands and cookware.
- James Rubio (@jamesrubio808), Big Island, Hawaii. Outdoor cooking and a "Will It Lumpia?" series that wraps fillings like mango sticky rice in lumpia. Fits outdoor cooking gear and Hawaii food brands.
- Zainab (@recipes.by_zainab), Chicago. Faceless Hyderabadi and Indian recipe Reels with the full method in the caption. Fits spices, rice and South Asian grocery brands.
- Lindsay (@momsdinnerbell), Metro Detroit. Armenian family recipes, with "comment RECIPE" prompts that drive her comment count. Her three labeled posts this year got 0.20 to 1.84 times her usual; the Karoun Dairies post did best. Fits dairy and Mediterranean grocery brands.
- Brigie (@boujeetexasbbq), Texas. Brisket, beef ribs and smoker cooking, and an Oklahoma Joe's ambassador. Her bio says paid collabs only. Fits meat suppliers and barbecue sauces; a smoker would compete with her sponsor.
- Emma Harrison (@_emmasplate), US. Comfort-food recipes and baking that send people to her recipe blog. One post lifts her average to 111%; her typical post is 13.85%. Followers grew from 19,883 at our read to 24K on October 6. Fits pantry and bakeware brands.
- Katie (@wholesomefoodbykatie), Ottawa. Healthy recipes and party food. One post lifts her average to 21.30%. Her 15 labeled posts this year, for brands such as Avocados From Mexico, Butterball, Taco Bell Canada and Samsung, got a median of 0.98 times her usual response, the best record on this list among creators with five or more labeled posts. Her typical post, 0.85%, sits under the micro food median of 0.92%. Fits Canadian grocery brands.
Mid-tier food influencers (100,000 to 500,000 followers)
| Creator | Followers | Typical ER | Posts/wk | Recent post, likes |
|---|---|---|---|---|
| Yan Saderi | 184,044 | 22.88% | 1.6 | Jul 12: 43K |
| Bianca | 232,175 | 1.57% | 2.9 | Jul 2: 3,524 |
| Mike Chau | 136,929 | 0.71% | 9.3 | Aug 22: 999 |
| dcfoodgod | 127,308 | 5.58% | 0.8 | Jul 31: 7,788 |
| Anton Clark | 190,324 | 1.91% | 0.9 | Aug 14: 3,730 |
| Theo Randall | 259,768 | 3.73% | 2.8 | Jul 1: 9,329 |
| Chef Pop's | 236,159 | 2.66% | 7.1 | Aug 15: 7,001 |
| Kimberly Cauti | 124,082 | 0.66% | 4.0 | Jul 6: 342 |
| Minaëlle's Kitchen | 187,674 | 1.85% | 1.3 | Aug 11: 2,209 |
| Saucy Marco | 274,139 | 5.94% | 5.5 | Jun 17: 16K |
- Yan Saderi (@thesauceboss_), New York and travel. Street food in New York and abroad, such as BBQ off a shopping cart and kebab in Turkey. His typical post gets about 42,000 likes and comments, 22.88% of 184,044 followers. He had 221K on October 6 and has posted only 89 times in total. Fits NYC restaurants and snack brands that want reach.
- Bianca (@biancafrombrooklyn), Brooklyn. Italian-American home cooking, sandwiches and pizza reviews, about three posts a week. Fits Italian food brands and NYC pizzerias.
- Mike Chau (@mikejchau), New York. Posts with @foodbabyny and @alexlchau, with more than 15,000 posts and about nine a week. His typical post is 0.71%, about 970 likes and comments. Fits openings and pop-ups that want same-day coverage.
- dcfoodgod (@dcfoodgod), Washington DC. A couple of native Washingtonians covering DC restaurants and Maryland getaways such as St. Michaels. Typical post 5.58%. Fits DC restaurants and Maryland and Virginia travel.
- Anton Clark (@aton_of_food), London. Street food and a "UK's best burgers" series. His three labeled posts this year, for LNER, a pub stay and VisitScotland, got 0.54 to 3.86 times his usual; the travel posts did best. Fits UK restaurants and travel brands.
- Theo Randall (@theo.randall), London. Chef patron of Theo Randall Cucina Italiana and author of The Italian Table. Regional Italian cooking, about three posts a week. Fits Italian ingredients and cookware.
- Chef Pop's (@heyitschefpops), Los Angeles. Mexican home cooking, seen on Food Network and HBO Max's 100 Cooks. He posts about seven times a week; his one labeled post this year, for Northgate Market, got 1.94 times his usual. Fits Mexican grocery brands.
- Kimberly Cauti (@prettydeliciouslife), US. Gluten-free, high-protein recipes and her own cookbook. Her July 6 post had 486 comments on 342 likes, from a comment prompt. Her 14 labeled posts this year, for Trumoo, Garelick Farms and True Eats Baking among others, got a median of 0.37 times her usual. Fits gluten-free and high-protein brands; price on the 0.37x figure.
- Minaëlle's Kitchen (@minaelleskitchen.ca), Canada. Plant-based recipes and an ebook. Her "comment hungry" post got 1,774 comments on 2,209 likes. Followers grew from 187,674 to 213K. Fits plant-based food brands.
- Saucy Marco (@saucymarco25), Los Angeles. Budget Mexican family meals, five posts a week. His nine labeled posts this year got a median of 0.41 times his usual; his two Knorr posts got 0.36 and 1.53. Followers grew from 274,139 to 315K. Fits grocery and pantry brands with a budget message.
Macro food influencers (500,000+ followers)
| Creator | Followers | Typical ER | Posts/wk | Recent post, likes |
|---|---|---|---|---|
| Crowded Kitchen | 2,620,587 | 2.33% | 2.5 | Jul 1: 93K |
| Ree Drummond | 4,382,465 | 0.62% | 1.8 | Jun 26: 28K |
| Kristen Kish | 784,102 | 1.29% | 2.2 | Jul 17: 10K |
| Wei | 544,141 | 1.03% | 2.8 | Aug 27: 8,832 |
| Clement Leung | 771,089 | 1.13% | 1.7 | Aug 24: 11K |
| Grubwitmike | 519,907 | 0.95% | 2.7 | Aug 13: 4,885 |
| Dave's Pizza Oven | 809,467 | 0.66% | 3.1 | Aug 11: 5,308 |
| Connie Homayed Kazan | 1,280,456 | 0.31% | 9.2 | Aug 17: 4,357 |
| Bai Ruskus | 704,896 | 0.81% | 5.6 | Jul 19: 4,531 |
- Crowded Kitchen (@crowded_kitchen), US. Mother and daughter Lexi Harrison and Beth Sinclair, with a cookbook and a "Better Than Store-Bought" series; their homemade Choco Taco post had 93K likes. Their six labeled posts this year, for Shamrock Farms, J.Jill, Zwilling and Fresh Thyme, got a median of 0.32 times their usual. Fits kitchen and grocery brands, priced on the lower figure.
- Ree Drummond (@thepioneerwoman), Oklahoma. Cooking show host, cookbook writer and dish designer. Her Instagram is mostly family and ranch life now; recent posts also sell her clothing line on QVC. Her typical post still gets about 27,000 likes and comments. For a recipe placement, her show and cookbooks carry the food.
- Kristen Kish (@kristenlkish), US. Host of Top Chef and a cookbook author. About two posts a week. Her two labeled posts in June, for Postmates, got 0.12 and 0.14 times her usual. Fits one-off brand moments, not a series.
- Wei (@omaweii), Los Angeles. An omakase sushi chef who says he has no restaurant of his own and does not want to be tied to one location. Short videos of his knife work and fish. Typical post 1.03% on 544,141 followers. Fits knives, seafood suppliers and premium Japanese ingredients.
- Clement Leung (@insta.noodls), Toronto. A full-time food creator covering Chinese restaurants and food crawls around Toronto. His two labeled posts in August, for Kraft Dinner and Toronto Pearson airport, got 0.04 and 0.31 times his usual. Fits Toronto restaurants and food crawls more than packaged products.
- Grubwitmike (@grubwitmike), Bay Area. Restaurant posts with the dish, the restaurant and its street address in capital letters. His 10 labeled restaurant visits this year got 0.24 to 0.84 times his usual, median 0.63. Fits Bay Area restaurants.
- Dave's Pizza Oven (@davespizzaoven), Dallas. "A normal guy making pizza at home", with dough, ovens and pizza sandwiches; he also ran a pop-up for Slice Out Hunger. About three posts a week. Fits pizza ovens, flour and tomato brands.
- Connie Homayed Kazan (@connies_sweetest_things), Michigan. Baking, recipes and visits to bakeries and cookie shops, about nine posts a week. Her typical post, 0.31%, is under the macro food median, but that is still about 4,000 likes and comments. Fits baking ingredients and bakeware.
- Bai Ruskus (@chef_bai), San Diego. Plant-based recipes, author of Breaking Up With Dairy, with content on endometriosis and hormone health. Her seven labeled posts this year, for Silk, iHerb and Found among others, got a median of 0.31 times her usual. Fits plant-based food that suits a health message.
NYC food influencers, and food creators by city
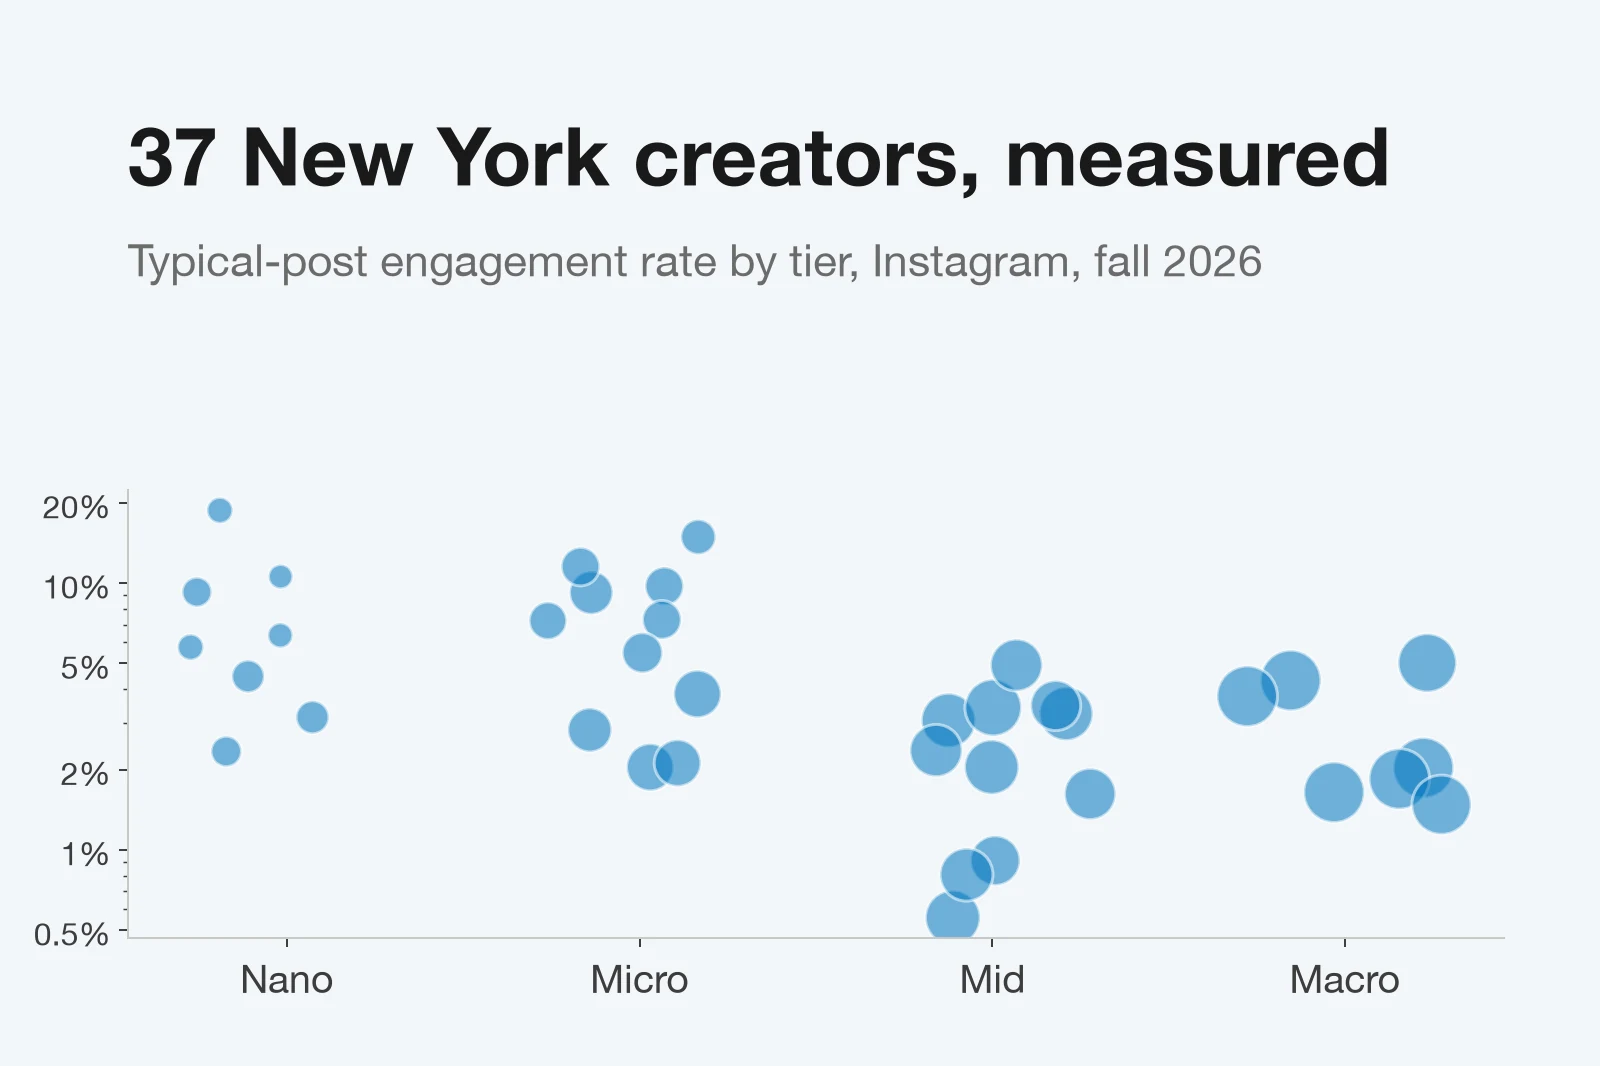
Nine creators on this list are based in New York:
- Nano: Sarah Foley, Julia Mao and Jen, all NYC restaurant posts with the place named first.
- Micro: Joratty for cheap eats in the Bronx and uptown, Lauren Scala for restaurant news on NBC New York, and chef Calvin Eng in Brooklyn.
- Mid-tier: Yan Saderi, Bianca and Mike Chau.
Virev's creator profiles do not store a city, so we read the location from each creator's bio, tagline and content summary. 121 food creators name New York, NYC, Brooklyn, Manhattan or Queens; that count includes some Long Island and upstate accounts. The table shows every city with 25 or more food creators.
| City | Creators | ER, under 100K | Paid label | Sponsored |
|---|---|---|---|---|
| New York | 121 | 1.47% | 18% | 0.91x (177) |
| Toronto | 62 | 1.68% | 27% | 0.73x (116) |
| Los Angeles | 58 | 1.41% | 38% | 0.87x (200) |
| San Francisco Bay Area | 47 | 1.12% | 30% | 0.62x (98) |
| Chicago | 41 | 1.47% | 15% | 1.13x (83) |
| London | 41 | 1.41% | 15% | 0.80x (58) |
| Houston | 31 | 1.47% | 42% | 0.70x (104) |
| Dallas | 28 | 1.26% | 32% | 0.77x (93) |
| Miami | 27 | 1.64% | 11% | 0.61x (36) |
| All food creators | 3,077 | 1.38% | 17% | 0.75x (5,714) |
ER, under 100K: median typical-post rate of the city's creators under 100,000 followers. Paid label: share with Instagram's paid partnership label in their last 12 posts. Sponsored: median sponsored post against the creator's usual post, with the number of posts in brackets.
- New York food creators hold up on paid posts. Their 177 sponsored posts got a median of 0.91 times the usual response, against 0.75 for all food creators. 56% of those posts come from restaurant creators.
- Houston and Los Angeles creators run the most paid deals. 42% of Houston and 38% of Los Angeles food creators had a paid label in their last 12 posts, against 17% of all food creators.
- The samples are small. 27 to 121 creators per city. Treat the city rows as a guide, not a ranking.
Food creators against all creators
We compared the 3,077 food creators with the 53,934 individual creators in our Instagram engagement rate benchmarks. Both groups use the same rule: likes plus comments, averaged over the 12 most recent posts, divided by followers.
| Followers | Food creators | Food median ER | All creators median ER |
|---|---|---|---|
| 1K to 10K | 950 | 3.50% | 5.09% |
| 10K to 100K | 1,290 | 1.66% | 2.45% |
| 100K to 500K | 657 | 1.03% | 1.49% |
| 500K+ | 180 | 0.71% | 0.92% |
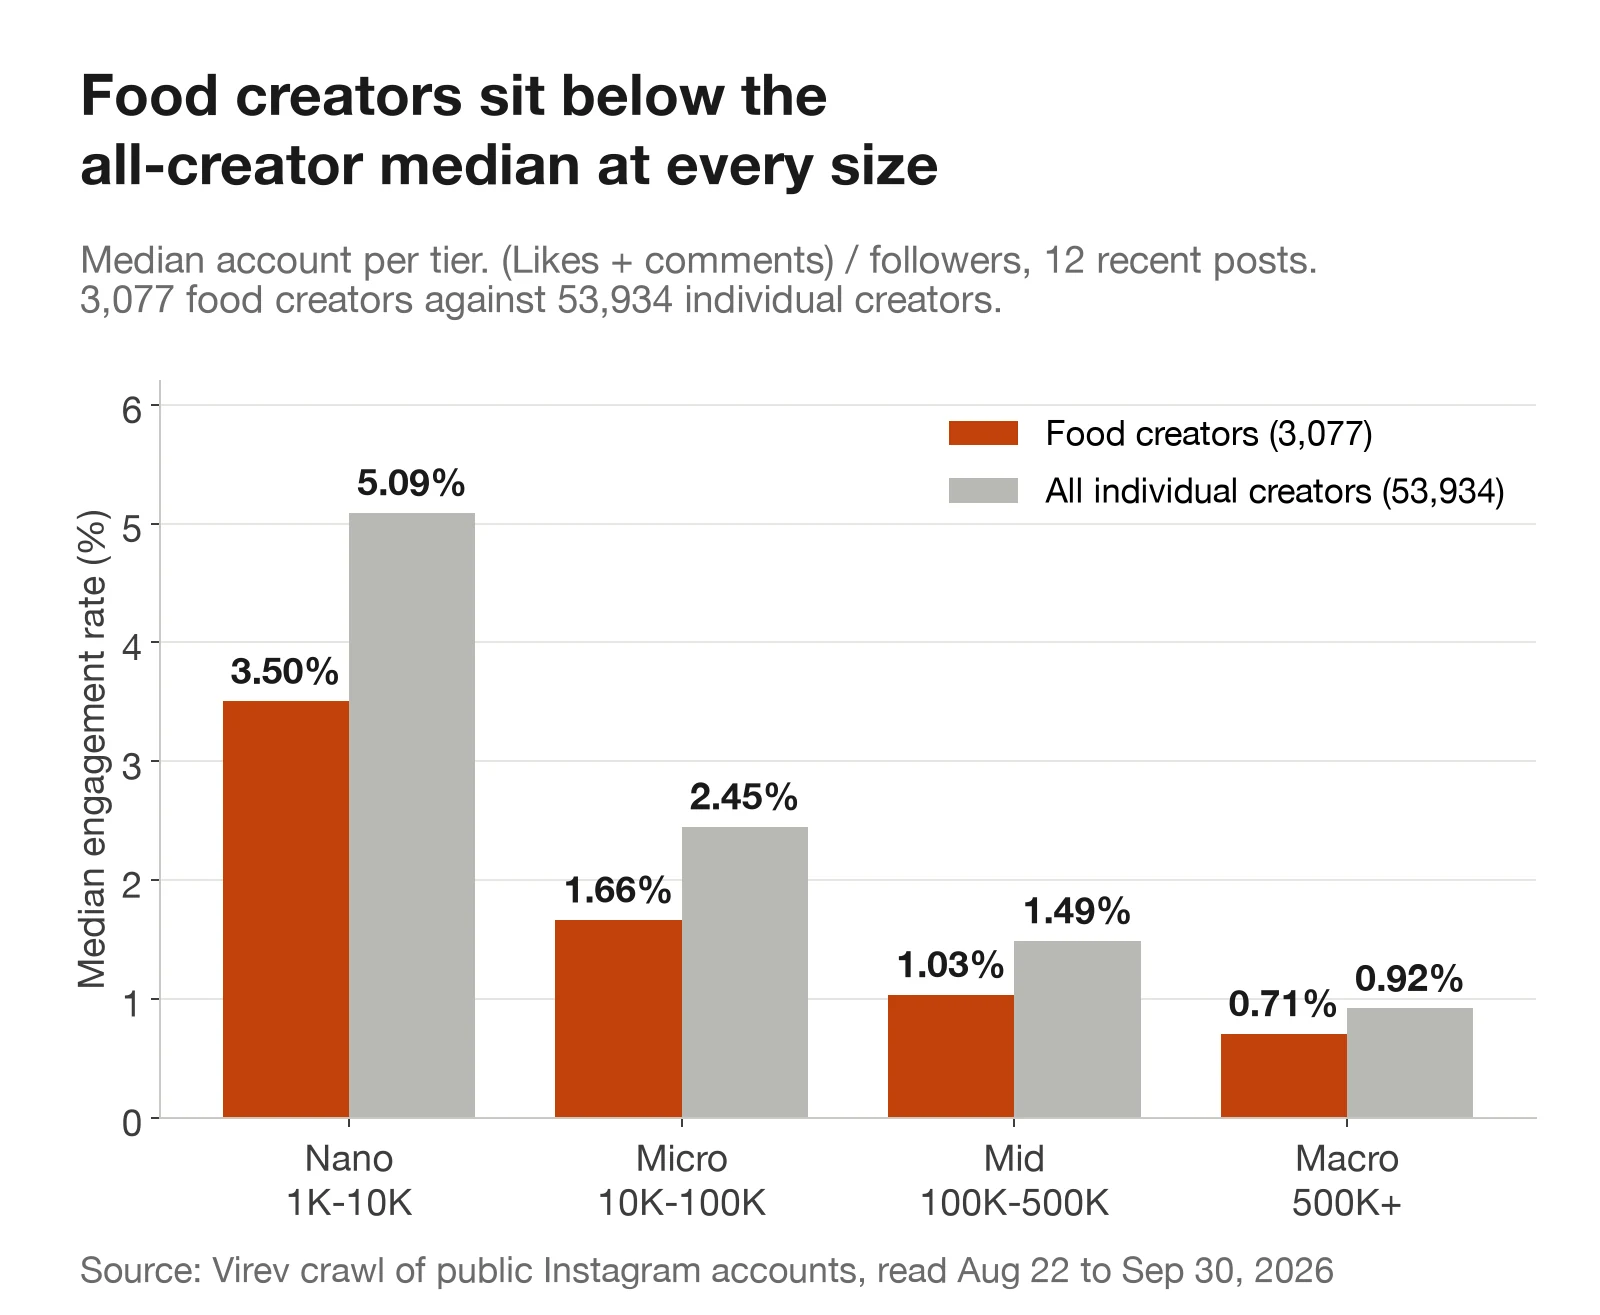
Food creators sit below the field at every size, by 0.2 to 1.6 points. The gap is widest for nano accounts: 3.50% against 5.09%. For comparison, fitness creators sit only 0.06 to 0.23 points below the field, measured the same way in our fitness influencers list.
Two more differences matter when you plan a campaign:
- They post more. Nano food creators post 1.7 times a week against 1.2 for all creators, and mid-tier creators 2.3 against 2.0.
- They are paid far more often. 17.4% of food creators had Instagram's paid partnership label in their last 12 posts, against 6.6% of all creators. Above 100,000 followers it is more than 1 in 5. 1,144 of the 3,066 food creators with enough posts, 37%, ran at least one sponsored post this year. A food creator's feed is often already full of restaurant and grocery deals, so check it before you send an offer.
Restaurants, recipes, baking, healthy and vegan
Each creator's Virev profile names a main niche, such as "Food and dining", "Food and cooking" or "Vegan food and recipes". We grouped them into five sub-niches, plus a mixed food and lifestyle group.
| Sub-niche | Creators | Nano ER | Micro ER | Paid label | Sponsored |
|---|---|---|---|---|---|
| Restaurants and local food | 1,472 | 3.52% | 1.70% | 16.4% | 0.83x |
| Recipes and home cooking | 1,013 | 3.34% | 1.59% | 20.4% | 0.72x |
| Baking and desserts | 202 | 3.22% | 1.31% | 14.4% | 0.66x |
| Healthy and high-protein | 123 | 3.76% | 0.96% | 17.1% | 0.74x |
| Vegan and plant-based | 41 | 1.78% | 1.71% | 7.3% | 0.63x |
| Food and lifestyle, mixed | 226 | 4.32% | 1.94% | 14.6% | 0.52x |
Paid label: share with Instagram's paid partnership label in their last 12 posts. Sponsored: median sponsored post against the creator's usual post.
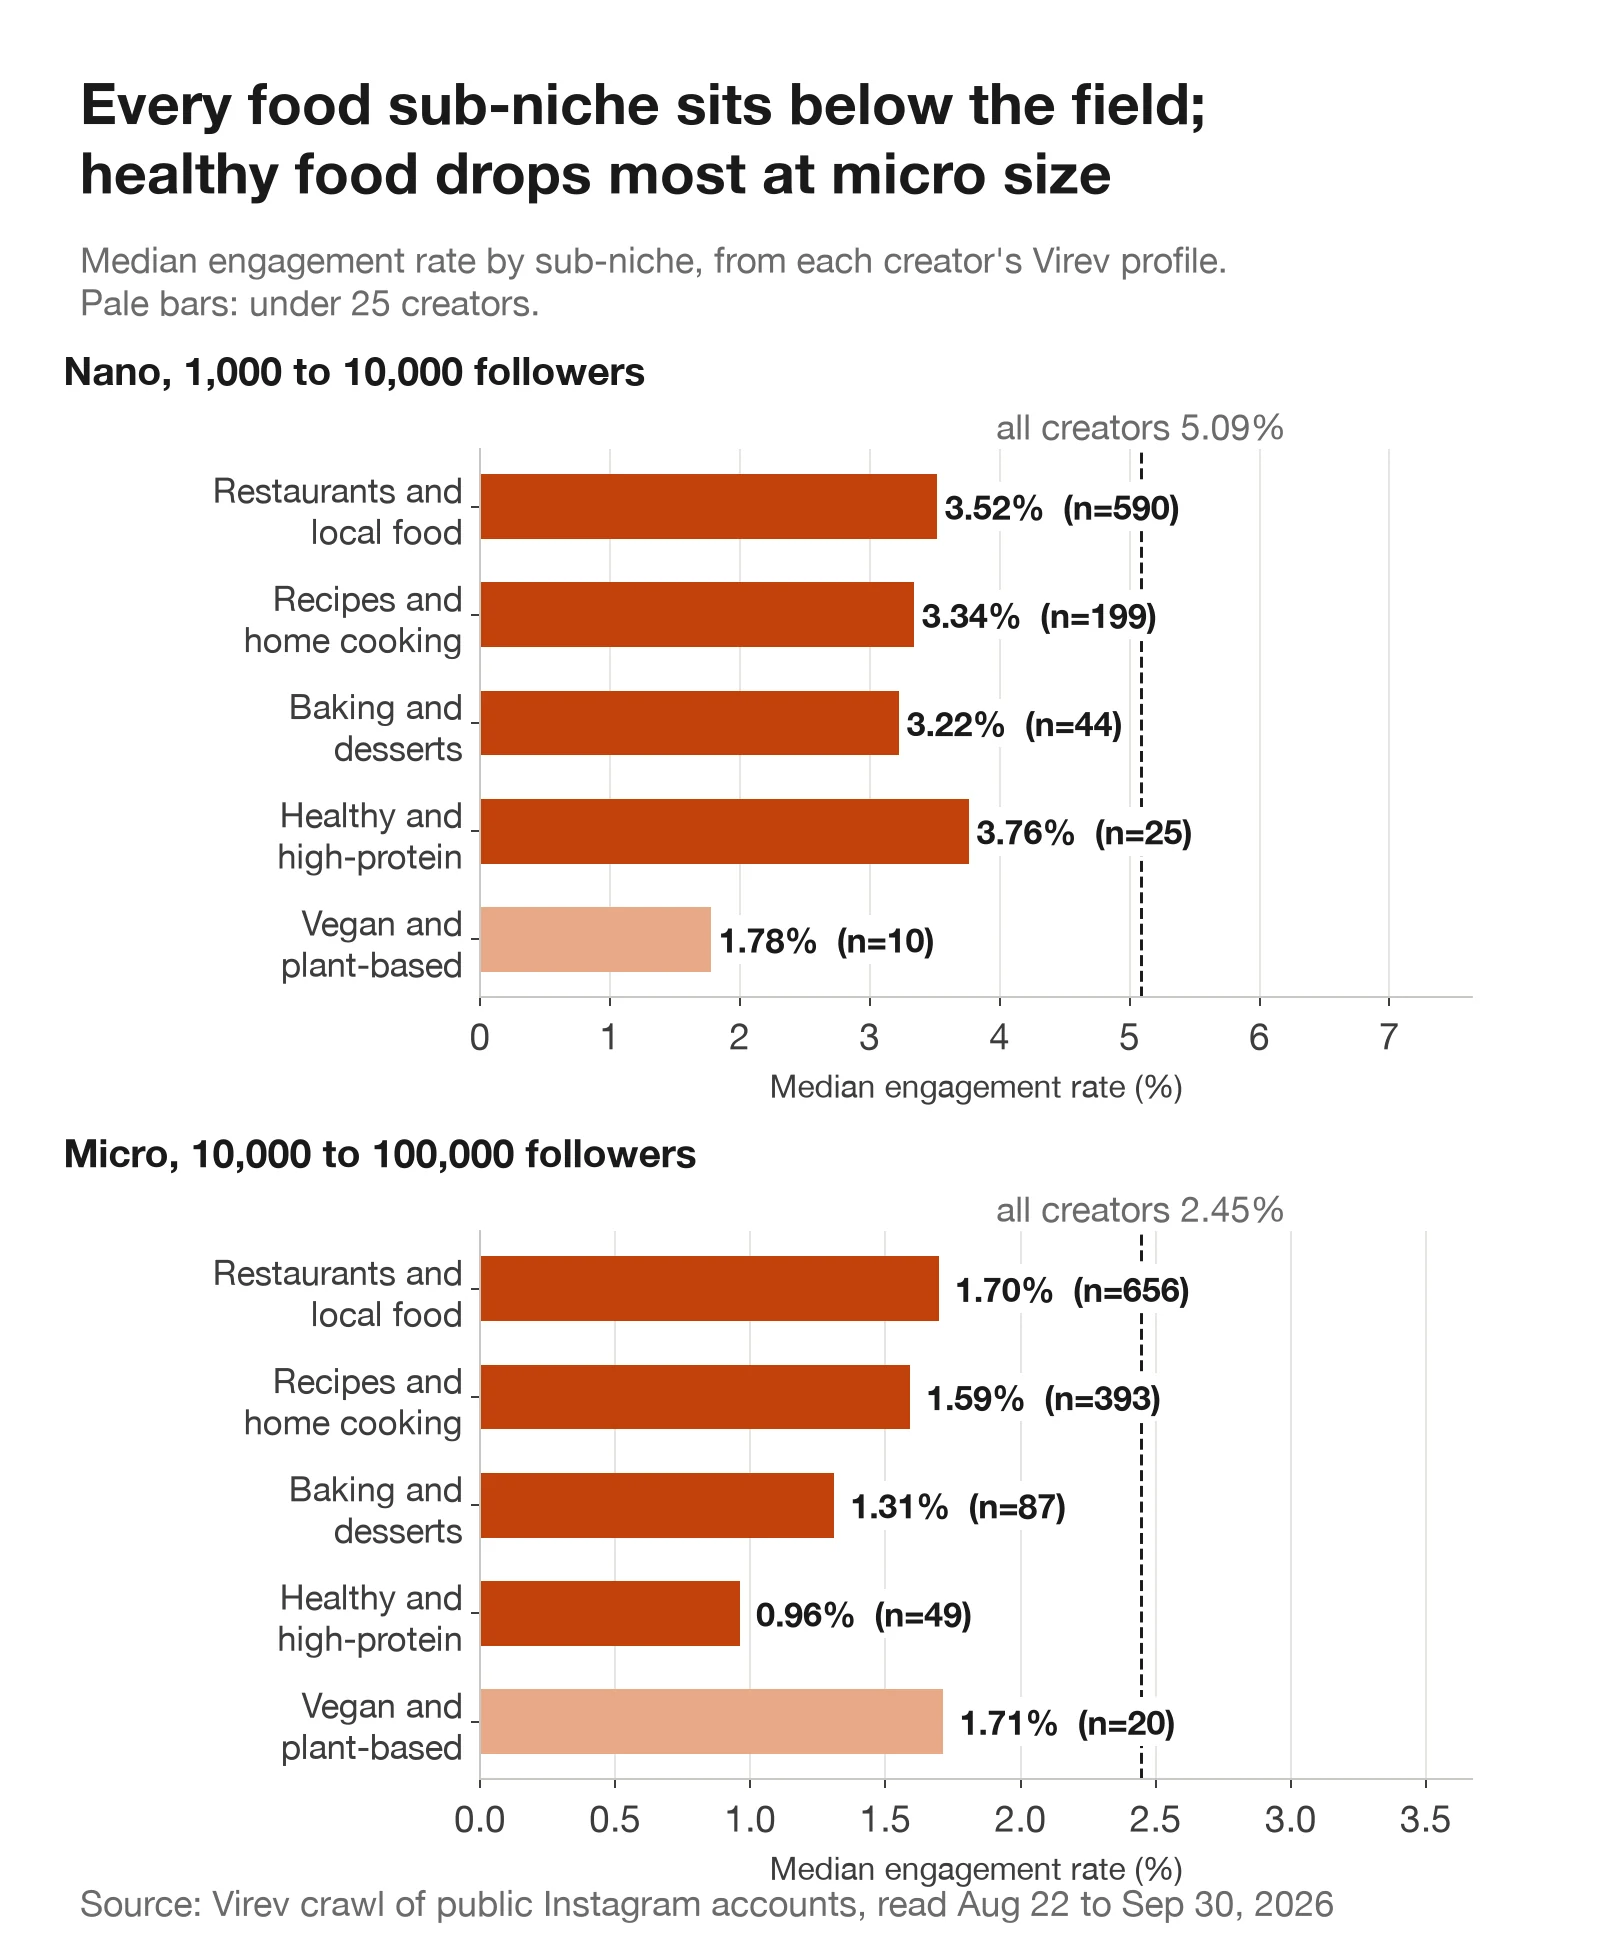
- Restaurant creators are half the niche. 1,472 of the 3,077 food creators review restaurants and local food. Their sponsored posts lose the least, 0.83 times the usual. A paid restaurant visit looks like any other restaurant post, which may explain it.
- Recipe creators are paid most often. 20.4% of them had a paid label in their last 12 posts. Their labeled posts got 0.72 times the usual.
- Healthy food drops at micro size. Healthy and high-protein creators lead the five food sub-niches at nano size, 3.76%, then fall to 0.96% at micro size, the lowest of any group.
- Vegan creators are few. Only 41 measured creators name vegan or plant-based food as their main niche, 10 nano and 20 micro, too few for firm medians.
Sponsored food posts get 0.75x the usual response
We found 5,714 sponsored posts on 1,144 food creator accounts, posted between January 1 and September 26, 2026. A sponsored post here has Instagram's paid partnership label or an ad tag such as #ad, #sponsored or #PR, the same rule as our study of 175,104 sponsored posts. For each one we compared its likes and comments with the median of the same account's posts that carry no ad marker, code, gift or giveaway. The median sponsored food post got 0.75 times the usual response, and 65% got less than usual. Across all creators the figure is 0.69.
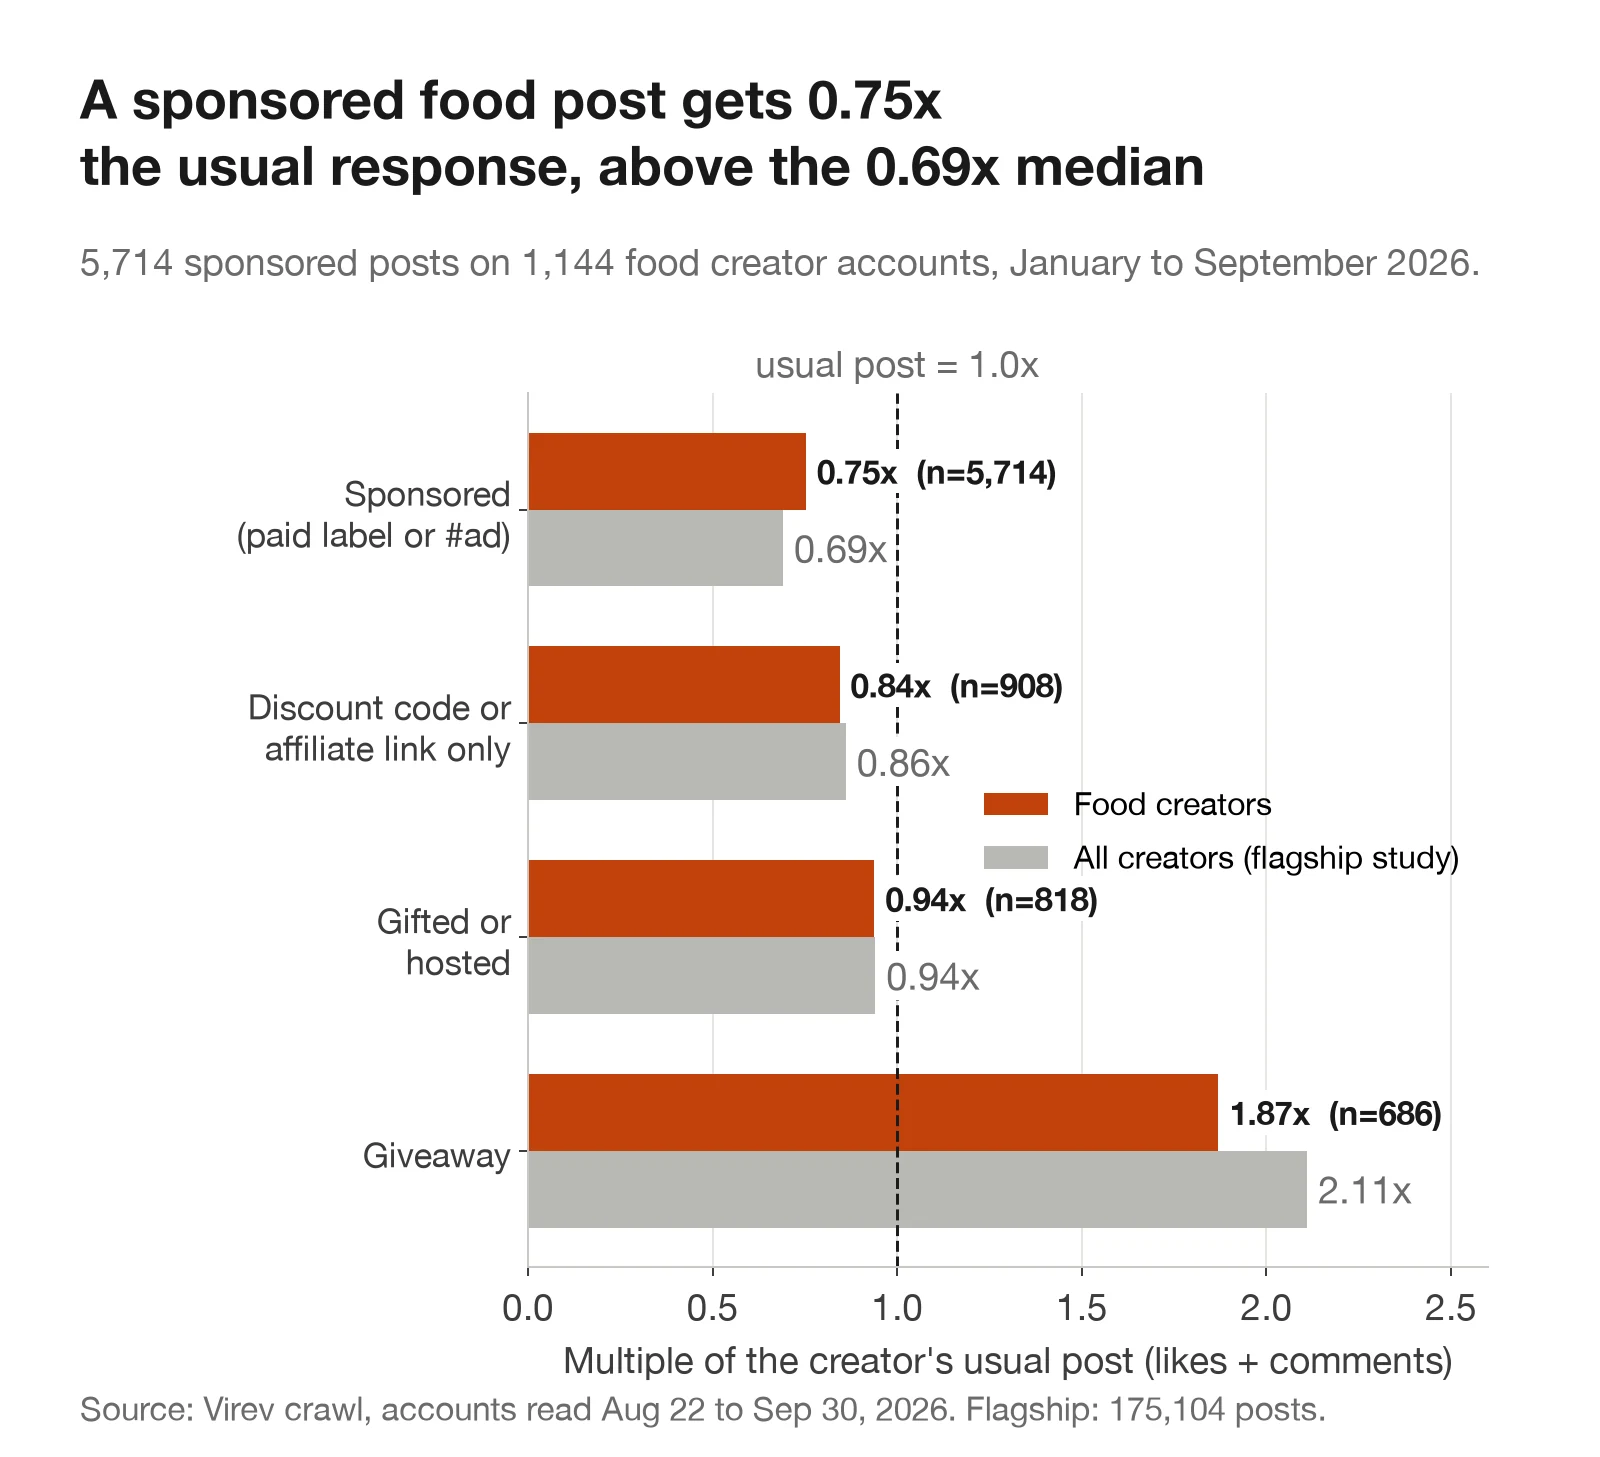
- Food loses less than the average niche. 0.75x matches the food and drink row of the flagship study (0.76x on 6,176 posts). In that study only travel, books, home, beauty and parenting creators lost less.
- Bigger accounts lose more. The median sponsored post got 0.91 times the usual for nano creators, 0.85 for micro, 0.58 for mid-tier, 0.57 for 500,000 to 1 million followers and 0.50 above 1 million. The flagship study found 0.91, 0.75, 0.60, 0.52 and 0.50. Micro food creators keep the most against the field.
- A second ad tag costs more. Posts with only the paid label got 0.82 times the usual. Posts with the label and #ad in the caption got 0.66 times; posts with #ad and no label got 0.74.
- Hosted meals hold up. The 818 gifted or hosted posts ("invited to try", "gifted by") got 0.94 times the usual, about the same as a normal post.
- Reels lose less reach than likes. Sponsored food Reels got 0.85 times the creator's usual plays.
Price a food creator on the lower figure. If a micro creator's typical post gets 1,000 likes and comments, plan for about 850 on a labeled post. For a mid-tier or macro creator, plan for 500 to 580 per 1,000. Katie (@wholesomefoodbykatie) shows that some creators beat the median: her 15 labeled posts got 0.98 times her usual. Kimberly Cauti's 14 got 0.37, and Crowded Kitchen's six got 0.32.
Case: Taco Time NW and #TacoTimeNWPartner
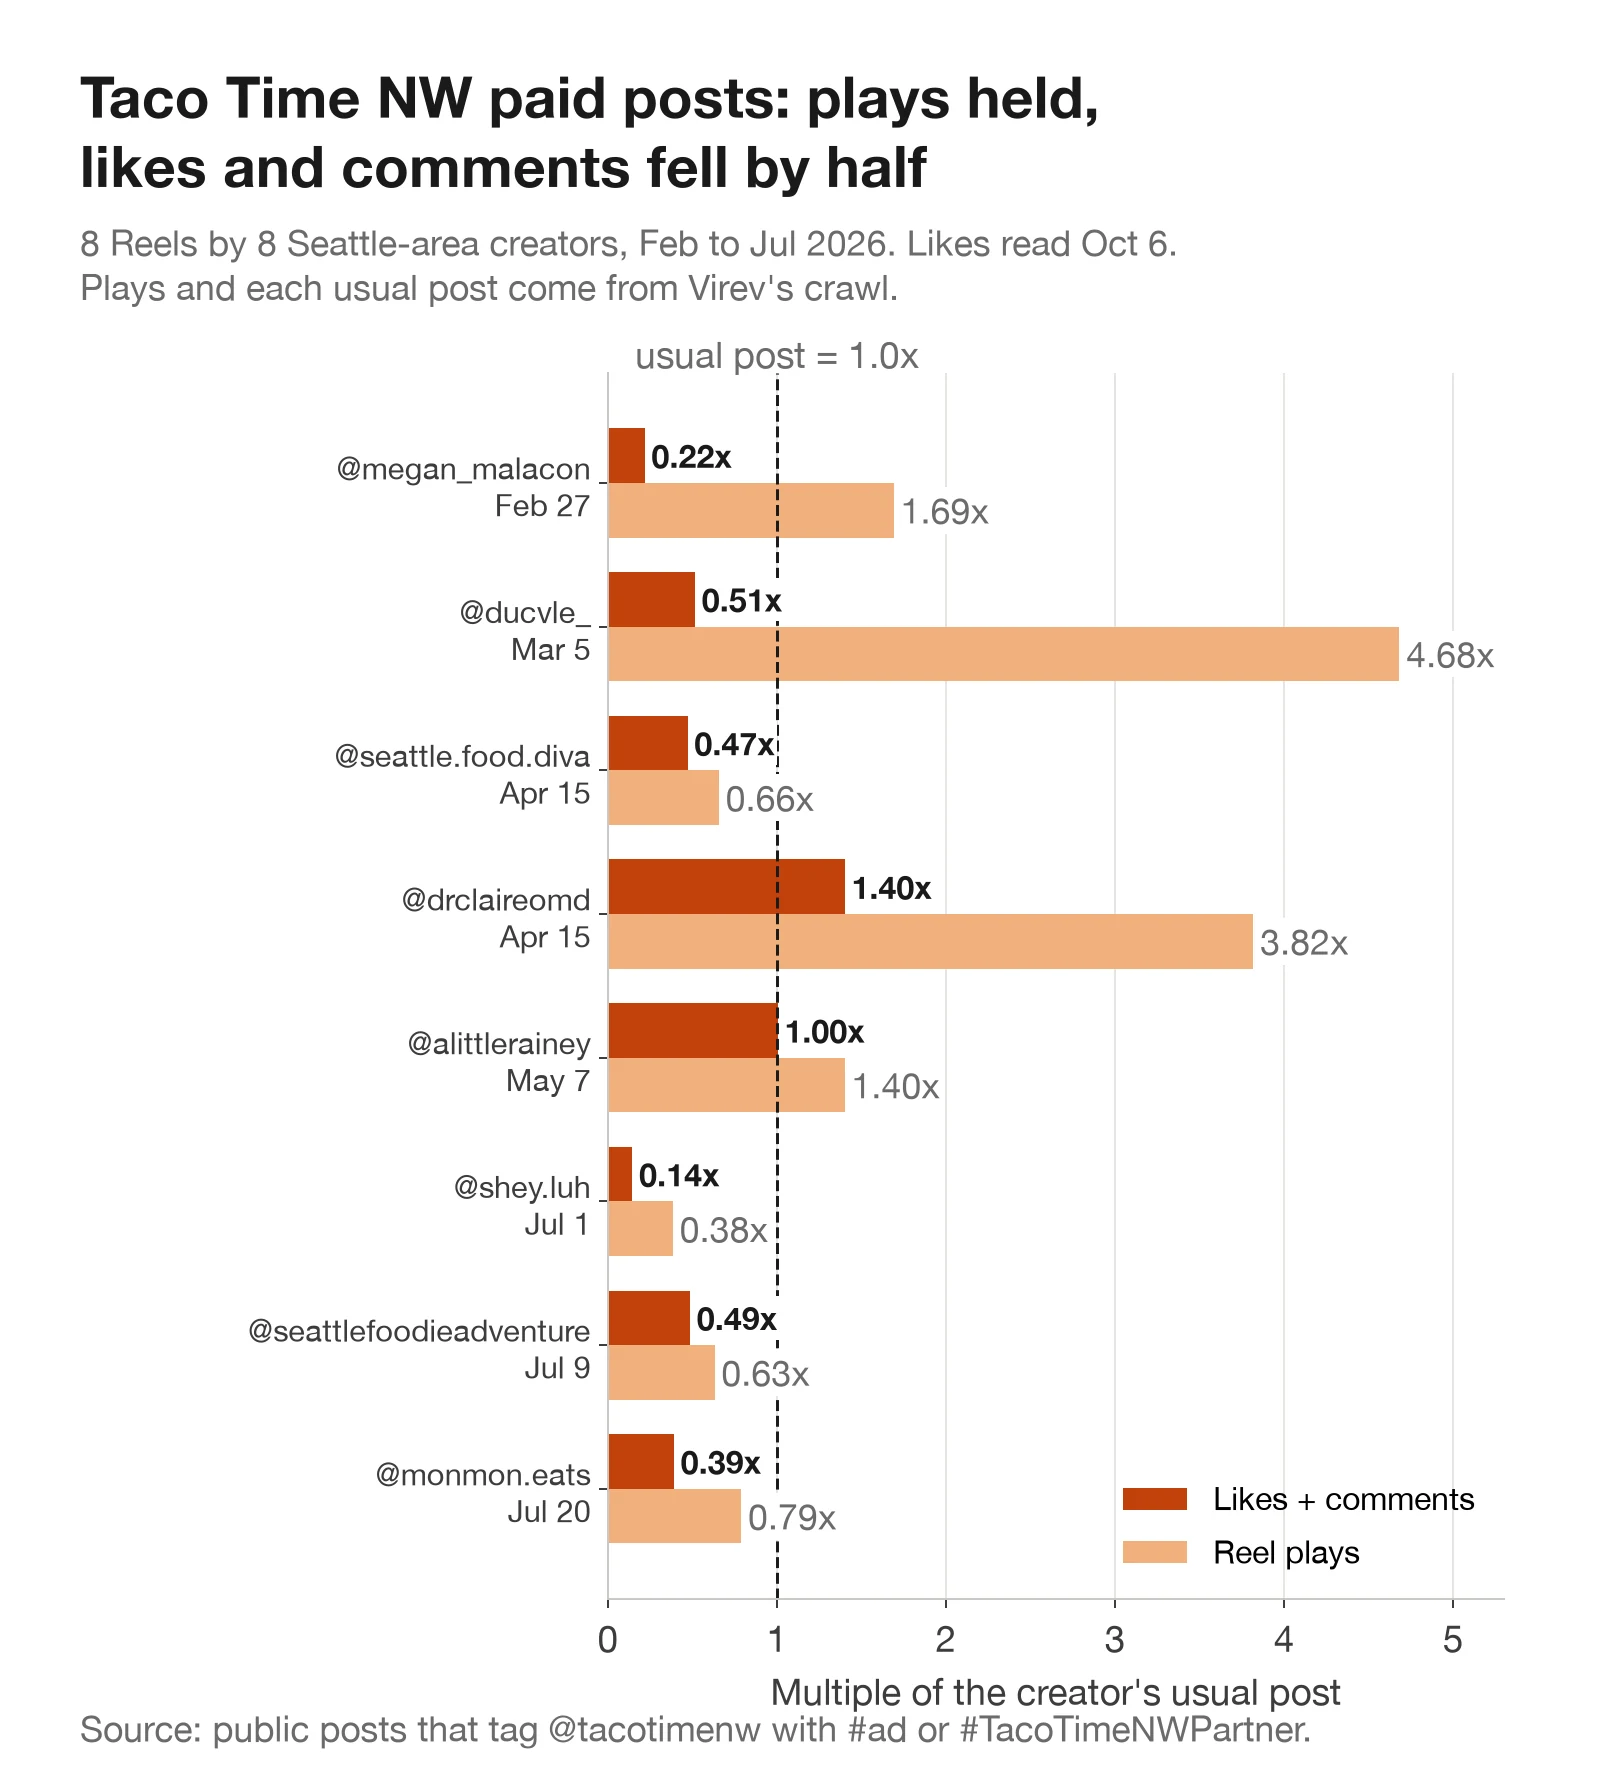
Taco Time NW is a Seattle-area taco chain. Between February and July 2026 it paid local food creators to post Reels about its late-night "Greats After 8" deals, its house sauces ("Obsauced") and a summer menu. We found 10 Reels by 9 creators that tag @tacotimenw and carry #ad or #TacoTimeNWPartner; 9 of the 10 also have Instagram's paid partnership label. On October 6 we re-read the likes and comments on all 10 posts on Instagram.
One creator, @george.pnw, posted twice. His usual posts swing between about 800 and 690,000 likes, so we left his two posts out of the chart. They got 886 and 641 likes and comments.
What the posts show:
- Likes and comments fell by half. The median post got 0.48 times the creator's usual likes and comments. Together the 8 Reels got 4,308 likes and comments; the same creators' usual posts would have got about 10,300.
- Plays did not fall. The median Reel got 1.09 times the creator's usual plays. Four of the 8 beat their usual plays, up to 4.68 times for @ducvle_. Many paid partnership posts also run as ads, which may explain part of this; Instagram does not show paid and organic plays apart.
- A local angle did not lift likes. @shey.luh framed the chain as where locals eat during the World Cup in Seattle; that post got 0.14 times her usual likes and comments and 0.38 times her plays.
- Two creators matched their usual post. @drclaireomd got 1.40 times and @alittlerainey 1.00 times. Both wrote in first person: @drclaireomd called it "my favorite restaurant", and @alittlerainey gave her own order, "Homemade ranch + signature hot sauce on a pinto bean crisp burrito = elite."
For a restaurant chain the lesson is to count reach and response apart. These Reels were played about as often as each creator's normal Reel, but viewers liked and commented half as much. If the goal is awareness of a deal, that may be enough. If the goal is comments, saves and visits, budget for half the usual response.
How to use this list
- Start with the typical post. Compare it with the food median for the creator's tier above, not with the all-creator figure.
- Check the gap between average and typical. A large gap (Emma Harrison, Texas BBQ Professor, Katie) means one viral post lifts the average.
- Discount comment prompts. On a "comment RECIPE" post the comments are mostly automated link requests. Use likes, or the creator's posts without a prompt.
- Count the deals already running. 17% of food creators had a paid label in their last 12 posts. Read how to check a creator's sponsorship history before you send an offer.
- Match the format to the sub-niche. Restaurant creators keep the most on a paid visit. Recipe creators suit a product that goes into the dish. For a local launch, pick creators in that city: our New York creators kept 0.91 times their usual on paid posts.
How we built this list
- Find candidates. We took every public Instagram account with 1,000 or more followers that Virev had read since July 1, 2026. We kept accounts whose Virev creator profile is an individual creator and whose main niche names food, cooking, recipes, baking, pastry, desserts, chefs, restaurants, dining, vegan or plant-based food, barbecue, pizza or similar words. Kitchen design, home decor and music niches that matched a food word were left out.
- Measure. For each account we used up to 12 recent posts from its own feed, at least three days old when read, not pinned. 3,077 creators had six or more such posts; they were read between August 22 and September 30, 2026. We checked a random 30 of them by hand: 22 post mainly about food. The other 8 mention food in their profile but post mostly about lifestyle, beauty, music, boating or recruiting.
- Pick. We favored English-language creators in the US, Canada, the UK and Australia who posted in the last eight weeks, beat the median of their tier, and gave a spread across sub-niches, cities and tiers. 38 of the 40 beat it; Katie stays for her sponsored-post record and Connie Homayed Kazan as the largest baking account. We shortlisted 75 profiles.
- Check by hand. On October 6, 2026 we opened 71 of the 75 profiles on Instagram and read the bio and recent posts; 4 would not load and were dropped. We removed 8 as off-niche or not a creator: a supper club studio, an event curation business, a lifestyle and beauty account, an account with no niche, a mom-life and style account, a sports coach, a custom cake business and a micro bakery. We left out @george.pnw because his usual posts swing between a few hundred and several hundred thousand likes. We left out 22 more for balance across tiers, sub-niches and cities. None looked AI-generated, and all 40 had posted in the three weeks before October 6.
- Example posts. We re-read one post per creator, and all 10 Taco Time NW posts, on Instagram on October 6. For six creators we replaced the first example: five were not typical food posts (a dog, family photos, a product drop, a sponsored post) and one had been removed.
Sponsored posts: we read every post from January 1 to September 26, 2026 on the 3,077 accounts and kept posts at least three days old with like counts shown, 168,155 posts in all. A post's usual response is the median likes plus comments of the same account's posts without a paid label, ad tag, gifted tag, code, affiliate link or giveaway; accounts needed four such posts.
Limits: Instagram does not show saves, shares or story views, so they are not in these rates. The 3,077 food creators are the accounts Virev crawls, which lean toward accounts brands search for, not a random sample of Instagram. Cities come from bio text, not a location field. We list only public business details. Contact creators through the channels on their profiles.
Find more food creators
The 40 creators above are a starting point. Virev creator search for "food" lists every food creator we track, with the same engagement numbers, and lets you filter by follower count, country and engagement rate. The food influencer marketing page explains how brands use it, and our live ranking of top food influencers sorts the largest accounts by followers. To save a creator's Reel for a brief, use the Instagram downloader. All free tools are on the Virev tools page.
For New York creators in every niche, see our list of influencers in NYC. For other niches measured the same way, see the lists of fitness influencers and micro and nano influencers. For the numbers behind the comparisons, read the sponsored post study and the Instagram engagement rate benchmarks.
Sources
- Top 35 food influencers in the U.S.
- Top 120 food influencers in the US
- 100 top food influencers in 2026
- 30 most popular food influencers on Instagram, TikTok and YouTube
- Top 143 NYC food influencers in 2026
- Do sponsored posts perform worse? We measured 175,104 Instagram posts
- Instagram engagement rate benchmarks for 2026: 431,494 accounts by follower count