



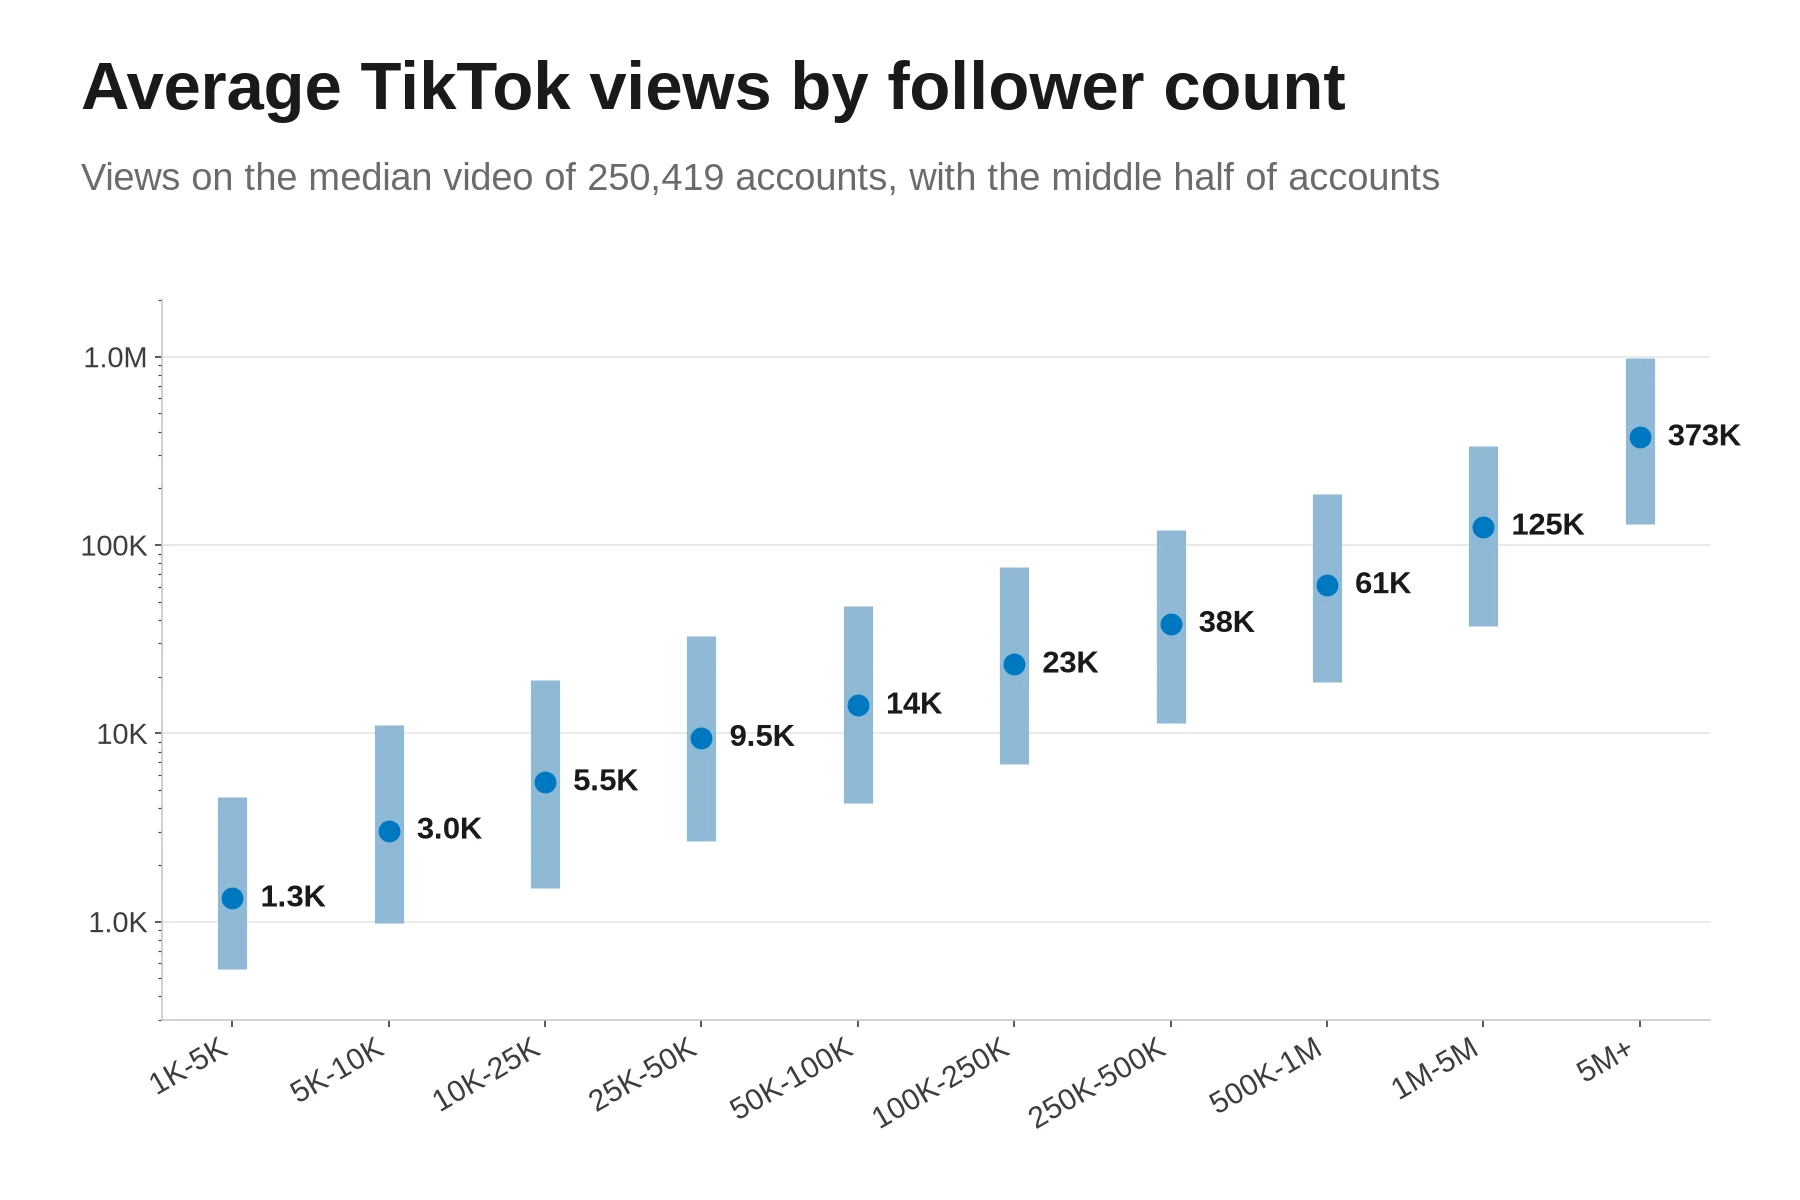
The typical TikTok account with 1,000 or more followers gets 8,007 views on its median video. We measured up to the 12 latest videos of each of 250,419 public accounts that Virev's crawler read between August 13 and October 1, 2026. Normal views depend on account size: 1,327 for an account with 1,000 to 5,000 followers, 14,050 at 50,000 to 100,000, and 125,325 at 1 million to 5 million.
The average is a different number. In the typical account, the average of its latest videos is 2.0 times its median video, because one video often carries a third of all its views. If you average every video in the sample, you get 174,544 views, against 8,878 for the median video. That is why published "average TikTok views" figures disagree by a factor of ten or more.
The pages that rank for this question are view calculators from creator tools (Sup, Modash, HypeAuditor, MaveKite) and short guides. The calculators print ranges per follower tier with no sample size, or measure a few hundred creators or brand posts. This study adds ten follower bands from 250,419 accounts and the gap between average and median inside each account. It also measures how often a video beats its own account's average, how views grow with the age of a video, and how they differ by category and country, with seven named accounts read again on October 26, 2026. The calculator below places any account against the bands.
8,007
Typical account
2.0x
Average over median
28%
Beat the average
TikTok average views calculator
Type the views of your latest videos, or of the creator you are checking, and the follower count. Use videos at least a week old. Nothing leaves this page.
The median, the average and where they sit for accounts of the same size appear here.
Average TikTok views by follower count
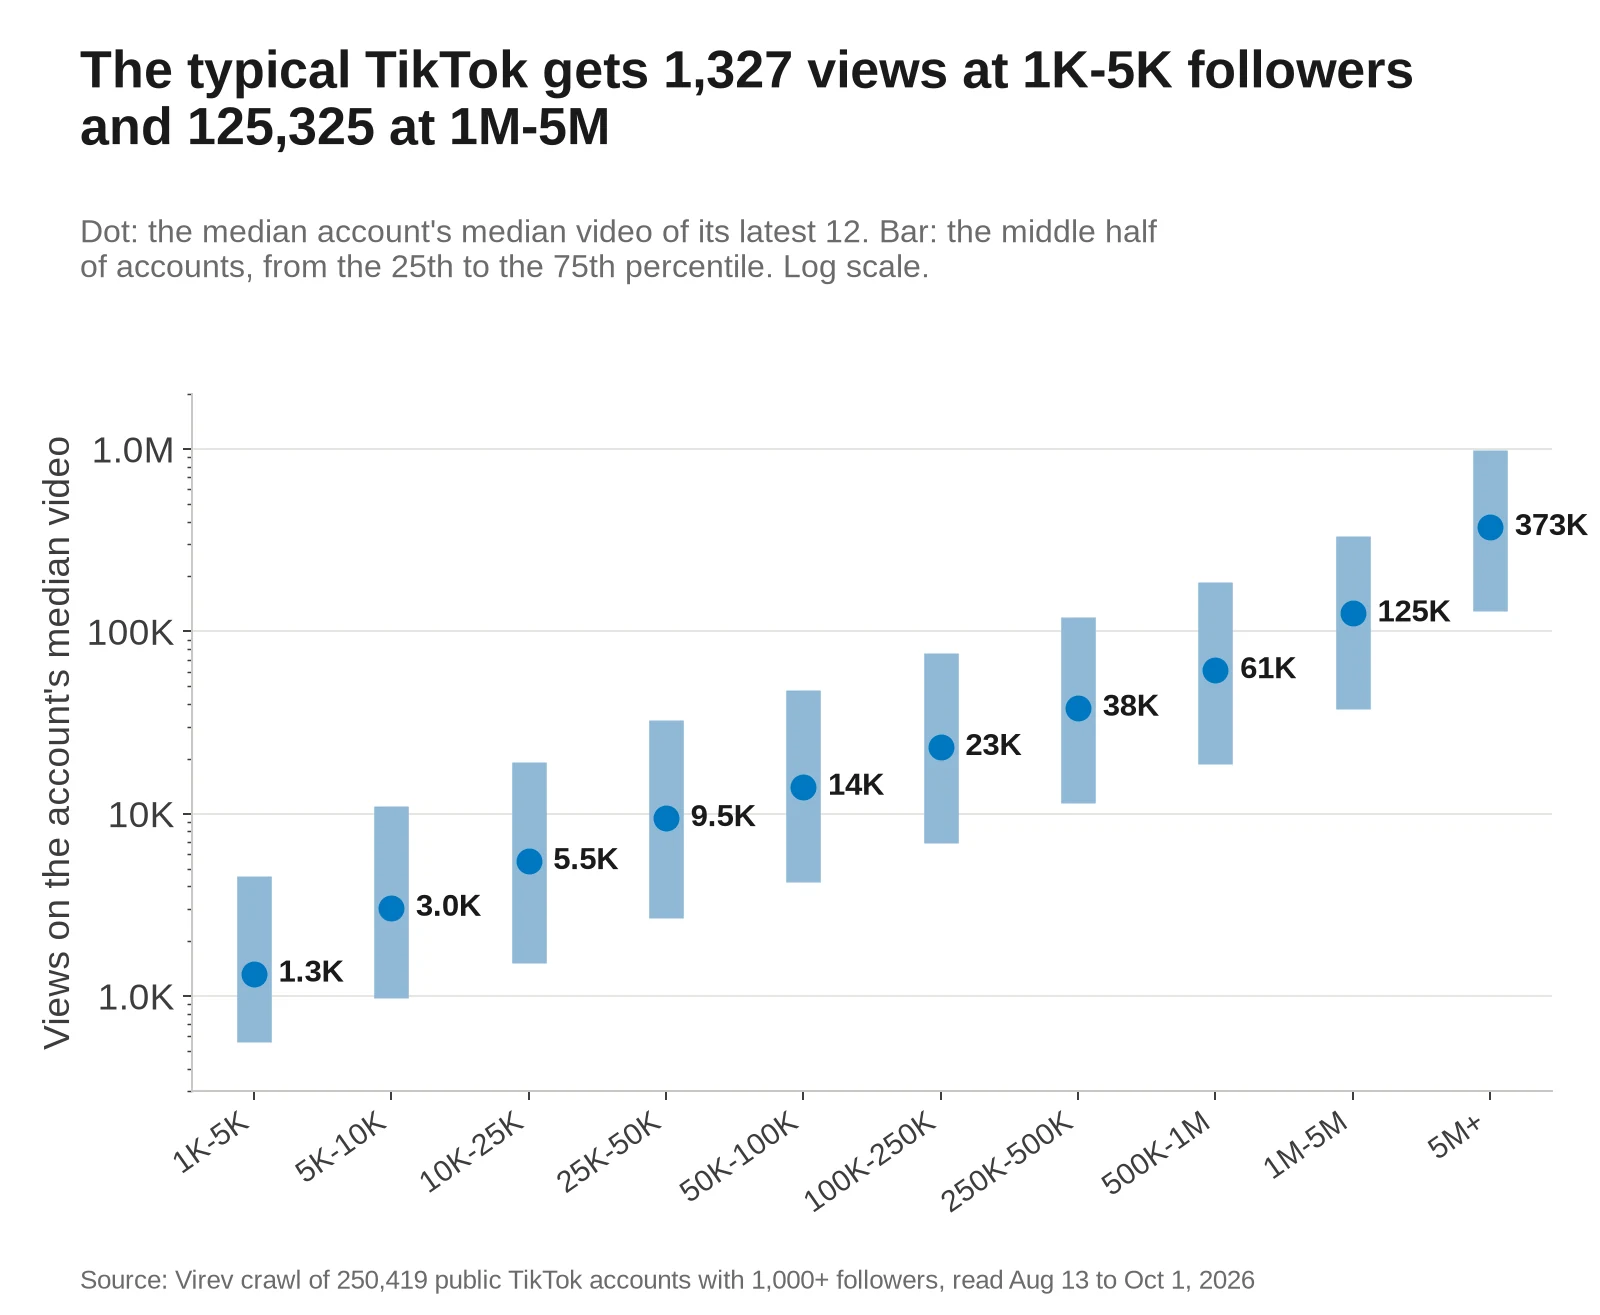
For each account we took the median of its latest 12 videos, the view count in the middle when you sort them. Then we read the 25th percentile, the median and the 75th percentile of those account medians in each follower band.
| Followers | Accounts | Median video, 25th pct | Median | 75th pct | Average, median account | Median views per follower |
|---|---|---|---|---|---|---|
| All | 250,419 | 1,583 | 8,007 | 41,200 | 38,622 | 27.2% |
| 1K-5K | 62,839 | 561 | 1,327 | 4,570 | 6,229 | 62.9% |
| 5K-10K | 25,779 | 981 | 3,044 | 11,013 | 15,446 | 43.1% |
| 10K-25K | 35,337 | 1,512 | 5,490 | 19,200 | 24,803 | 34.6% |
| 25K-50K | 25,214 | 2,686 | 9,452 | 32,738 | 36,482 | 26.6% |
| 50K-100K | 23,613 | 4,246 | 14,050 | 47,650 | 48,359 | 20.0% |
| 100K-250K | 28,230 | 6,900 | 23,200 | 76,488 | 68,922 | 14.6% |
| 250K-500K | 17,765 | 11,400 | 38,100 | 120,350 | 99,899 | 11.0% |
| 500K-1M | 13,499 | 18,650 | 61,200 | 185,775 | 146,517 | 8.9% |
| 1M-5M | 15,338 | 37,350 | 125,325 | 335,213 | 253,992 | 6.6% |
| 5M+ | 2,805 | 129,400 | 373,050 | 988,000 | 674,333 | 4.1% |
- A median video under the 25th percentile puts an account in the bottom quarter of its band. At 10,000 to 25,000 followers that line is 1,512 views.
- A median video above the 75th percentile puts it in the top quarter. At 100,000 to 250,000 followers that line is 76,488 views.
- The bands overlap a lot. A top-quarter account with 10,000 to 25,000 followers (19,200 views) gets more views than a bottom-quarter account with 250,000 to 500,000 (11,400).
- The "Average" column is what most calculators report. In each band it is 1.8 to 5.1 times the median video column, so compare an average only with other averages.
Views per follower by follower count
Views divided by followers answers "how many views is good for my follower count". We divided each account's median video by its follower count.
| Followers | Views per follower, 25th pct | Median | 75th pct | Median video beats followers | Videos under followers, median account | All 12 under followers |
|---|---|---|---|---|---|---|
| All | 8.1% | 27.2% | 92.7% | 23.7% | 83.3% | 33.3% |
| 1K-5K | 25.6% | 62.9% | 198.7% | 38.6% | 66.7% | 23.9% |
| 5K-10K | 14.2% | 43.1% | 154.5% | 32.7% | 75.0% | 24.1% |
| 10K-25K | 9.9% | 34.6% | 120.5% | 28.3% | 75.0% | 24.9% |
| 25K-50K | 7.7% | 26.6% | 92.0% | 23.5% | 83.3% | 26.7% |
| 50K-100K | 6.0% | 20.0% | 67.5% | 18.8% | 83.3% | 30.5% |
| 100K-250K | 4.4% | 14.6% | 49.0% | 13.5% | 91.7% | 36.8% |
| 250K-500K | 3.2% | 11.0% | 34.5% | 7.8% | 91.7% | 46.3% |
| 500K-1M | 2.7% | 8.9% | 26.7% | 5.0% | 100.0% | 56.2% |
| 1M-5M | 2.0% | 6.6% | 17.9% | 2.3% | 100.0% | 70.7% |
| 5M+ | 1.5% | 4.1% | 10.6% | 0.7% | 100.0% | 85.9% |
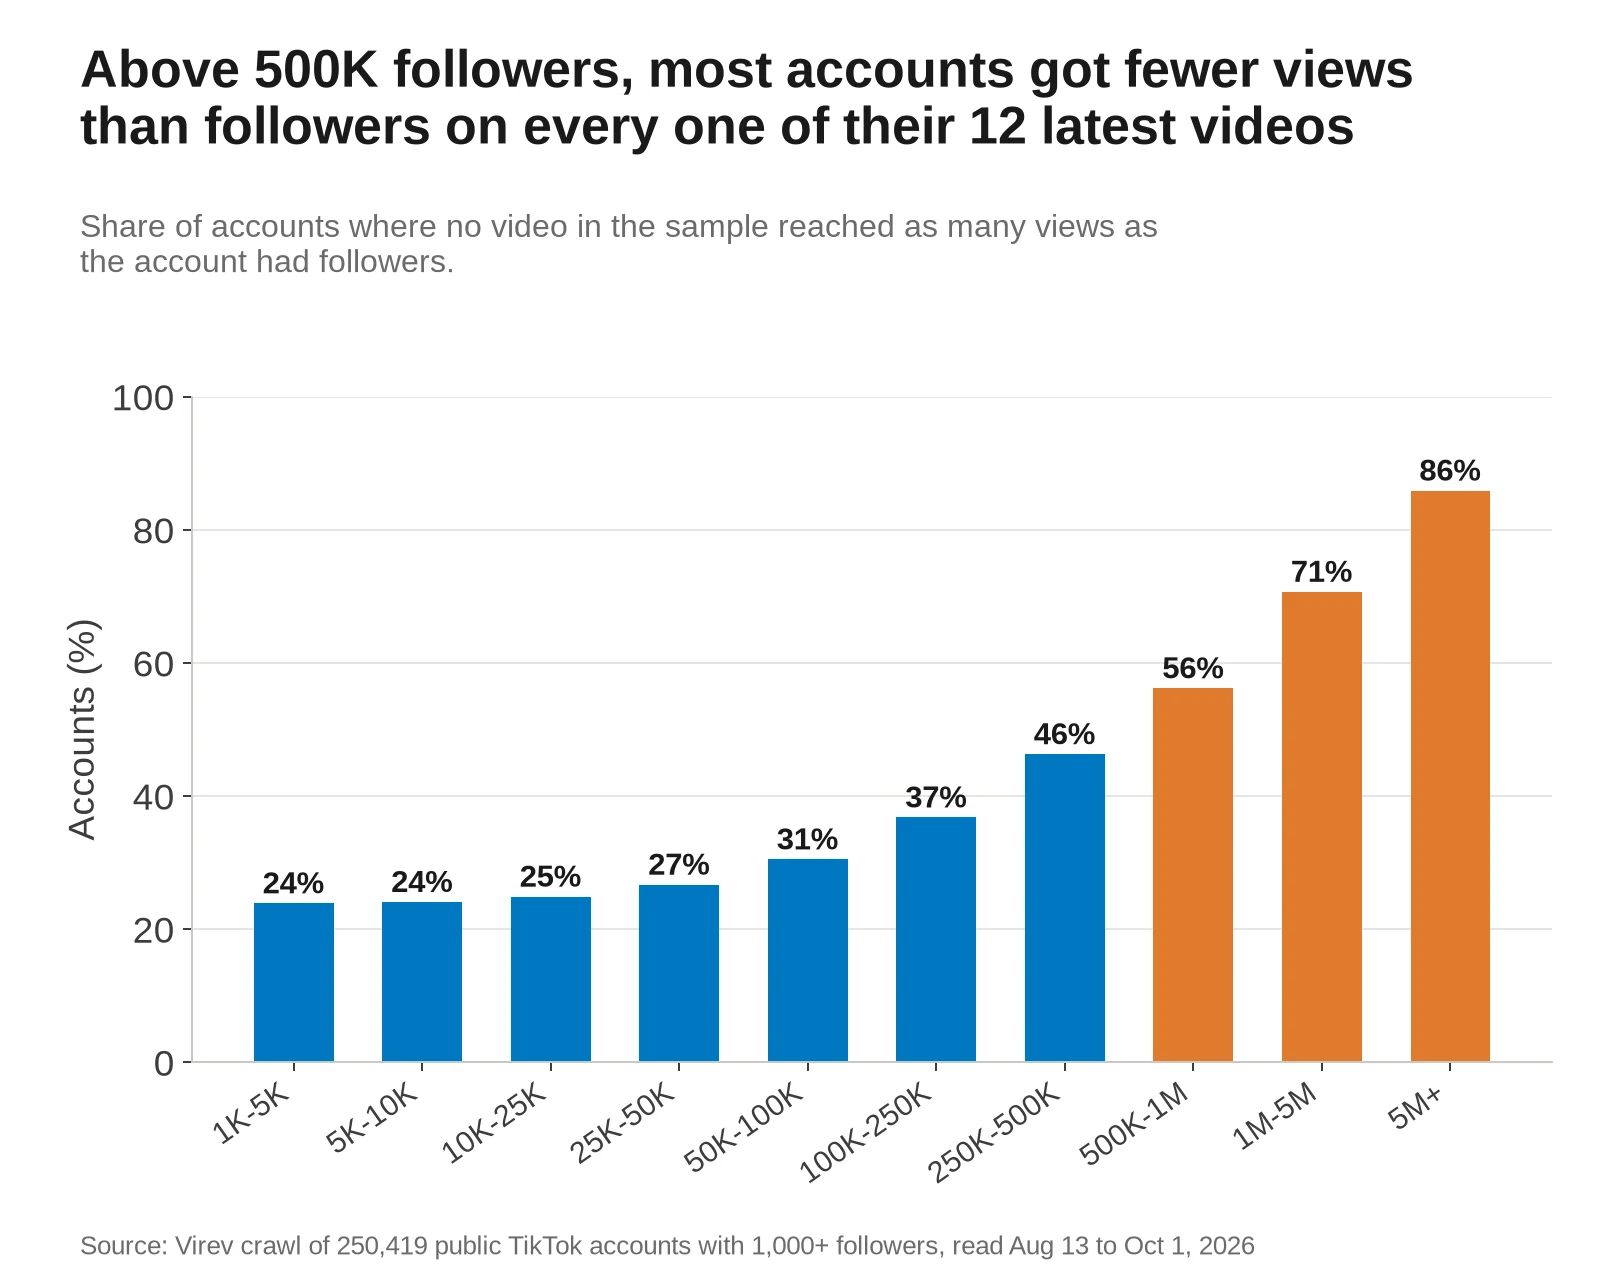
- The median account with 1,000 to 5,000 followers gets views equal to 62.9% of its followers on a typical video. Above 5 million followers it gets 4.1%.
- A median video with more views than followers is common for small accounts and rare for large ones. 38.6% of accounts with 1,000 to 5,000 followers have one, against 0.7% of accounts above 5 million.
- The median account got fewer views than it had followers on 83% of its videos, which is 10 of 12. Above 500,000 followers it was all 12.
- One account in three, 33.3%, had no video in the sample that reached its follower count. Above 5 million followers it was 85.9%.
A rule like "aim for 10% to 20% of your followers" fits accounts with 50,000 to 500,000 followers and is too low for small accounts. For engagement per follower and per view by follower tier, see our TikTok engagement rate benchmarks.
Why the average is higher than the median
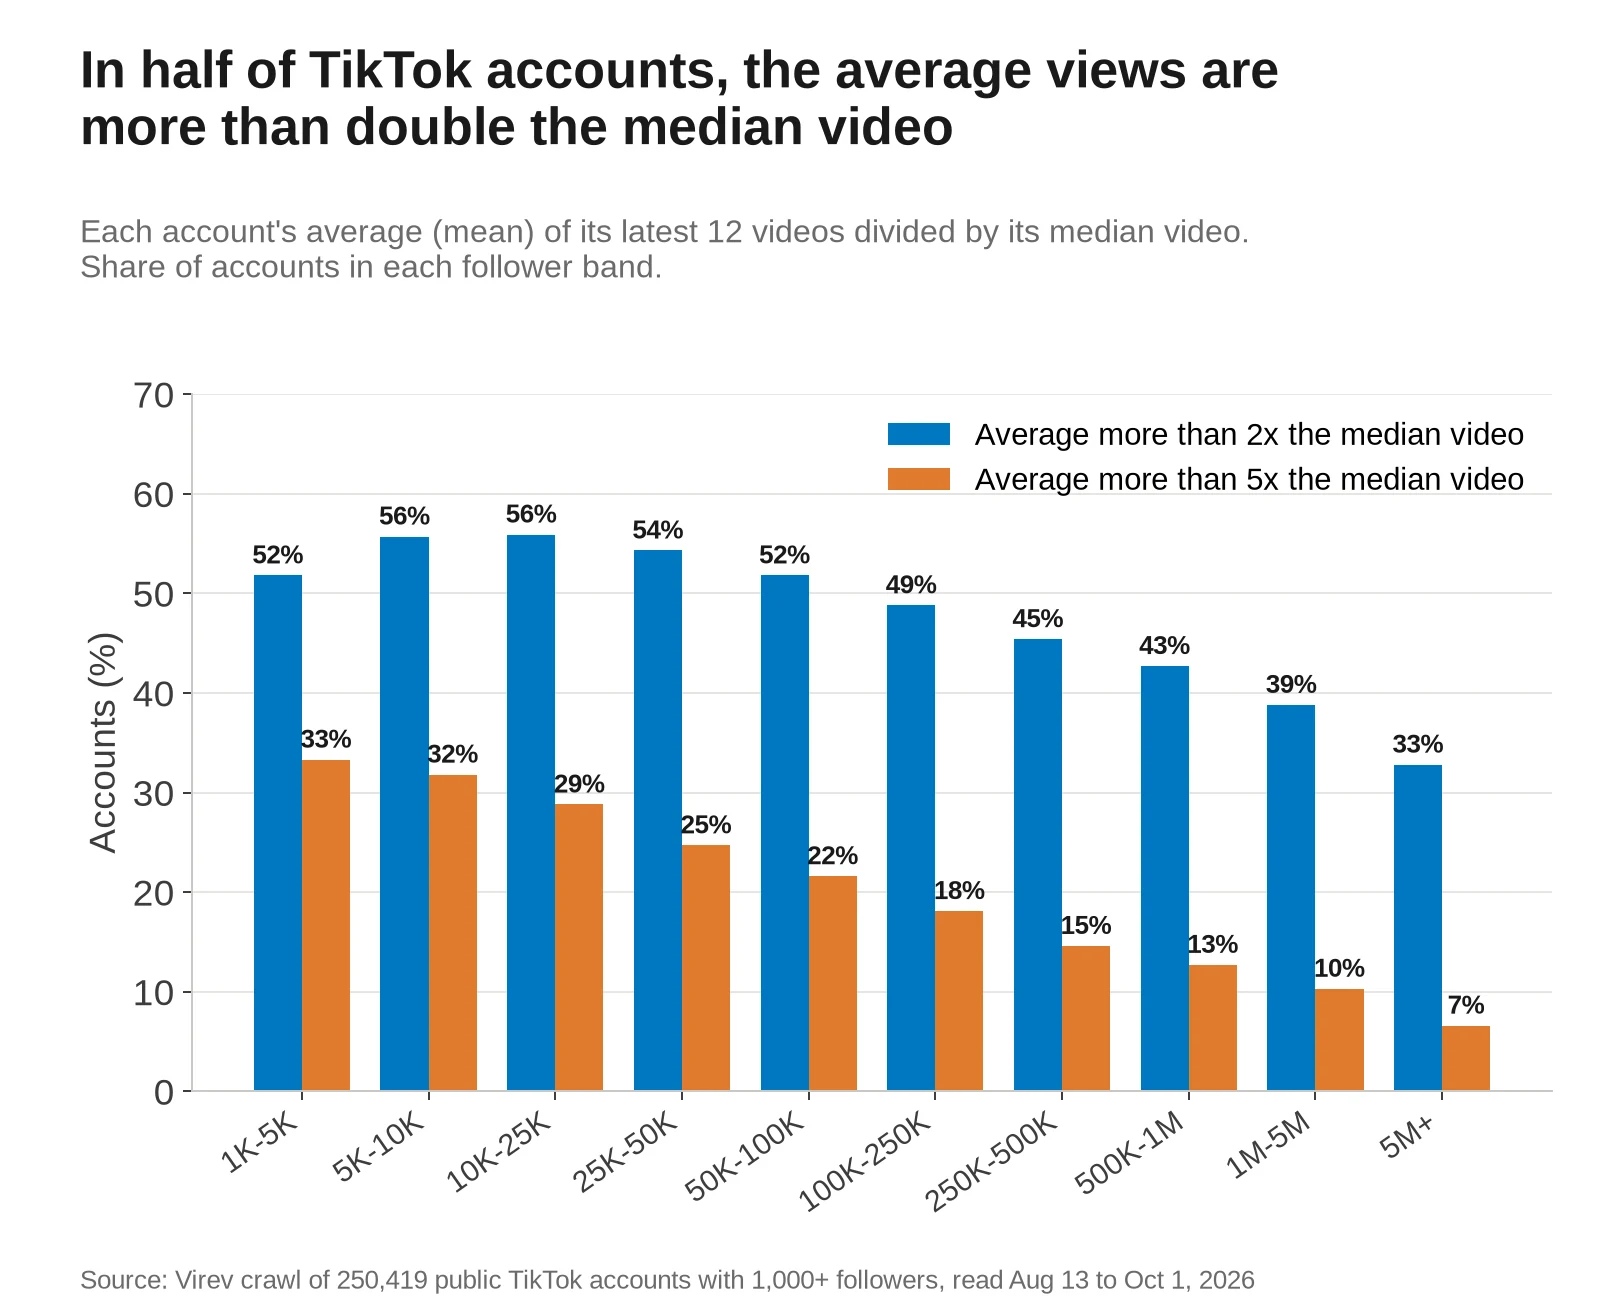
In many TikTok accounts, one or two videos get far more views than the rest. In the median account, the most-viewed of the 12 videos held 36.1% of all their views and got 8.8 times the account's median. That one video pulls the average up and leaves the median where it was.
| Followers | Average over median, median account | Average over 2x median | Top video's share of views | Random video beats median | Random video beats average | Random video under half the average |
|---|---|---|---|---|---|---|
| All | 2.03x | 50.7% | 36.1% | 49.9% | 27.6% | 50.2% |
| 1K-5K | 2.14x | 51.8% | 38.7% | 49.8% | 26.6% | 49.1% |
| 5K-10K | 2.36x | 55.7% | 39.7% | 49.8% | 26.2% | 52.4% |
| 10K-25K | 2.32x | 55.9% | 39.2% | 49.9% | 26.5% | 52.9% |
| 25K-50K | 2.19x | 54.3% | 37.7% | 49.9% | 27.1% | 52.4% |
| 50K-100K | 2.08x | 51.8% | 35.9% | 49.9% | 27.7% | 51.4% |
| 100K-250K | 1.96x | 48.8% | 34.5% | 49.9% | 28.4% | 50.0% |
| 250K-500K | 1.86x | 45.4% | 33.1% | 49.9% | 29.3% | 48.6% |
| 500K-1M | 1.78x | 42.7% | 31.7% | 49.9% | 30.1% | 47.5% |
| 1M-5M | 1.69x | 38.8% | 30.6% | 49.8% | 30.6% | 45.8% |
| 5M+ | 1.59x | 32.8% | 29.1% | 49.6% | 31.7% | 42.8% |
To test which number predicts a video, we held out each video in turn and compared it with the median and the average of the same account's other videos. Each account counts once.
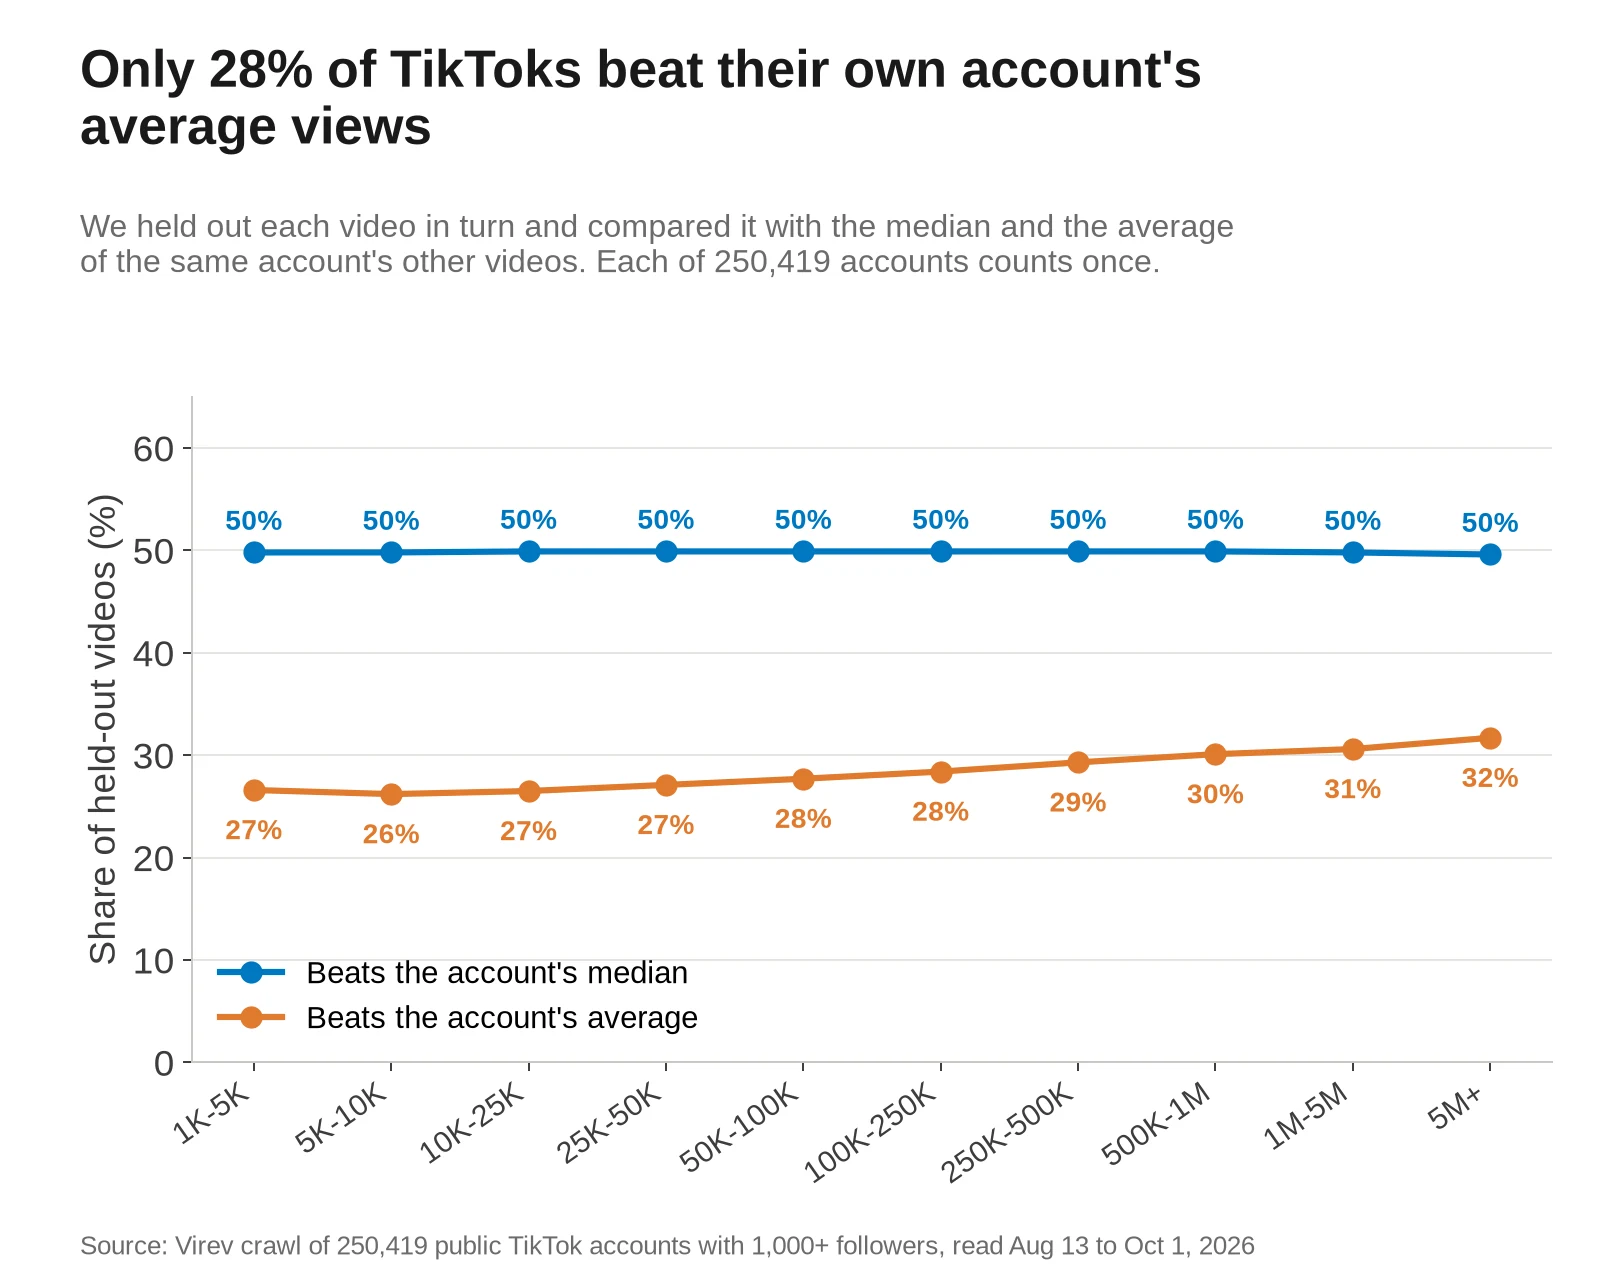
- A held-out video beat the median of the account's other videos 49.9% of the time, as a middle value should.
- It beat their average 27.6% of the time. So about 7 in 10 videos fall short of their own account's average views.
- Half of the held-out videos, 50.2%, got less than half of the account's average. Against the median, 20.2% did.
- The gap shrinks with size. Above 1 million followers, 31% to 32% of videos beat the average, against 26% to 27% below 50,000.
If you price a sponsored video on a creator's average views, expect most videos to come in under it. Our sponsored post study found that TikToks with a sponsored caption tag, such as #ad, got a median 0.69 times the creator's usual views on top of that. A brand that plans on the median gets a number that half of videos beat.
Jess's 12 videos at our read
Jess (@jesssaay01) is a nail tech in Houston. She had 24,953 followers when we read the account on August 24, 2026. Eleven of her latest 12 videos got between 1,019 and 47,500 views. The twelfth, "Spider-man Inspo" from June 18, had 69.2 million.
- Her median video was 2,499 views, and her average was 5,774,868, which is 2,311 times the median.
- An average views calculator would have told a brand to expect 5.8 million views a video. The video she posted next, on June 23, got 47,500.
- On October 26, 2026, the Spider-Man video showed 70.3 million views and 1.8 million likes. It had dropped out of her latest 12, so her average was 8,205 and her median 2,558. The median barely moved, and the average fell by 99.9%.
Click "Try @jesssaay01 at our read" in the calculator above to see the same numbers.
Accounts far above and below their band
We picked accounts whose median video sat far above or below the median of their follower band. On October 26, 2026 we read each one again through Virev's crawler and opened the profiles in a browser.
| Account | Followers at our read | Median video at our read | Band median | Followers on Oct 26 | Median video on Oct 26 |
|---|---|---|---|---|---|
| McKenna Grace (@mckennagrace), actor | 7,351,267 | 13,000,000 | 373,050 | 7,684,967 | 14,450,000 |
| Lil Baby (@lilbaby), music | 6,336,462 | 3,800,000 | 373,050 | 6,536,950 | 1,850,000 |
| Eyüp Yalçın (@pastrychef_tr), pastry | 101,534 | 1,950,000 | 23,200 | 164,416 | 3,100,000 |
| @bouncinonthemballz, music edits | 1,277 | 248,700 | 1,327 | 1,494 | 310,350 |
| Jess (@jesssaay01), nail art | 24,953 | 2,499 | 5,490 | 25,864 | 2,558 |
| Soflofooodie (@soflofooodie), food and travel | 2,991,247 | 1,196 | 125,325 | 2,984,090 | 925 |
| Andy Dooley (@andyldooley), faith and reactions | 1,905,709 | 637 | 125,325 | 1,903,151 | 913 |
- McKenna Grace's median video got 1.8 times her follower count at our read, 35 times the median for accounts above 5 million followers. Her average and median were within 14% of each other at our read, and equal on October 26 (14.44 million against 14.45 million), so her views do not rest on one hit.
- Lil Baby's median video got 3.8 million views at our read, 10 times the median for his band. Eleven of his 12 videos still got fewer views than his 6.3 million followers. On October 26 his median was 1.85 million.
- Eyüp Yalçın, a Turkish pastry chef, got 19 times his follower count on a typical video, and none of his 12 videos fell under his follower count. His followers grew 62% between our read on August 20 and October 26.
- @bouncinonthemballz had 1,277 followers and a median of 248,700 views, 195 times its follower count. Its posts are short music edits tagged with artists such as Wizkid, Skepta and Dave.
- Soflofooodie, a food and cruise travel account run by Shay and Steph Ghitis, had 2,991,247 followers and a median video of 1,196 views at our read, 0.04% of its followers. All 12 videos were under 2,500 views. On October 26 the median was 925.
- Andy Dooley had 1,905,709 followers and a median of 637 views at our read. On October 26 one reaction video had 109,000 views, so his average jumped to 10,179 while his median was 913.
A large follower count with a median in the hundreds is a reason to ask the creator for their analytics before a booking. The public numbers do not say why the views fell, so we do not guess.
Views keep growing for weeks after posting
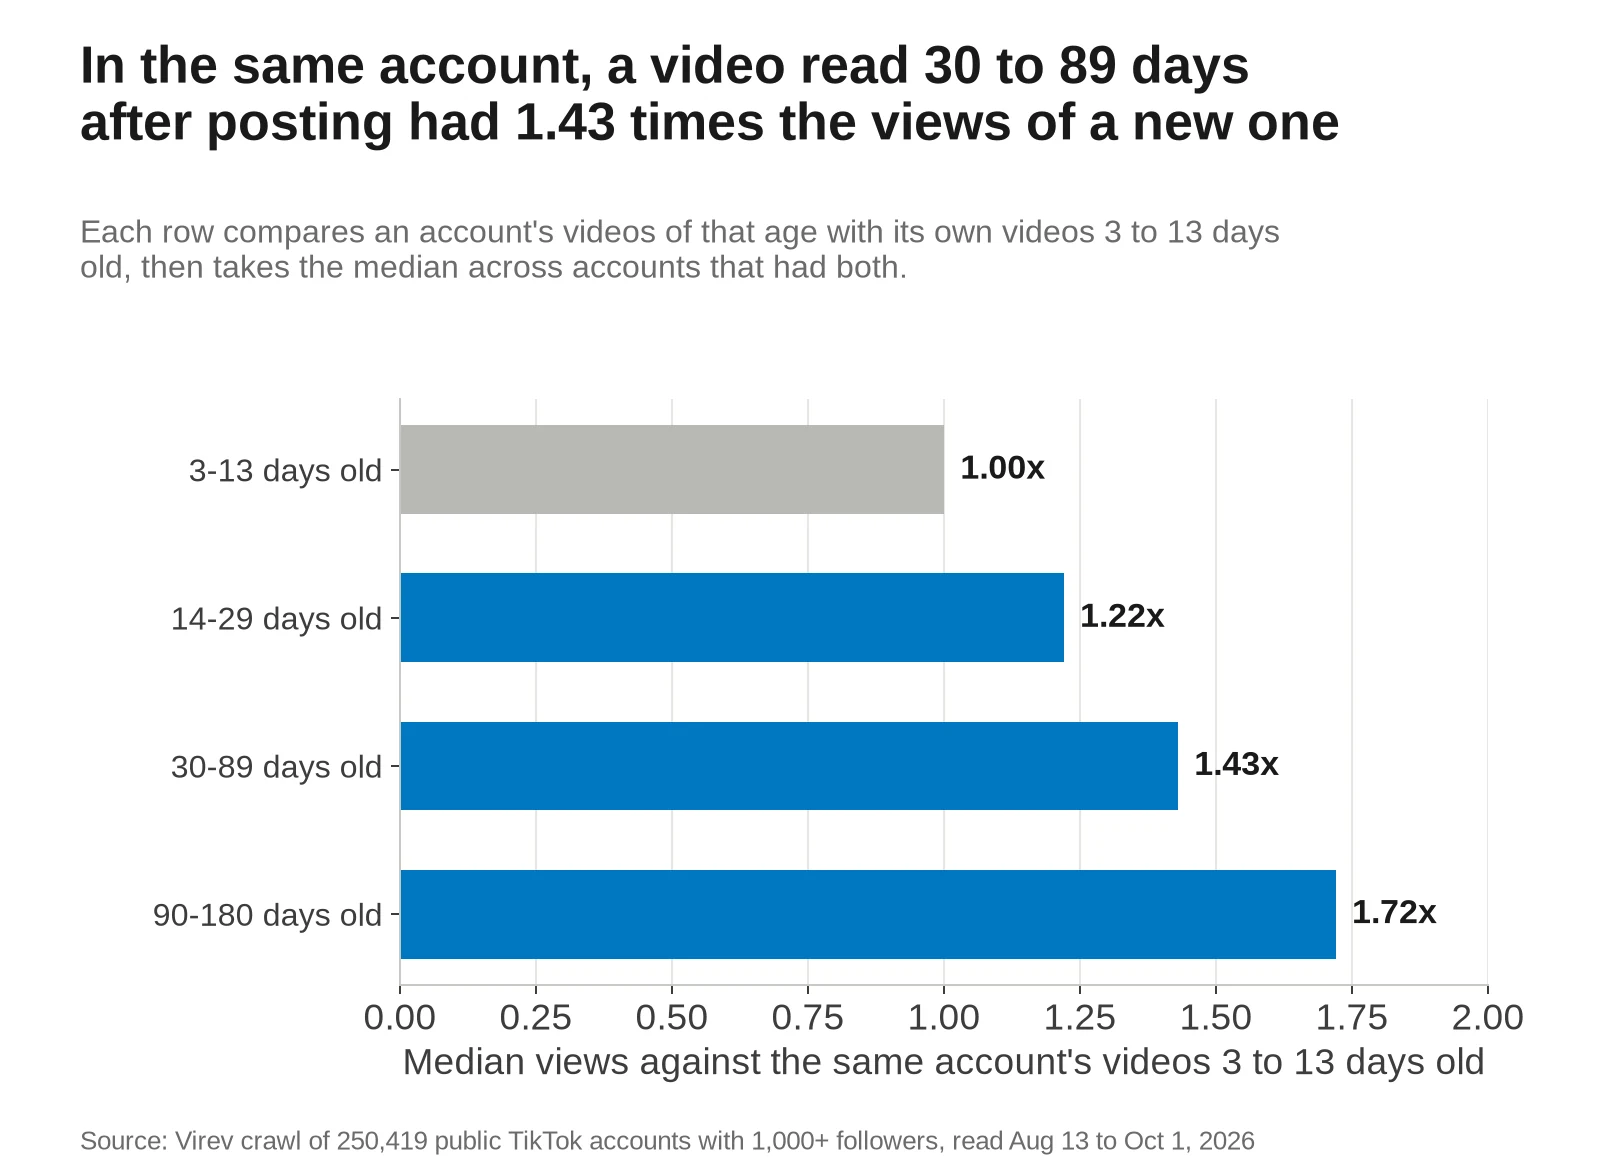
A view count keeps rising after the day a video is posted. To see by how much, we compared each account's videos of one age with its own videos read 3 to 13 days after posting. Comparing inside one account keeps the account's size and topic the same.
| Age at our read | Accounts compared | Views against the same account's 3-13 day videos | Accounts where older videos were ahead |
|---|---|---|---|
| 14-29 days | 133,936 | 1.22x | 59.7% |
| 30-89 days | 77,769 | 1.43x | 62.7% |
| 90-180 days | 22,040 | 1.72x | 63.8% |
- A video 30 to 89 days old had 1.43 times the views of the same account's videos 3 to 13 days old.
- Across all accounts, the median video 90 to 180 days old got fewer views (5,487) than the median video 3 to 13 days old (9,555). That is because only accounts that post rarely still have such old videos among their latest 12. Inside one account, older videos had more views.
- To compare two accounts, use videos of about the same age, and leave out videos under a week old. A median taken from 12 videos posted this week will read low against one taken from 12 videos posted over three months.
For where the top 1% of videos starts by video age, see how many views is viral.
Views by category
Virev builds a creator profile with a category for some accounts, and 67,248 accounts in the sample have one. Those accounts lean toward creators that brands search for, and their median video gets 1.55 times the median of all accounts in the same band. So we compare each category with profiled accounts of the same size, and give the median video for creators with 10,000 to 100,000 followers.
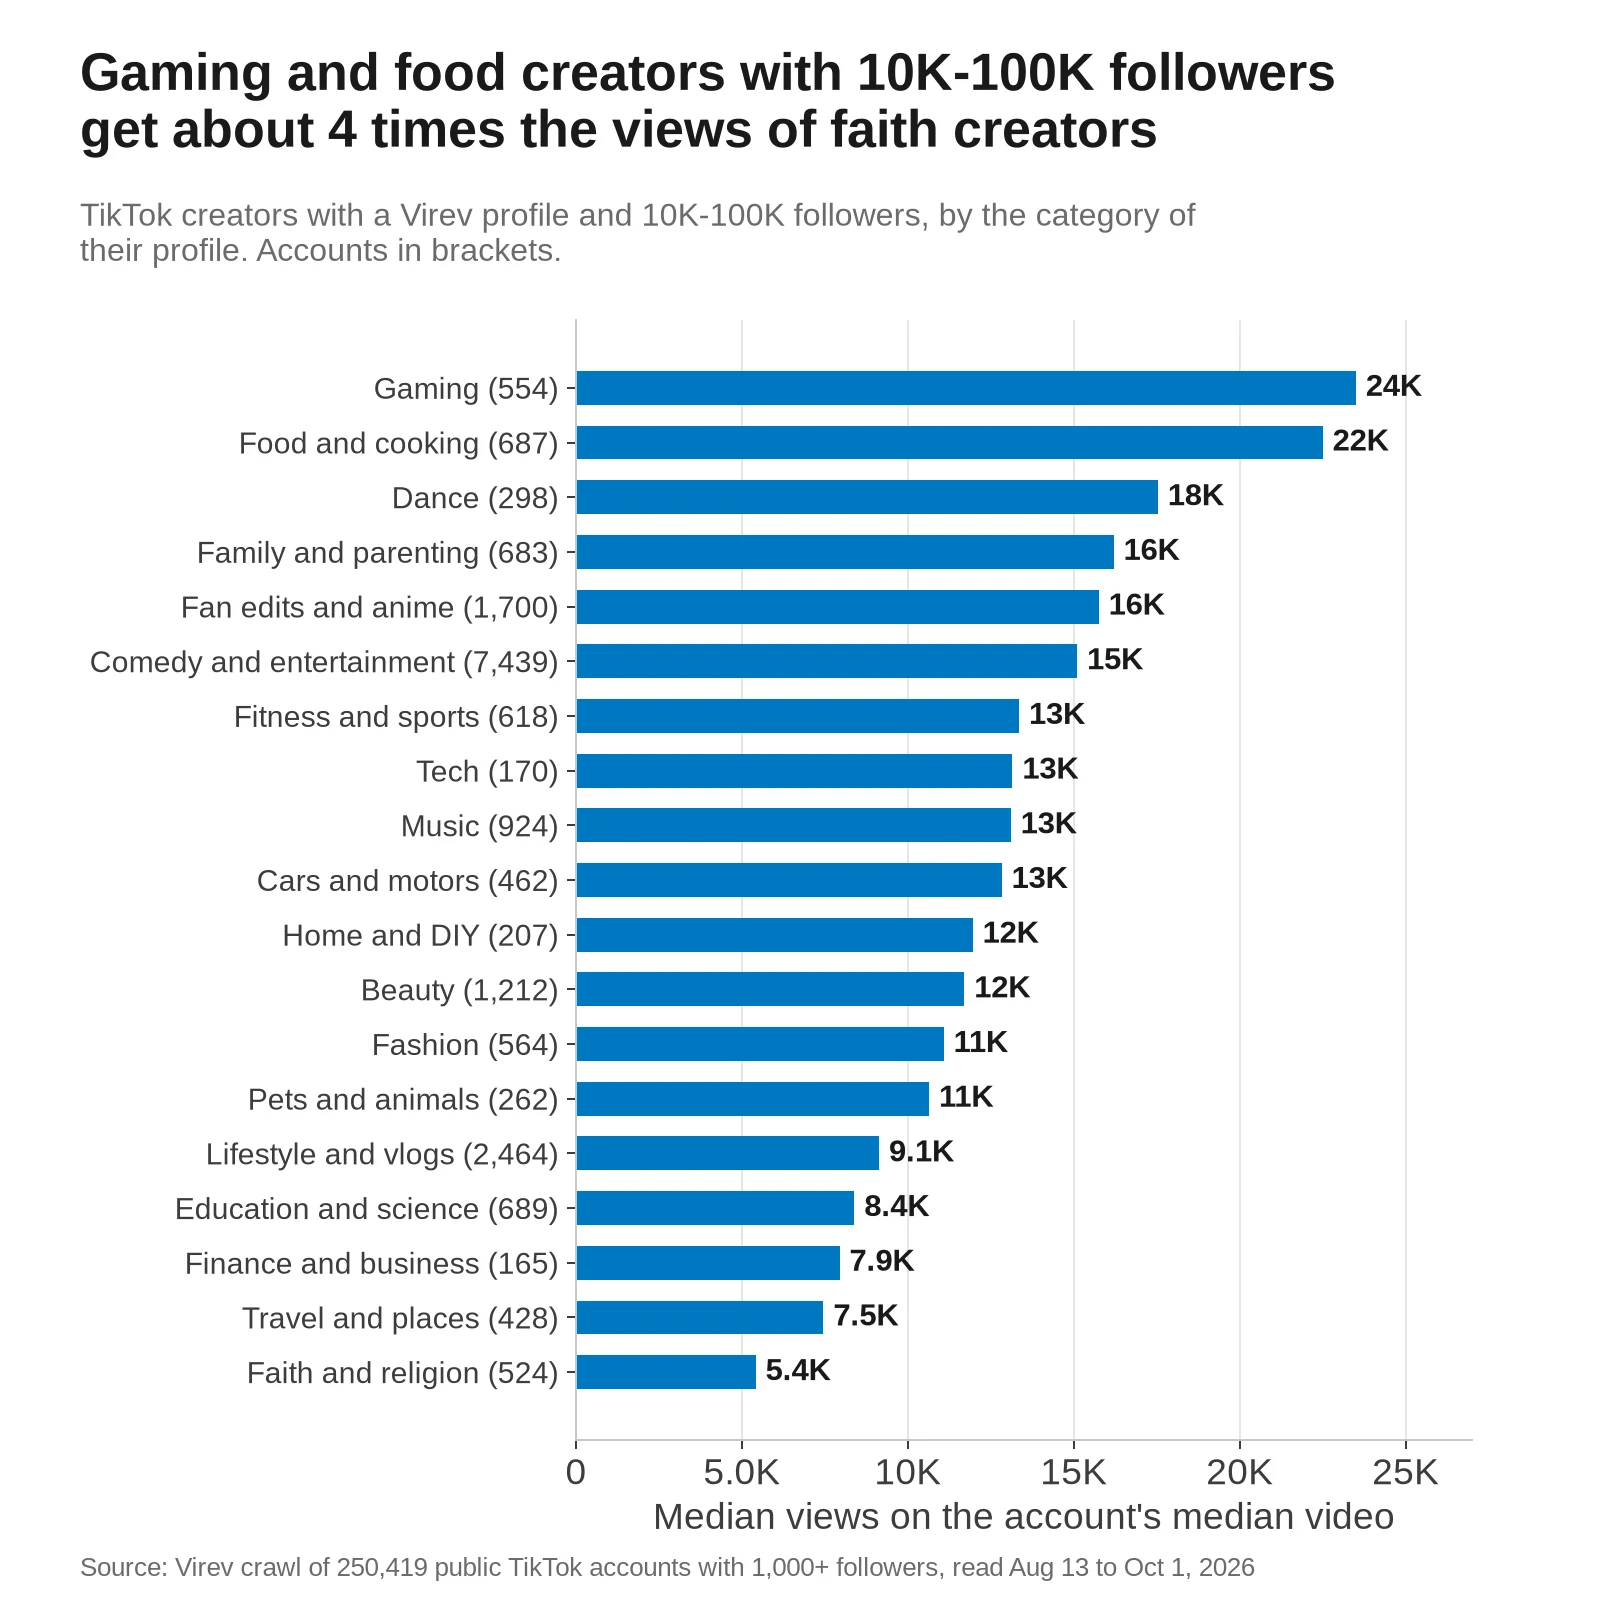
- Gaming creators with 10,000 to 100,000 followers had a median video of 23,500 views, and food creators 22,500. Faith and religion creators had 5,413, about a quarter of that.
- Against profiled accounts of the same size across all bands, gaming creators got 1.70 times the median and food creators 1.50 times. Faith and religion creators got 0.39 times, and finance and business creators 0.57 times.
- Fan edit and anime accounts had the widest gap between average and median, 3.60 times in the median account. Their views depend most on one hit.
Views by creator country
Virev's profile names the creator's country for 54,997 of the accounts. This is where the creator is based. It says nothing about where the viewers are. The table shows the 10 countries with the most profiled accounts, plus Japan and the United Kingdom.
| Creator country | Profiled accounts | Median video at 10K-100K followers | Against profiled accounts of the same size | Median views per follower |
|---|---|---|---|---|
| Japan | 829 | 48,350 | 3.45x | 110.4% |
| Vietnam | 2,097 | 29,325 | 1.94x | 67.9% |
| Turkey | 1,695 | 28,900 | 2.50x | 137.7% |
| Indonesia | 3,314 | 18,250 | 1.41x | 54.9% |
| Thailand | 1,674 | 16,150 | 1.14x | 35.2% |
| United Kingdom | 731 | 13,800 | 1.03x | 34.3% |
| Pakistan | 1,941 | 13,750 | 0.94x | 38.8% |
| Russia | 2,938 | 11,885 | 0.85x | 43.9% |
| Philippines | 2,603 | 8,579 | 0.68x | 28.2% |
| Brazil | 3,156 | 7,749 | 0.60x | 20.1% |
| Mexico | 2,251 | 7,501 | 0.74x | 26.9% |
| United States | 3,567 | 7,068 | 0.75x | 21.2% |
- Of the countries in the table, creators in Japan, Turkey and Vietnam got the most views for their size. The median Turkish account got 1.38 times its follower count on a typical video.
- Creators in the United States, Mexico and Brazil got about 0.6 to 0.75 times the median for their size. A US creator with 10,000 to 100,000 followers had a median video of 7,068 views.
How to calculate average TikTok views
- Open the account and take its latest 12 videos that are at least 7 days old. Skip pinned videos, because TikTok shows them first whatever their date.
- Write down the view count under each video. TikTok rounds counts above 10,000, such as 45.3K.
- Sort the 12 counts. The median is the middle value, or the mean of the two middle values for an even count.
- The average is the sum divided by 12. Divide it by the median. Above 2, the average rests on one or two videos.
- Divide the median by the follower count to get views per follower, and compare both numbers with the band tables above.
Tools do not agree on which number they call average views. Modash takes the mean of a set of recent videos, 10 in its example. HypeAuditor removes outliers and takes the median of what is left. Sup averages up to 15 videos and shows the median beside it. Check which one a tool reports before you compare it with a benchmark. The calculator on this page reports both and places the median against 250,419 accounts.
How these numbers compare with other benchmarks
- Sup's calculator page gives a median of 1,793 views for creators with 10,000 to 100,000 followers and 15,800 for 100,000 to 500,000. Those are posts that featured a brand, 968 and 505 posts per tier, so they sit below everyday videos. Our everyday medians for those sizes run from 5,490 to 38,100.
- Heist quotes Socialinsider's 2025 data for brand accounts: 350 views per post at 1,000 to 5,000 followers, 3,240 at 10,000 to 50,000 and 34,900 at 100,000 to 1 million. We removed brand accounts, and our creators got 1,327 at 1,000 to 5,000.
- Viewlify measured 659 creators and found a median of 717 views at 1,000 to 10,000 followers, 9,481 at 10,000 to 100,000 and 617,800 above 1 million.
- HypeAuditor's "average" range is 580 to 3,500 views for 10,000 to 50,000 followers and 32,000 to 280,000 above 1 million. Modash's "average" range for 10,000 to 50,000 is 363 to 3,000. Neither page gives a sample size.
- AdManage cites Metricool's 2026 figure of about 32,895 views per video over 2,314,756 posts, a mean across posts, which sits between our typical account (8,007) and our mean of all videos (174,544).
Our medians are higher than the creator-tool ranges for mid-size accounts. Our crawler collects accounts for creator marketing, so it holds more active creators than TikTok as a whole, and no account under 1,000 followers.
What to do with this
For creators
- Track your median of the last 12 videos, not your average. One hit can double your average and tells you little about the next video.
- Compare your median with the band table. A median above the 75th percentile for your follower count is a top-quarter account.
- Wait a week before you judge a video, and compare it with your own videos of the same age.
- For when a video counts as a breakout, see how many views is viral. For what views pay in the Creator Rewards Program, see how much TikTok pays per 1,000 views.
For brands
- Plan a sponsored video on the creator's median, and treat the average as an upper bound. 7 in 10 videos miss the average.
- If a creator's average is more than 5 times the median, ask which video carries it and when it was posted. A quarter of accounts, 24.7%, have that shape.
- A large account with a median in the hundreds, as with Soflofooodie and Andy Dooley above, needs the creator's own analytics before a booking.
- Search TikTok creators with 10,000 to 100,000 followers in Virev. Virev creator search covers 180M+ creators and shows each one's recent videos with views, so you can sort a shortlist by median views before you contact anyone.
Questions about average TikTok views
What are average TikTok views per video?
The typical TikTok account with 1,000 or more followers gets 8,007 views on its median video, in Virev's 2026 study of 250,419 accounts. In the typical account, the average of the latest 12 videos is 2.0 times the median. Across all 2,916,335 videos the mean is 174,544, pulled up by viral videos, and the median video got 8,878.
How many views per follower is normal on TikTok?
The median account's typical video gets views equal to 27% of its followers. The share falls with size, from 62.9% at 1,000 to 5,000 followers to 14.6% at 100,000 to 250,000 and 6.6% at 1 million to 5 million.
What are average TikTok views for 10K followers?
For accounts with 10,000 to 25,000 followers, the median video of the median account got 5,490 views. The middle half of those accounts ran from 1,512 to 19,200, and the average of 12 videos for the median account was 24,803.
Why are my TikTok views lower than my followers?
Most accounts get fewer views than followers on most videos. The median account in our sample was under its follower count on 10 of its 12 latest videos, and above 500,000 followers it was under on all 12. TikTok's For You feed decides most views, and it does not show every video to every follower.
Is there a free TikTok average views calculator?
The calculator on this page runs in your browser, with no sign-up, and nothing you type leaves the page. Type the view counts of the latest videos and the follower count, and it shows the median, the average and where the median sits among accounts of the same size.
How we measured, and what can be wrong
- The sample is every public TikTok account with 1,000 or more followers that Virev's crawler read between August 13 and October 1, 2026 and that had at least 6 videos with a view count in the sample. That is 250,419 accounts. The export is the one behind our TikTok engagement rate benchmarks.
- For each account we kept up to the 12 latest videos posted 3 to 180 days before the read. Videos were posted February 15 to September 27, 2026. That is 2,916,335 videos.
- We removed accounts that Virev's profile model labels as brands, businesses, media, organizations or government. Accounts with no profile stay in.
- An account's median is the middle of its videos' view counts, and its average is their mean. Band figures are percentiles across accounts, never a mean across accounts.
- The held-out test compares every video with the median and the average of the same account's other videos, and counts each account once, so each share is the chance that one random video beats the rest of its account.
- The age comparison takes, for each account, the median views of its videos in an age group and divides it by the median of its own videos read 3 to 13 days after posting. The median video in the sample was 13 days old at the read.
- Follower counts are from the same read as the videos. A viral video can add followers after it is posted, so views per follower runs a little low for accounts that grew.
- TikTok shows views above 10,000 rounded, such as 2.8M, and we store them as shown.
- Categories come from Virev's creator profile, grouped into 19 categories by keyword, and countries from the same profile. Both cover only profiled accounts, which lean toward accounts brands search for, so we compare them with profiled accounts of the same size.
- The named accounts were read again on October 26, 2026 through Virev's crawler, which reads public TikTok pages, and their profiles were opened signed out in a browser. Their follower counts on that day matched the crawler read.
- Our crawler collects accounts for creator marketing, so the sample holds more active creators than TikTok as a whole, and no account under 1,000 followers.
Download the data
The tables behind every chart are in one CSV: average-tiktok-views-2026.csv. Each row has a table name and a group. The tables are views_by_follower_band (percentiles of account median views, the median account's average, average over median, views per follower and the shares under followers), next_video_vs_own_median_and_average, views_by_age_at_read_same_account, category, country and verified_badge. Please cite "Virev, October 2026" and link this page.
Sources
- TikTok Average Views Calculator
- Free TikTok Average Views Calculator
- TikTok Average Views Calculator
- Average TikTok Views in 2026 (By Account Size + Content Type)
- Average TikTok Views: 2026 Data & Calculate Yours
- What Is A Good View Rate For TikTok? (2025 Benchmarks)
- How Many Views Is Good on TikTok? By Followers
- Jess (@jesssaay01), Spider-man Inspo
- Soflofooodie (@soflofooodie)
- Lil Baby (@lilbaby)
- Eyüp Yalçın (@pastrychef_tr)