



Ads that brands run from a creator's account stay live twice as long as the typical brand-only ad. In Meta's Ad Library, partnership ads that show a partner's account ran a median of 12 days, against 6 days for brand-only ads. 25.5% of them were still running after 30 days, against 16.1%. Most of that gap comes from which advertisers use the format. The brand-only ads of the same advertisers ran a median of 10 days, so the partnership label itself goes with about 2 more days.
A partnership ad is Meta's format for ads that a brand runs with a partner, and it shows two accounts. Meta's help page says partnership ads "allow advertisers to run ads with partners: creators, brands, and other businesses". We found 3,492 of them that show a partner's account above the ad, from 306 advertisers and 1,005 partner accounts, among 647,954 Facebook and Instagram ads that link to EU or UK sites and started from April 1 to June 30, 2026. 78.4% of them showed an account that Meta lists as a personal profile, a creator, a blogger, a public figure or another kind of person.
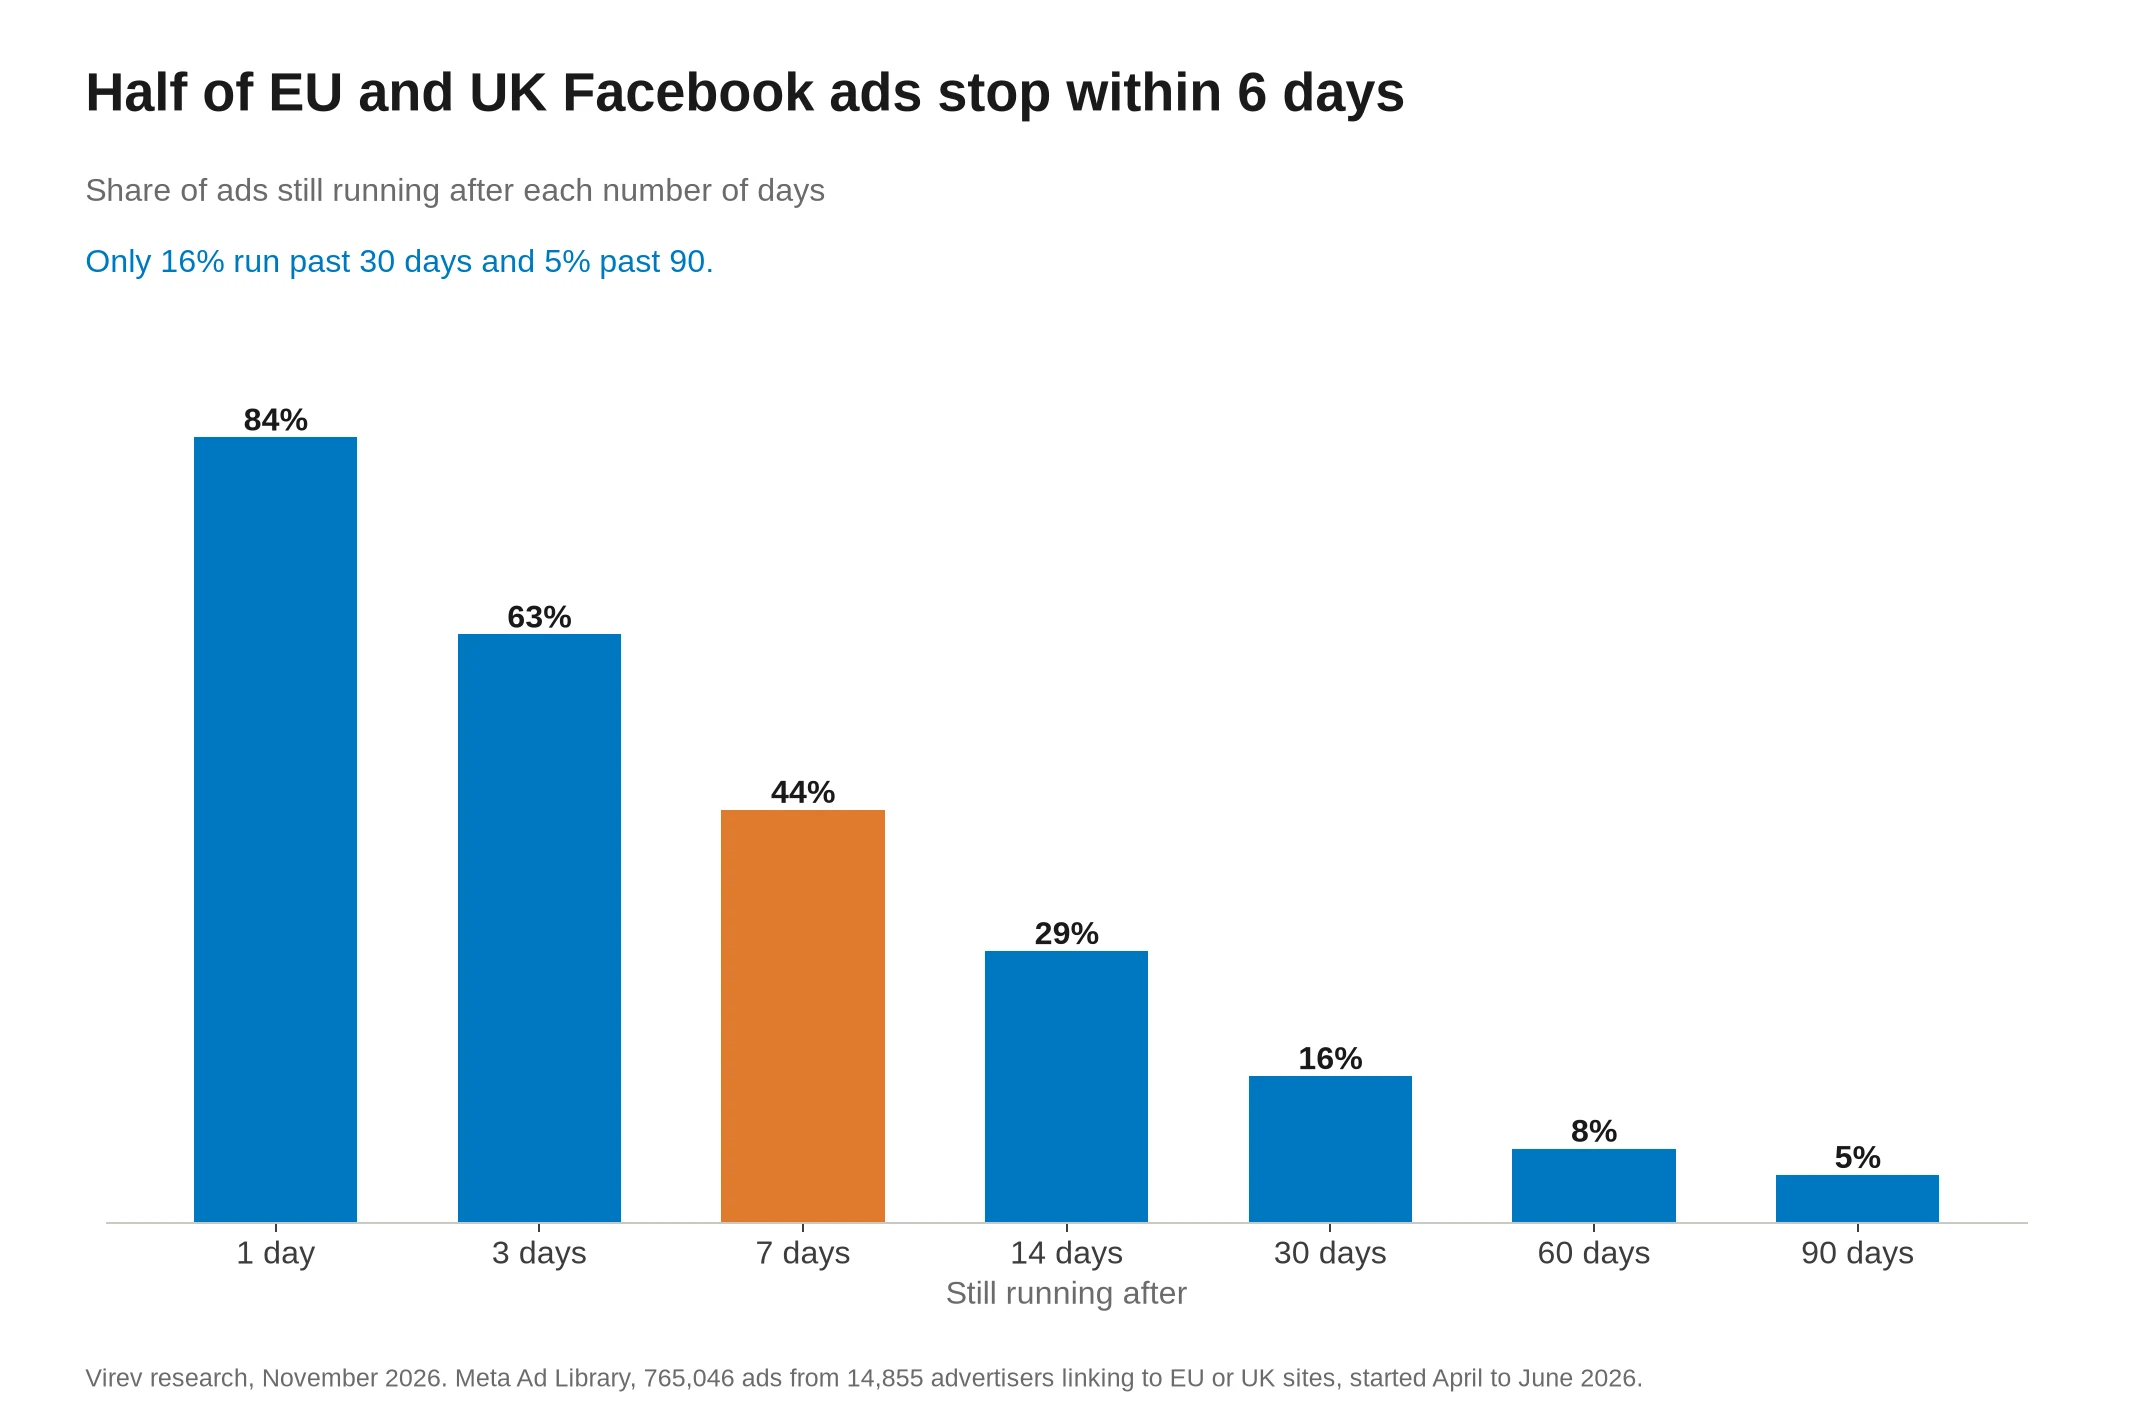
The same sample answers the wider question of how long Facebook ads run. Of all 765,046 ads from 14,855 advertisers that we followed until November 4, half stopped within 6 days. 16.3% stopped on the day they started, 37.3% within 3 days and 56.0% within a week. 15.7% were still running after 30 days and 5.1% after 90 days.
The pages that rank for this question give rules of thumb. Agencies and course sellers say to let an ad run 48 hours, 3 to 7 days, or "a minimum of 2 weeks", and Meta's pricing page suggests "a duration over six days". None of them measures how long real ads run. This study reads the start and end dates that Meta publishes for every ad in its Ad Library, so it shows what advertisers do, not what they are told to do.
12 days
Creator partnership ads
6 days
Brand-only ads
25.5%
Past 30 days
Creator partnership ads run 12 days, brand-only ads run 6
The Ad Library's data names a second account on every partnership ad. We sorted the 14,514 partnership ads in the sample by which account shows above the ad.
- 3,492 ads showed a partner's account above the ad, while the library lists the ad under the advertiser's Page, and this is the layout a brand gets when it runs a creator's post as an ad.
- 10,989 ads showed the advertiser's own Page above the ad and named a second Page as the partner.
- 33 ads fit neither layout.
This study calls the first group creator partnership ads, and a brand-only ad is an ad that names no partner.
| Ads | Ads | Advertisers | Median days | Past 7 days | Past 30 days | Past 90 days |
|---|---|---|---|---|---|---|
| Creator partnership ads | 3,492 | 306 | 12 | 62.2% | 25.5% | 6.6% |
| Partnership ads on the brand's Page | 10,989 | 418 | 4 | 36.6% | 5.2% | 1.5% |
| Brand-only ads | 633,440 | 13,912 | 6 | 44.3% | 16.1% | 5.3% |
| All ads in the comparison | 647,954 | 14,010 | 6 | 44.3% | 16.0% | 5.2% |
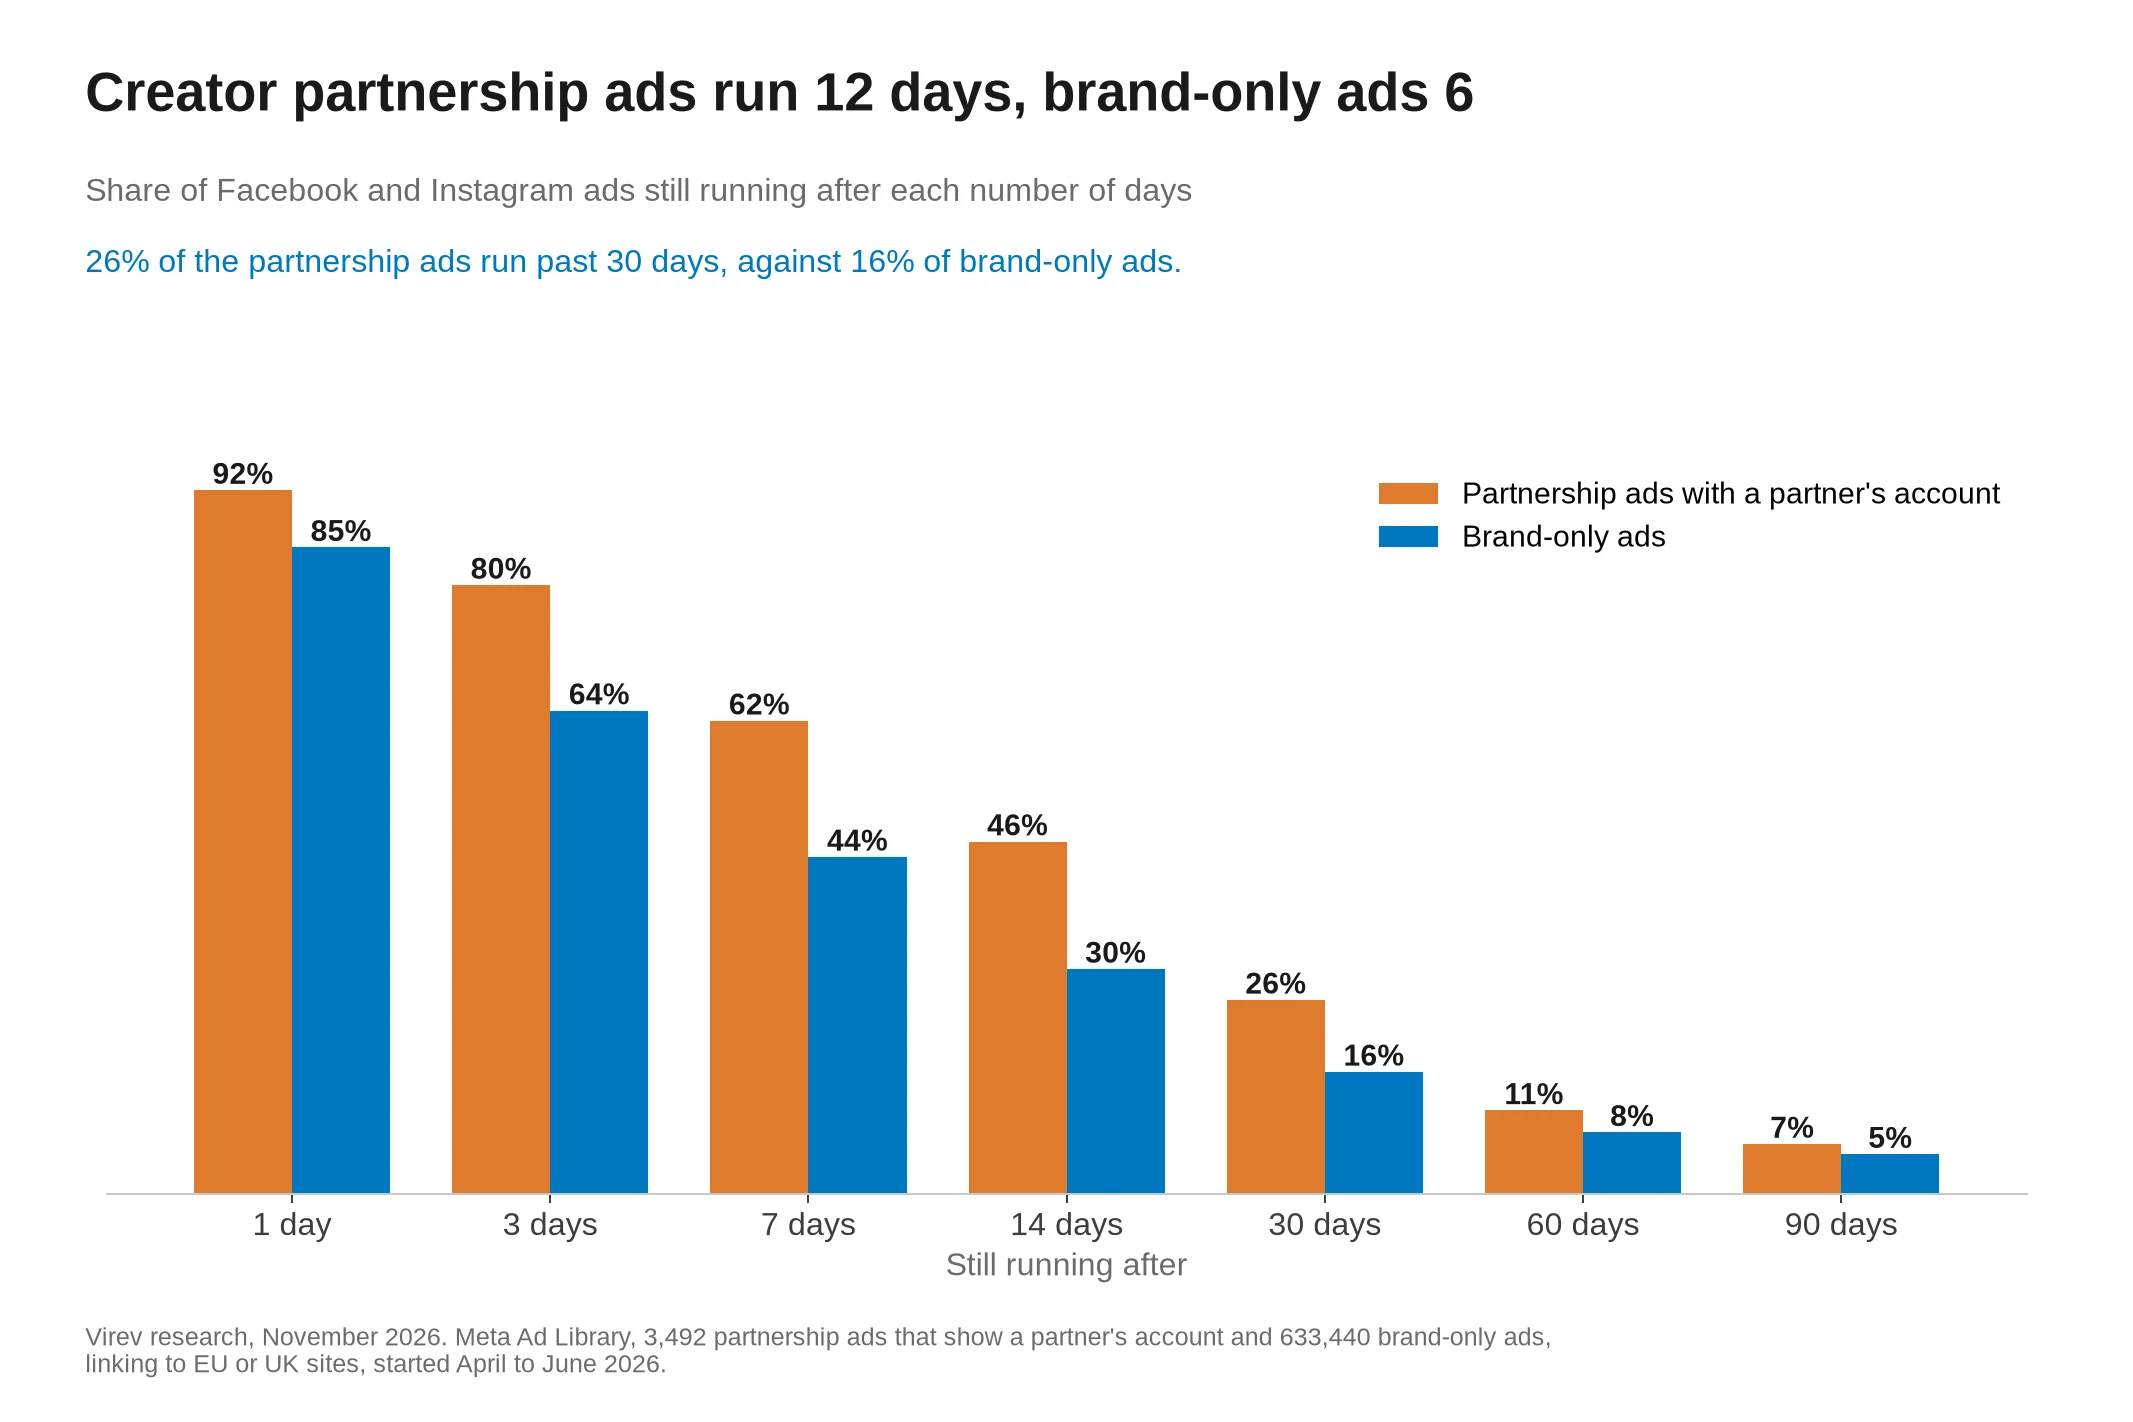
Creator partnership ads ran a median of 12 days, twice the 6 days of brand-only ads. 20.0% of them stopped within 3 days, against 36.5% of brand-only ads, and 62.2% were still running after a week, against 44.3%. The gap narrows for the longest runs: 6.6% passed 90 days, against 5.3%.
Who the partners are
The 3,492 creator partnership ads showed 1,005 partner accounts, and 1,251 of the ads showed an Instagram account. Meta gives each account a category. In 2,737 of the ads (78.4%), the partner's category was a kind of person, such as a personal profile, a digital creator, a personal blog, a blogger, a public figure, an artist or an athlete. The other 755 ads showed magazines, news sites, shops, venues and other businesses.
| Partner's category | Ads | Advertisers | Partner accounts | Median days | Past 30 days |
|---|---|---|---|---|---|
| A person or a creator | 2,737 | 256 | 781 | 13 | 26.7% |
| A business or a publisher | 755 | 129 | 224 | 10 | 21.5% |
Ads with a person as the partner ran a median of 13 days, and ads with a business or a publisher as the partner ran 10. The library does not say whether an account is a creator, so the category is our best reading of it.
149 of the 306 advertisers ran ads with 2 or more partner accounts, and the median partner account appeared in 2 ads of one advertiser. 85.9% of creator partnership ads were video, against 33.0% of brand-only ads.
The same advertisers run their own ads for 10 days
Advertisers that run creator partnership ads also run their other ads longer than most. The brand-only ads of the same advertisers (43,676 ads from 290 of the 306) ran a median of 10 days, and 23.1% of them passed 30 days. So most of the gap to the 6-day median comes from which advertisers use partnership ads, and 2 days remain between the two kinds of ad for the same advertisers.
132 advertisers had 5 or more ads of each kind. Their creator partnership ads ran a median of 14.75 days and their brand-only ads 13 days, taking each advertiser's own median. The partnership median was longer for 59.8% of those advertisers, shorter for 34.8% and the same for 5.3%.
For the 139 advertisers with 5 or more creator partnership ads, the typical advertiser's creator partnership ad ran a median of 15 days. The typical advertiser's ad in the whole sample ran 9.5 days.
Creator partnership ads run longer at every Page size
| Advertiser's Page likes | Ads | Advertisers | Median days | Past 30 days | Brand-only days | Brand-only past 30 |
|---|---|---|---|---|---|---|
| Under 1K | 698 | 63 | 8 | 22.8% | 3 | 10.7% |
| 1K to 10K | 1,097 | 86 | 10 | 26.0% | 7 | 17.5% |
| 10K to 100K | 836 | 96 | 12 | 25.2% | 9 | 20.2% |
| 100K to 1M | 526 | 41 | 15 | 24.1% | 11 | 23.3% |
| 1M+ | 335 | 20 | 22 | 32.8% | 13 | 21.5% |
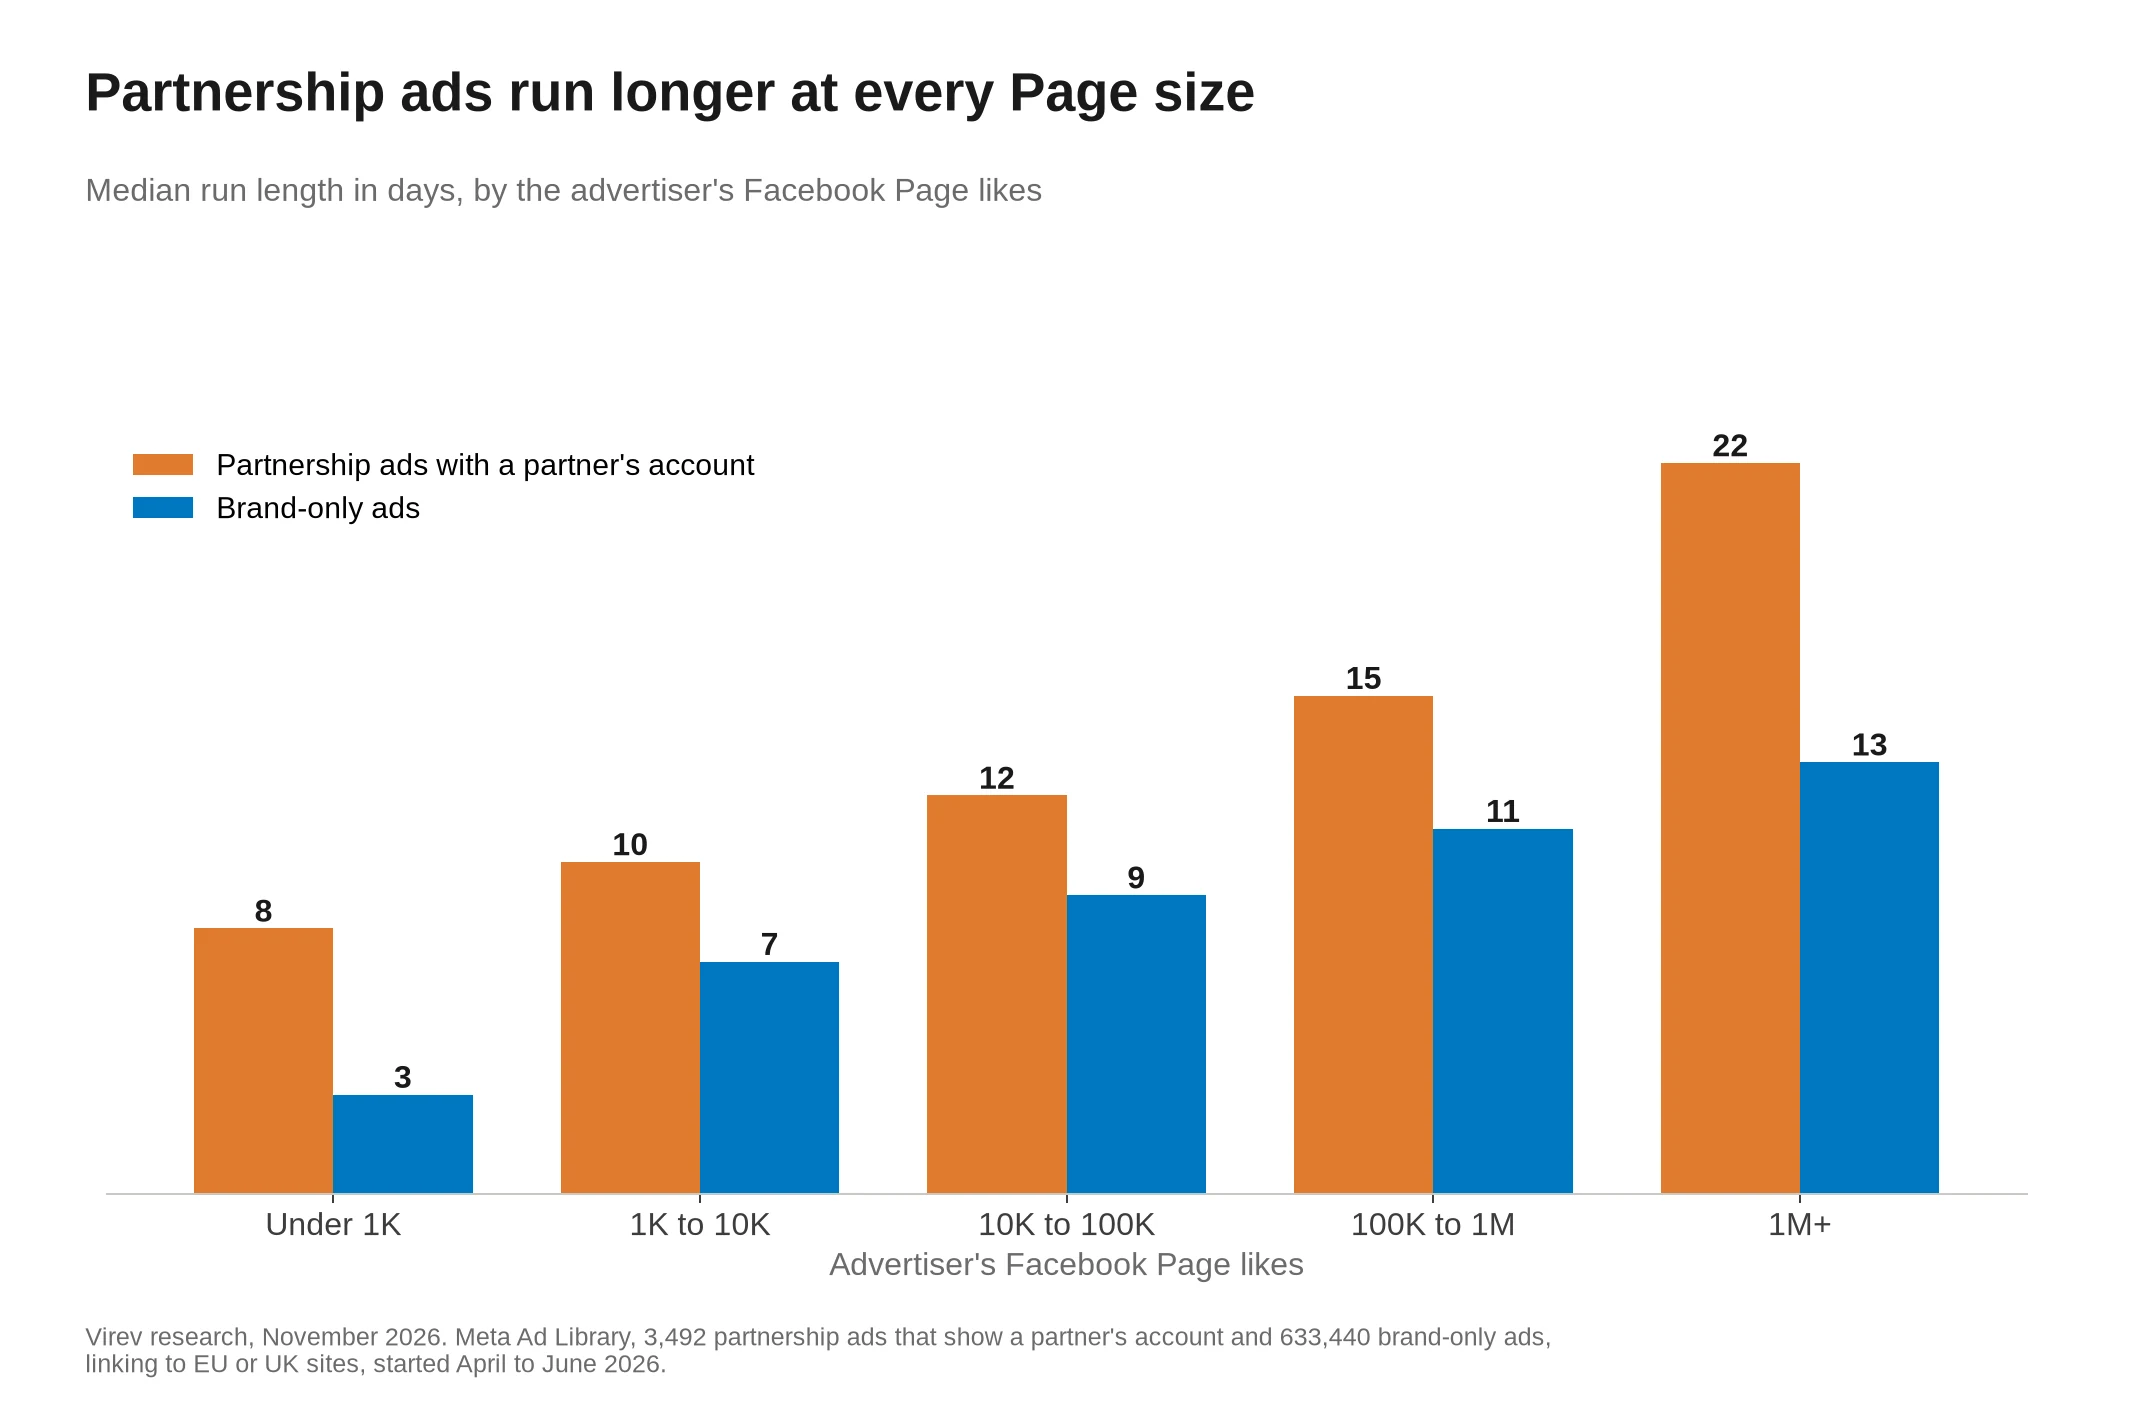
The first four number columns describe creator partnership ads, and the last two give the median days and the share past 30 days of brand-only ads. The partnership median was 3 to 9 days longer than the brand-only median in every tier. The 1M+ row holds 335 ads from 20 advertisers, so read its 22 days as a rough number.
Video partnership ads run 12 days, other video ads 4
| Format | Ads | Advertisers | Median days | Past 30 days | Brand-only days | Brand-only past 30 |
|---|---|---|---|---|---|---|
| Video | 3,001 | 266 | 12 | 25.1% | 4 | 12.6% |
| Dynamic creative | 297 | 41 | 13 | 30.6% | 10 | 22.3% |
| Carousel | 114 | 42 | 11 | 25.4% | 5 | 12.0% |
| Image | 75 | 19 | 9 | 26.7% | 5 | 13.8% |
Video is where the two differ most. A video ad with a partner's account ran a median of 12 days, and a brand-only video ad ran 4. The carousel and image rows hold 114 and 75 ads, so they are rough.
Ten advertisers placed most of the other partnership ads
The 10,989 partnership ads on the advertiser's own Page ran a median of 4 days, shorter than brand-only ads. Ten advertisers placed 8,423 of them (76.7%), and those ads ran a median of 3 days. Seven of the ten are shop Pages that each named one other shop Page as the partner on all of these ads, and those seven placed 8,020 of them. The other 408 advertisers placed 2,566 such ads, which ran a median of 10 days, and 17.5% of them passed 30 days.
Creator partnership ads are less concentrated. Their ten largest advertisers placed 1,194 of the 3,492 ads (34.2%), and the ads of the other 296 advertisers ran a median of 15 days.
All 14,514 partnership ads together ran a median of 5 days, and 10.2% passed 30 days. That number mostly describes a few shop advertisers, so we report the two layouts apart.
Half of the ads stop within 6 days
The rest of this study covers all 765,046 ads, with and without a partner. We counted, for each number of days, the share of ads that ran longer than that. An ad's run starts on its first day of delivery and ends on its last, and both days count, so an ad that ran only on the day it started ran 1 day.
| Days since start | Still running | Stopped by then |
|---|---|---|
| 1 day | 83.7% | 16.3% |
| 2 days | 71.2% | 28.8% |
| 3 days | 62.7% | 37.3% |
| 7 days | 44.0% | 56.0% |
| 14 days | 29.0% | 71.0% |
| 30 days | 15.7% | 84.3% |
| 60 days | 7.9% | 92.1% |
| 90 days | 5.1% | 94.9% |
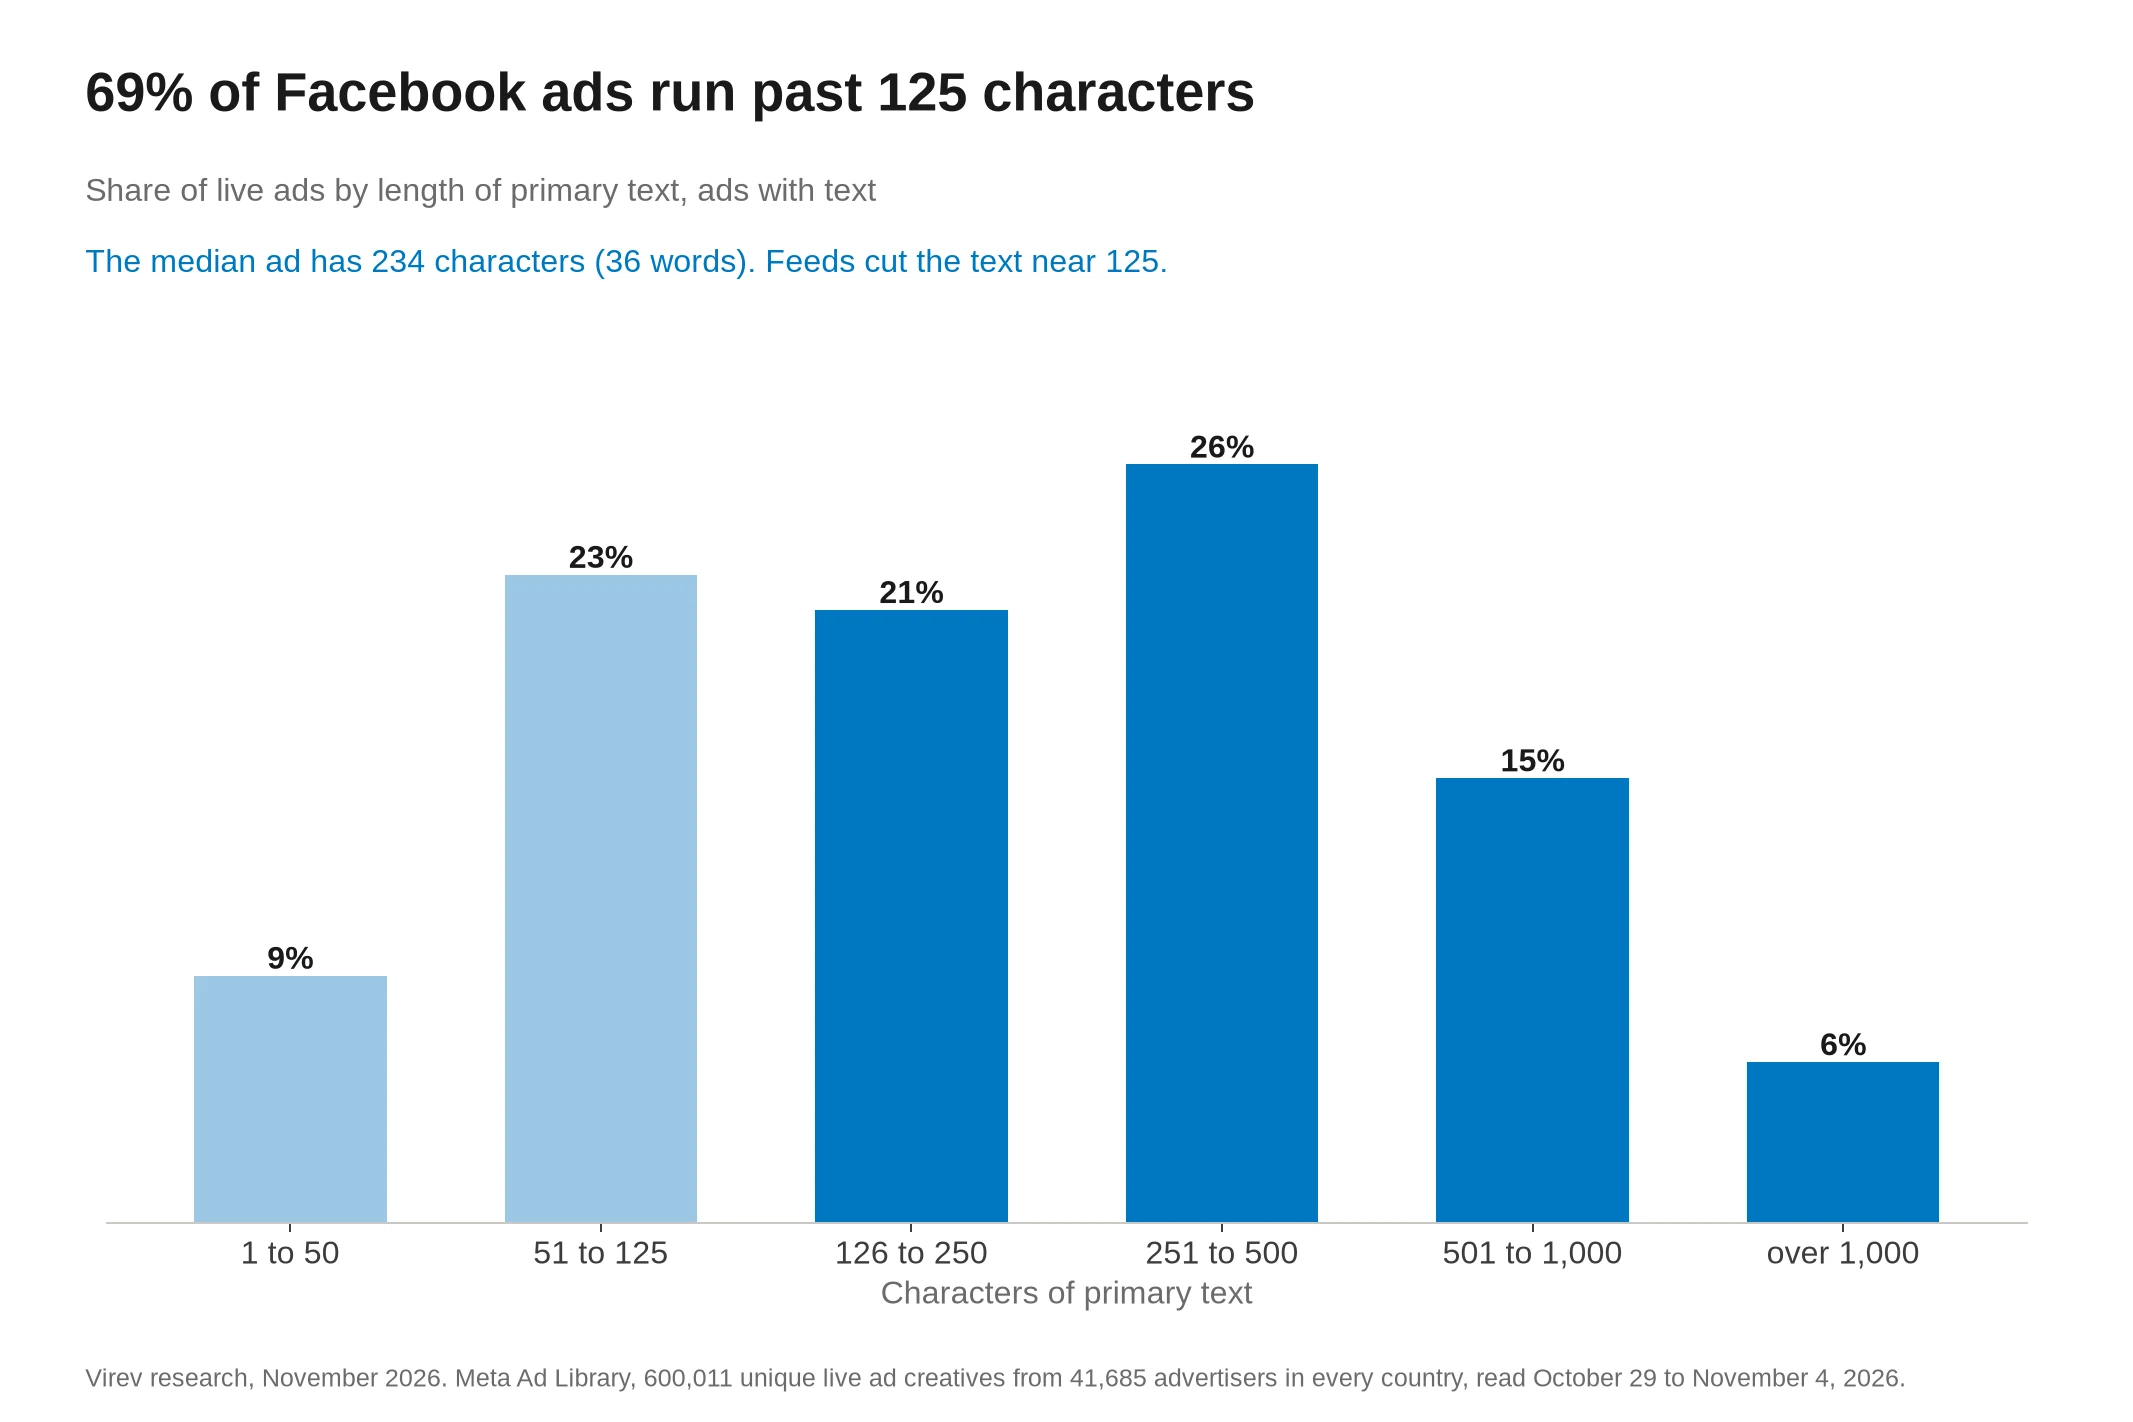
In the tables below, "Ended by day 3" is the share of ads that stopped within 3 days, and "Past 30 days" the share that ran longer than 30 days.
The drop is steepest in the first days. 16.3% of ads stopped on their first day and another 21.0% by day 3. After a month, the curve flattens, and the 5.1% of ads that pass 90 days are the ones advertisers kept running.
97.6% of the ads had ended by their last read. The other 2.4% were still live after at least 105 days, so every share in the table up to 90 days is a plain count, with no estimate for ads still running.
The typical advertiser runs ads a little longer
A few advertisers place thousands of short ads, and the top 1% of advertisers in the sample placed 26.0% of the ads. So we also took each advertiser's own median run, for the 9,694 advertisers with 5 or more ads in the sample.
The typical advertiser's median ad ran 9.5 days, and the typical advertiser kept 21.8% of its ads running past 30 days. Read 6 days as the run of a typical ad, and 9.5 days as the run of a typical advertiser's ad.
Video and catalog ads stop soonest, dynamic creative runs longest
| Format | Ads | Advertisers | Median days | Ended by day 3 | Past 30 days | Past 90 days |
|---|---|---|---|---|---|---|
| Video | 260,418 | 8,378 | 4 | 46.7% | 12.1% | 4.2% |
| Image | 176,308 | 8,383 | 6 | 36.1% | 14.0% | 5.4% |
| Dynamic creative | 239,670 | 6,577 | 10 | 25.2% | 21.5% | 6.1% |
| Carousel | 45,821 | 3,828 | 4 | 44.9% | 11.7% | 2.9% |
| Catalog ads (DPA) | 37,319 | 1,676 | 4 | 47.5% | 16.4% | 6.9% |
| Other formats | 5,510 | 1,462 | 7 | 25.9% | 12.9% | 4.4% |
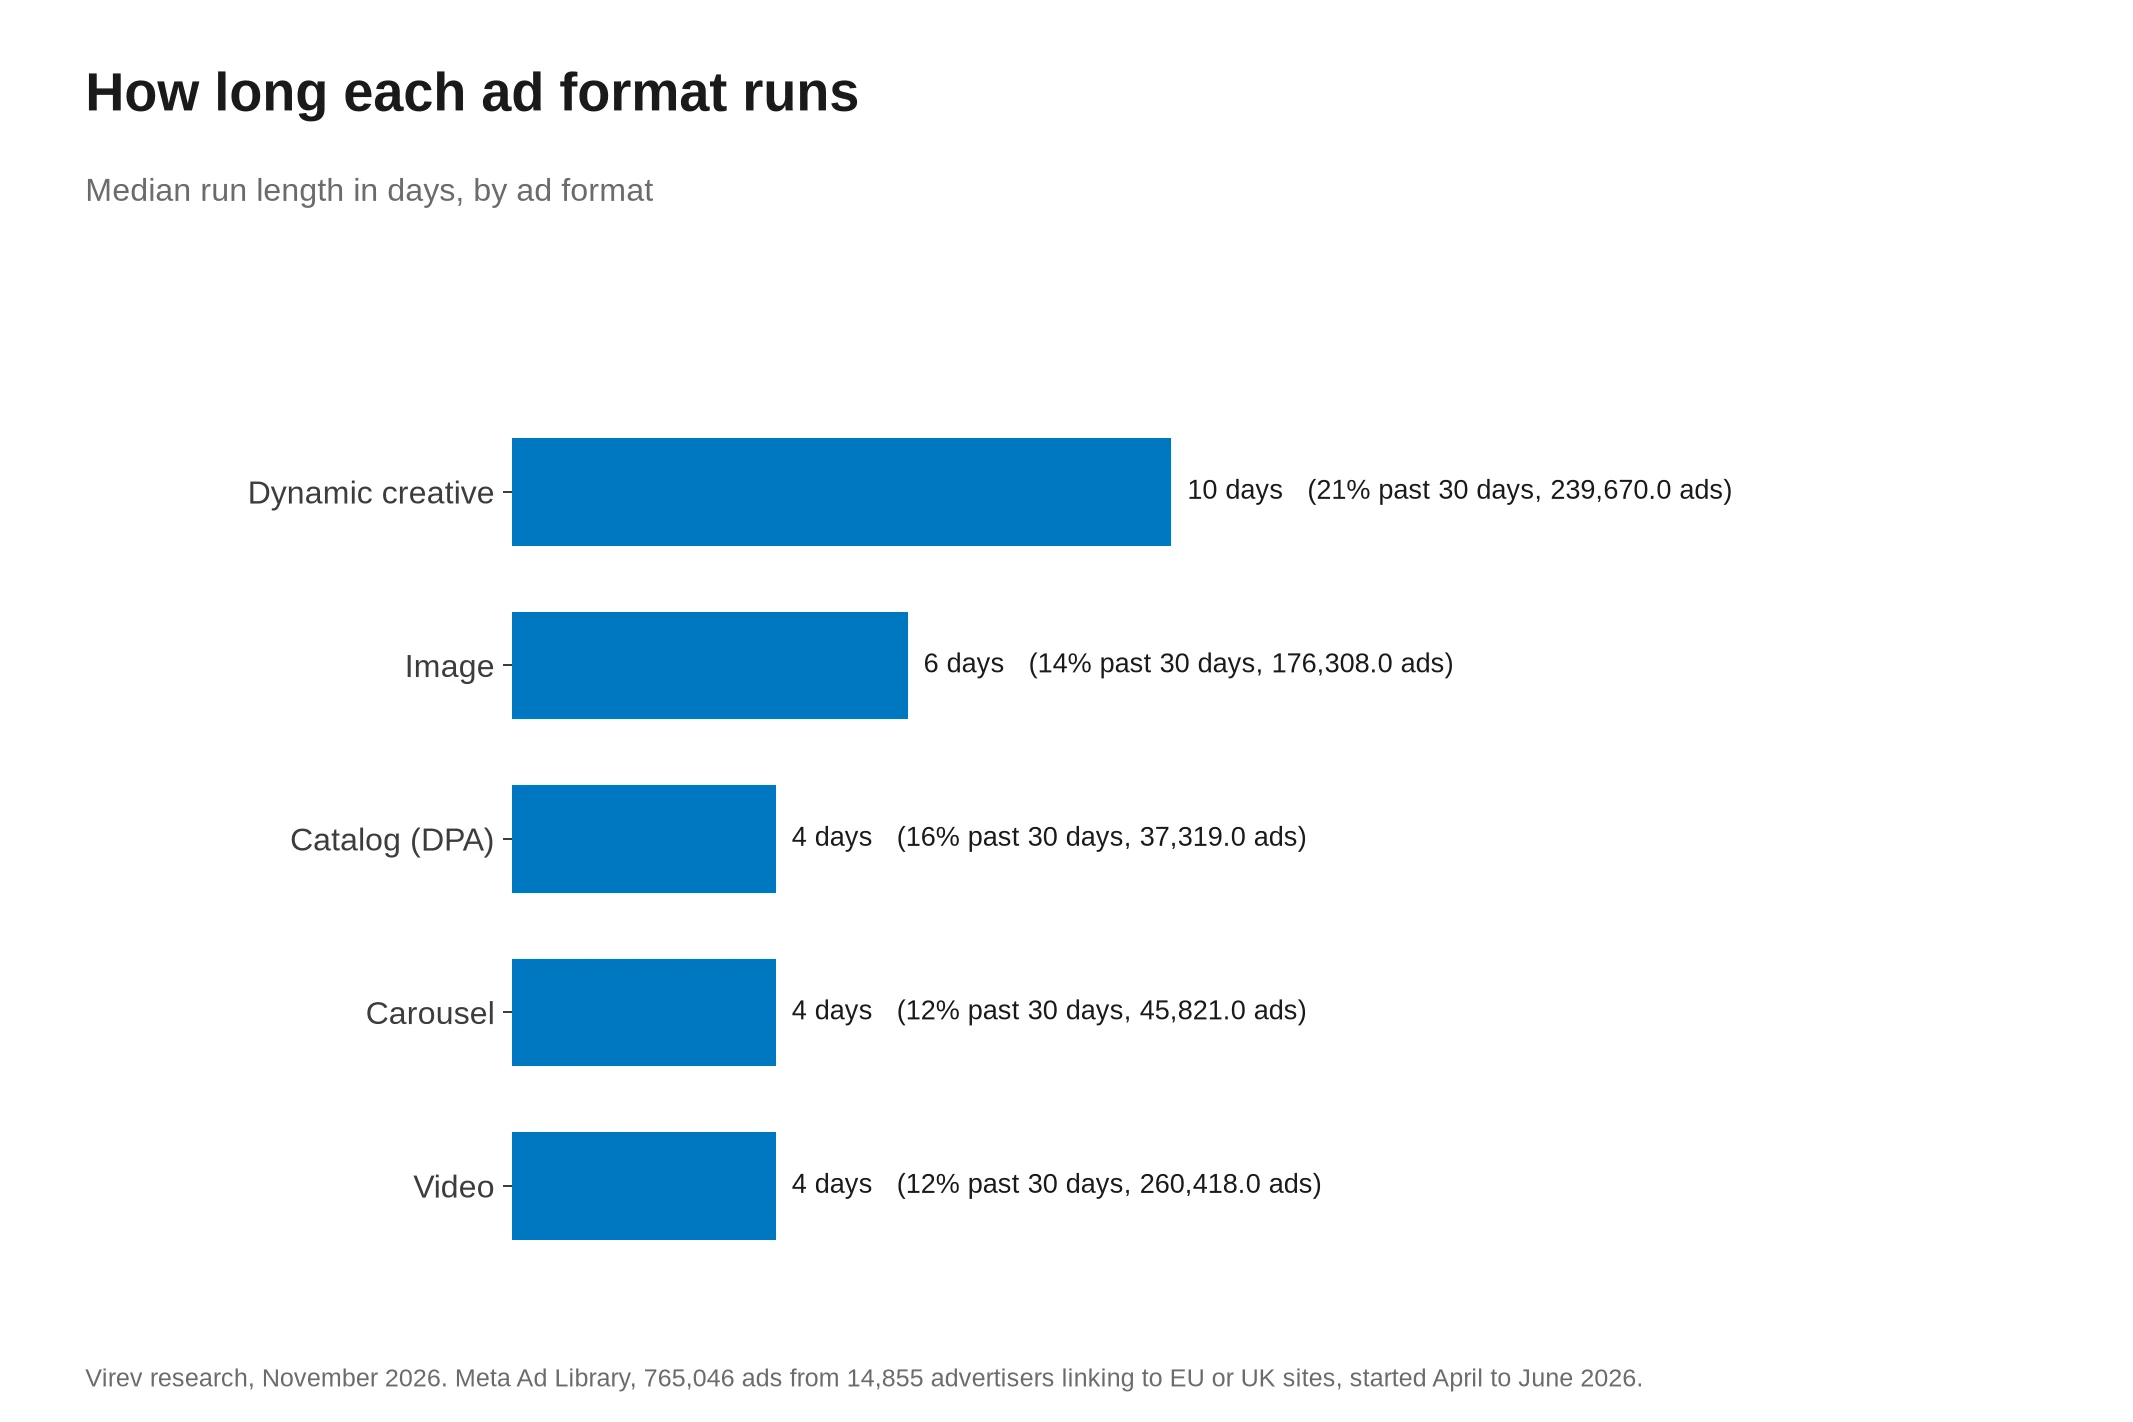
Video, carousel and catalog ads had a median run of 4 days, and 45% to 48% of them stopped within 3 days. Image ads ran a median of 6 days. Dynamic creative ads (DCO), where Meta mixes several images, videos and texts in one ad, ran a median of 10 days, and 21.5% of them were still running after 30 days.
A dynamic creative ad tests its parts inside one ad, so the advertiser has less reason to stop it and start a new one. Video ads may often be one test among many, though the library does not show that.
Ads that show everywhere stop sooner in the first days
| Placements | Ads | Advertisers | Median days | Ended by day 3 | Past 30 days | Past 90 days |
|---|---|---|---|---|---|---|
| Facebook only | 20,228 | 1,256 | 6 | 31.2% | 11.4% | 4.2% |
| Instagram only | 23,545 | 2,063 | 7 | 29.3% | 10.7% | 2.5% |
| Facebook and Instagram | 107,230 | 4,507 | 7 | 30.1% | 17.4% | 4.5% |
| Facebook, Instagram + more | 608,133 | 11,910 | 6 | 39.1% | 15.7% | 5.4% |
| Other placements | 5,910 | 630 | 6 | 38.2% | 11.2% | 3.1% |
Most ads (608,133 of 765,046) ran on Facebook and Instagram and at least one more placement, such as Audience Network, Messenger, Threads or WhatsApp. Those ads stopped within 3 days more often (39.1%) than ads placed on Facebook and Instagram only (30.1%). Medians stayed between 6 and 7 days for every group.
Small Pages stop their ads fastest
We sorted advertisers by their Facebook Page likes at their latest read.
| Facebook Page likes | Ads | Advertisers | Median days | Ended by day 3 | Past 30 days | Past 90 days |
|---|---|---|---|---|---|---|
| Under 1K | 251,559 | 6,498 | 3 | 53.7% | 9.9% | 3.2% |
| 1K to 10K | 243,285 | 5,029 | 6 | 34.0% | 17.2% | 6.1% |
| 10K to 100K | 183,154 | 2,514 | 8 | 25.4% | 19.7% | 6.3% |
| 100K to 1M | 65,972 | 611 | 9 | 21.9% | 21.0% | 6.3% |
| 1M+ | 21,073 | 201 | 8 | 31.2% | 15.2% | 2.9% |
Advertisers with under 1,000 Page likes stopped half their ads within 3 days, and only 9.9% of their ads passed 30 days. From 10,000 likes up, the median sat at 8 to 9 days. The 1M+ Pages ran a median of 8 days, and only 2.9% of their ads passed 90 days, fewer than in the tiers below them.
Ads that share a creative run longer
The Ad Library groups ads that use the same creative and text, and shows how many ads use it. 314,913 ads in the sample shared their creative with at least one other ad.
| Creative | Ads | Advertisers | Median days | Ended by day 3 | Past 30 days | Past 90 days |
|---|---|---|---|---|---|---|
| One ad | 450,133 | 14,556 | 5 | 41.6% | 13.5% | 4.7% |
| Shared by 2+ ads | 314,913 | 8,784 | 8 | 31.1% | 18.7% | 5.8% |
Ads whose creative ran in 2 or more ads had a median run of 8 days, against 5 for an ad with its own creative. We read the number of ads that share each creative at the ad's latest read, so an ad that runs longer has more time to gain copies, and the data does not show which comes first.
Run length by country
The country is the country domain of the site each ad links to, such as .de for Germany or .co.uk for the UK. Countries with 300 or more advertisers:
| Site country | Ads | Advertisers | Median days | Ended by day 3 | Past 30 days | Past 90 days |
|---|---|---|---|---|---|---|
| Germany | 131,132 | 2,172 | 4 | 48.4% | 11.8% | 3.3% |
| United Kingdom | 100,282 | 1,847 | 6 | 39.4% | 15.3% | 4.5% |
| Poland | 62,237 | 1,367 | 7 | 30.2% | 18.6% | 6.1% |
| Italy | 47,722 | 1,063 | 6 | 33.7% | 15.7% | 5.6% |
| France | 65,803 | 1,000 | 5 | 43.9% | 11.4% | 3.8% |
| Netherlands | 46,890 | 956 | 7 | 37.1% | 18.4% | 6.1% |
| Czechia | 29,901 | 699 | 7 | 32.6% | 18.9% | 7.6% |
| Belgium | 17,312 | 664 | 9 | 25.3% | 20.1% | 6.2% |
| Hungary | 19,696 | 607 | 8 | 26.1% | 17.8% | 6.5% |
| Sweden | 36,615 | 546 | 4 | 47.3% | 13.5% | 5.1% |
| Spain | 33,591 | 522 | 4 | 47.5% | 9.9% | 2.4% |
| Denmark | 23,212 | 506 | 9 | 22.8% | 22.0% | 7.2% |
| .eu sites | 30,006 | 500 | 5 | 38.9% | 13.5% | 4.8% |
| Romania | 28,169 | 477 | 6 | 32.1% | 15.6% | 5.6% |
| Estonia | 4,800 | 402 | 7 | 26.3% | 15.8% | 5.7% |
| Greece | 10,308 | 331 | 8 | 26.4% | 18.9% | 5.8% |
| Slovakia | 10,257 | 310 | 9 | 22.5% | 20.5% | 5.9% |
| Austria | 7,388 | 306 | 14 | 18.6% | 29.5% | 9.1% |
| Finland | 8,584 | 300 | 11 | 27.5% | 24.1% | 8.5% |
German, Spanish and Swedish advertisers ran the shortest ads, a median of 4 days. Austrian and Finnish advertisers ran the longest, 14 and 11 days, and Denmark, Belgium and Slovakia sat at 9 days. Each country row reflects which advertisers it holds as much as local habits, so read the rows as a guide.
The median has stayed at 6 days all year
| Start month (2026) | Ads | Advertisers | Median days | Past 7 days | Past 30 days |
|---|---|---|---|---|---|
| January | 200,255 | 8,869 | 6 | 45.2% | 14.9% |
| February | 214,059 | 9,378 | 6 | 46.0% | 14.5% |
| March | 262,617 | 10,046 | 6 | 43.0% | 13.7% |
| April | 252,605 | 9,760 | 6 | 42.4% | 14.9% |
| May | 248,998 | 10,046 | 6 | 45.0% | 16.2% |
| June | 263,443 | 9,860 | 6 | 44.7% | 15.8% |
| July | 221,480 | 9,306 | 7 | 49.8% | 19.3% |
Every start month from January to June 2026 gave a median of 6 days, and the share past 30 days stayed between 13.7% and 16.2%. July shows 7 days, and its row has a shorter follow-up, because the crawl's last read came 3 to 4 months after those starts. The April to June result is not an odd quarter.
The typical advertiser runs 4 ads at once
Live ads show in the Ad Library for every country, so this part covers all 41,685 sampled advertisers with an ad live in the week to November 4, 2026, wherever they are. We counted the ads each one had live at its latest read.
| Live ads at once | Share of advertisers |
|---|---|
| 1 | 22.1% |
| 2 to 5 | 37.6% |
| 6 to 10 | 14.7% |
| 11 to 50 | 19.0% |
| 51 to 250 | 5.8% |
| More than 250 | 0.8% |
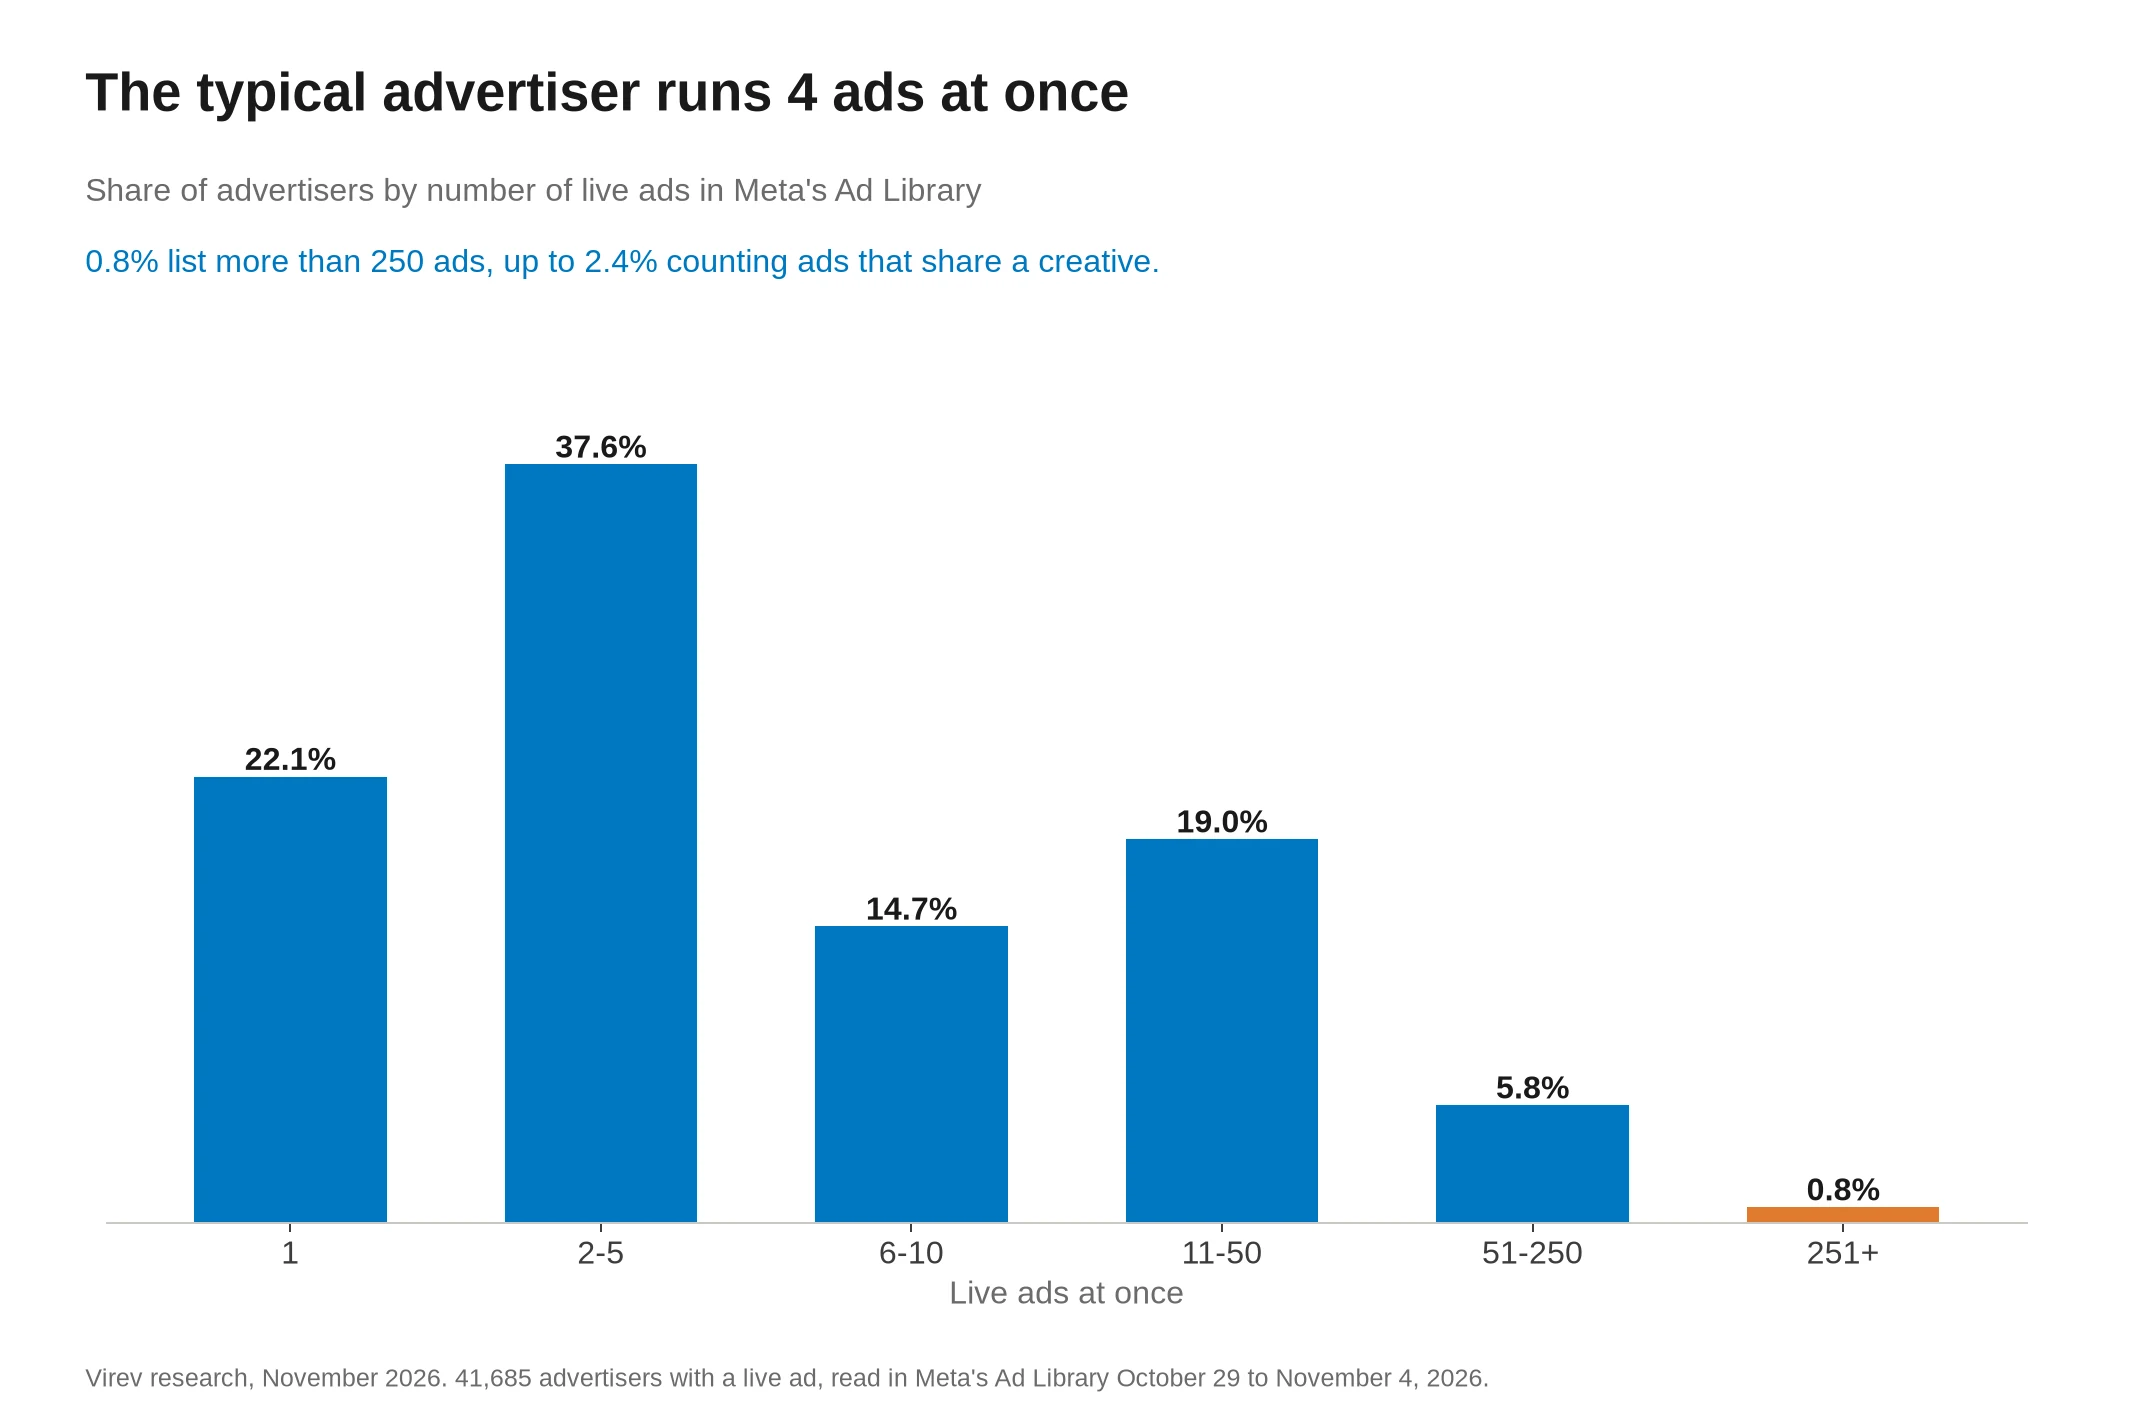
The median advertiser had 4 ads live, and 22.1% had only one. The mean is 16.6, because a few advertisers run hundreds. Meta limits Pages that spend under $100,000 in their highest month to 250 ads, and the limit counts ads, while the library shows one ad for each group of ads that share a creative. 0.8% of advertisers had more than 250 ads in the library's list, and counting every ad in those groups, up to 2.4% had more than 250, so the limit binds few advertisers.
| Facebook Page likes | Advertisers | Median live ads | Only 1 live ad | Over 250 | Median age (days) | Past 90 days |
|---|---|---|---|---|---|---|
| Under 1K | 23,347 | 3 | 24.9% | 0.5% | 11 | 10.9% |
| 1K to 10K | 10,795 | 4 | 20.8% | 0.5% | 20 | 18.8% |
| 10K to 100K | 6,016 | 7 | 16.1% | 1.5% | 23 | 17.8% |
| 100K to 1M | 1,239 | 12 | 11.9% | 3.1% | 17 | 12.8% |
| 1M+ | 282 | 19 | 8.9% | 8.5% | 22 | 13.9% |
| All advertisers | 41,685 | 4 | 22.1% | 0.8% | 16 | 14.6% |
Bigger Pages run more ads at once. Pages with under 1,000 likes had a median of 3 live ads and Pages with 1M+ likes had 19. 8.5% of the 1M+ Pages listed more than 250 ads, and counting every ad that shares a creative, up to 17.0% passed 250, against up to 1.6% of Pages with under 1,000 likes.
How long the ads live today have run
A count of live ads on one day is not the same as the run of new ads, because a long-running ad stays in the count for months while a 2-day ad leaves at once. The live ads in the week to November 4 had been running a median of 16 days, 34.7% had run more than 30 days, 14.6% more than 90 days and 2.0% more than a year.
| Format | Live ads | Share of live ads | Median age (days) | Live past 90 days |
|---|---|---|---|---|
| Video | 307,623 | 44.6% | 13 | 12.6% |
| Image | 208,586 | 30.2% | 16 | 13.6% |
| Dynamic creative | 115,412 | 16.7% | 24 | 19.8% |
| Carousel | 20,478 | 3.0% | 19 | 16.6% |
| Catalog ads (DPA) | 25,926 | 3.8% | 27 | 22.3% |
| Other formats | 11,874 | 1.7% | 12 | 14.8% |
Video was 44.6% of live ads, image 30.2% and dynamic creative 16.7%. Live catalog and dynamic creative ads were the oldest, at a median of 27 and 24 days.
So when you look up a competitor in the Ad Library, most of what you see has run longer than a typical new ad. Their many short tests are mostly gone from the active list.
What to do with this
For creator campaigns
- Ask for usage rights of at least 30 days when you plan to run a creator's post as a partnership ad, because 25.5% of creator partnership ads ran past 30 days and 6.6% past 90.
- Plan about two weeks of delivery for a creator partnership ad, because the median one ran 12 days and the typical advertiser's ran 15.
- Work with more than one creator at a time, because 149 of the 306 advertisers ran ads with 2 or more partner accounts.
- Brief creators for video, because 85.9% of creator partnership ads were video.
For advertisers
- Give a new ad at least 3 days before you judge it, because 37.3% of ads stop within 3 days, well short of the week that Meta's learning phase asks for (about 50 optimization events in a week).
- Do not expect an ad to last, because only 15.7% of ads run past 30 days, and plan new creative every one to two weeks.
- Look at ads that pass 30 days when you plan new ad sets, because only 15.7% of ads get there, and ads whose creative runs in 2 or more ads run 8 days at the median against 5.
- Keep a handful of ads live rather than dozens on a small budget, because the median advertiser runs 4 at once and 74% of advertisers run 10 or fewer.
For competitor research
- Read a competitor's oldest live ads first, because an ad that has run 90 days or more is one of the 5.1% that lasted.
- Expect to see few of a competitor's short tests, because ads that stop within days leave the active list, and outside the EU and the UK they leave the library for good.
Creator partnership ads start with a creator whose audience fits the product. Find creators for partnership ads in Virev creator search, which covers 180M+ creators, and sign up to search them by niche, country and size. For how creators label paid content, see our influencer ad disclosure study and our guide to Instagram's paid partnership label.
How we measured, and what can be wrong
- The data is Meta's Ad Library, which lists each ad with its start date, its last day of delivery, whether it is live, its format and its placements, read by Virev's crawler from October 9 to November 4, 2026.
- The crawler reads advertisers, not keywords. It finds advertiser Pages through name searches and an empty search per country, and then reads each Page's ads, so the advertisers are the ones the crawler found, not all of Meta's advertisers.
- The sample is a random 5% of the advertisers the crawler has read, picked by a hash of the Page id.
- Meta keeps an ended ad in the library for one year only when it reached people in the EU or the UK, and live ads show everywhere. In our crawl, 98.7% to 99.4% of advertisers with .de, .fr, .pl and .uk sites showed ended ads, against 15.9% with .jp sites and 10.9% with .kr sites.
| Advertiser's site domain | Advertisers | Share with ended ads in the library |
|---|---|---|
| Germany (.de) | 2,779 | 98.9% |
| United Kingdom (.uk) | 2,380 | 98.8% |
| France (.fr) | 1,177 | 98.7% |
| Poland (.pl) | 1,702 | 99.4% |
| .com sites | 98,805 | 78.2% |
| United States (.us) | 318 | 86.8% |
| Brazil (.br) | 1,081 | 43.9% |
| Australia (.au) | 758 | 34.0% |
| Canada (.ca) | 401 | 57.9% |
| India (.in) | 330 | 43.6% |
| Japan (.jp) | 289 | 15.9% |
| South Korea (.kr) | 156 | 10.9% |
| Vietnam (.vn) | 143 | 21.0% |
- Counting ended ads outside the EU and the UK would miss most short ads and make the runs look long, so the run-length part keeps only ads that link to a site under an EU country domain, .eu or the UK. Ads with a .com link are not in it, even from European advertisers.
- The run-length cohort is the ads that started from April 1 to June 30, 2026, on Pacific-time dates as Meta shows them, so every ad had at least 101 days between its start and the first read.
- An ad that paused and restarted counts as one run from its first to its last day of delivery.
- The Ad Library shows one ad for each group of ads that share a creative and text, and this study counts the ad the library shows, so an ad here is closer to one creative than to one ad id.
- For 4,863 of the 18,677 cohort ads still live at the last read, Meta's last delivery day was more than 8 days before the read while the ad was still marked active, and we counted their run to the read day. Counting it to their last delivery day instead gives the same 6-day median, 15.5% past 30 days and 4.9% past 90.
- The live-ad count is the ads read as live within 36 hours of each advertiser's latest live read in the week to November 4. An advertiser whose last ad stopped during that week may still count the ads from its earlier read.
- Page likes come from the crawler's latest read of each Page, and for Pages it had not read since October, from the latest value in its database, so some likes are newer than November 4.
- The library's data for an ad names a second account when the ad is a partnership ad, and Virev's crawler has stored that part of each ad since October 21, 2026. So the partnership comparison covers the 647,954 cohort ads (84.7%) that the crawler read on or after that day. Those ads had the same 6-day median as all 765,046, and 16.0% of them ran past 30 days.
- A creator partnership ad here is a partnership ad that shows another account than the advertiser's Page above the ad. The library does not say whether that account is a creator, and 21.6% of these ads showed an account whose category is a business or a publisher.
- We sorted partner accounts into people and businesses by the category Meta shows for the account, matched against a list of person categories in several languages, so a few accounts may sit in the wrong group.
- The comparison is a count, not a test. Advertisers choose which posts become partnership ads, and the advertisers that use them run their other ads longer too, so the 12 days do not show that a partner's account makes an ad last.
- The library does not show spend or results, so this study cannot say whether long-running ads earn more, only that advertisers kept them.
For how many creators brands hire in a year, see how many influencers brands work with.
For how long the text of these ads is, which buttons advertisers pick and whether the copy of long-running ads differs, see our Facebook ad copy statistics.
Frequently asked questions
How long do partnership ads with creators run?
Partnership ads that show a creator's or another partner's account ran a median of 12 days in our data, against 6 days for brand-only ads. 25.5% ran past 30 days and 6.6% past 90. The count covers 3,492 such ads from 306 advertisers that link to EU or UK sites and started from April to June 2026.
How many advertisers run partnership ads?
660 of 14,010 advertisers in our sample (4.7%) ran at least one partnership ad, and partnership ads were 2.2% of the ads (14,514 of 647,954). 306 advertisers (2.2%) ran ads that show a partner's account above the ad.
How long do Facebook ads run on average?
Half of the Facebook and Instagram ads that link to EU or UK sites and started from April to June 2026 stopped within 6 days, and the typical advertiser's median ad ran 9.5 days. 15.7% ran past 30 days and 5.1% past 90.
How long should you run a Facebook ad before you judge it?
Most guides say 3 to 7 days, and Meta asks for about 50 optimization events in a week to finish learning. In our data, 37.3% of ads stopped within 3 days, so many advertisers judge well before a week. A week is a fair first test for most budgets.
How many ads should I run on Facebook at once?
The median advertiser in our data had 4 ads live, 22.1% had one, and 74% had 10 or fewer. Up to 2.4% ran more than 250, Meta's limit for most Pages. Pages with 100,000 to 1M likes had a median of 12 and Pages with 1M+ likes 19.
What is the longest a Facebook ad can run?
Meta lets an ad run with no end date until the advertiser stops it. In our data 2.0% of the ads live in early November 2026 had run more than a year.
Does the Facebook Ad Library show ads that stopped?
Only for ads that reached people in the EU or the UK, which Meta keeps for a year after their last delivery. Elsewhere, an ad leaves the library when it stops, so a competitor's short tests are hard to see.
Download the data
All tables are in one CSV: creator-partnership-ads-run-length-2026.csv. Each row is one group in one table, such as all ads, a format, a placement, a Page-size tier, a country or a start month. The first rows compare partnership ads with brand-only ads, where partner_header marks ads that show a partner's account and own_header marks partnership ads on the advertiser's own Page, with the number of partner accounts in the last column. The run-length rows give the number of ads and advertisers, the share that had ended, the median run in days, the share still running after 1, 2, 3, 7, 14, 30, 60 and 90 days, and the median of each advertiser's own median. The live-ad rows give the number of advertisers and live ads, the median and mean live ads per advertiser, the share by count band, the share over 250 with and without the ads that share a creative, and the age of live ads. The last rows give the share of advertisers with ended ads in the library, by site domain. Please cite "Virev, November 2026" and link this page.