



The median Facebook Reel gets 416 views. We read 4,870,299 Reels from 777,983 Facebook pages, posted from May 1 to October 31, 2026, each at least 7 days after it went up. A quarter of the Reels got fewer than 171 views, a quarter got more than 1,700, and 11.1% passed 10,000. The mean is 26,848, because a few Reels get millions of views.
The pages that rank for this question are Reddit and Facebook group threads about Reels pay, posts that ask whether 20K views is good, and stat roundups with no source for their numbers. Emplifi measured which creative choices help brand Reels, and Buffer measured posts from pages that use Buffer, but neither gives the views a Reel gets by page size. This study counts the views Facebook shows on each Reel, so you can compare your own Reels with pages of your size.
416
Median Reel
25%
1K to 10K followers
11.1%
Past 10K views
Average Facebook Reel views by page followers
We took each page's median Reel, the middle one when its Reels are sorted by views, for the 621,889 pages with 3 or more Reels in the sample. The table gives the median of those, so it shows the typical Reel of the typical page in each size band.
| Page followers | Pages | Median followers | Typical page's median Reel | Views as share of followers |
|---|---|---|---|---|
| Under 100 | 163,509 | 32 | 166 | 538% |
| 100 to 1K | 158,971 | 374 | 328 | 95% |
| 1K to 10K | 166,786 | 3,300 | 730 | 25% |
| 10K to 100K | 96,555 | 27,000 | 1,800 | 6.9% |
| 100K to 1M | 25,187 | 220,000 | 5,900 | 2.4% |
| 1M+ | 10,880 | 2,600,000 | 25,000 | 0.9% |
| All pages | 621,889 | 876 | 406 | 61% |
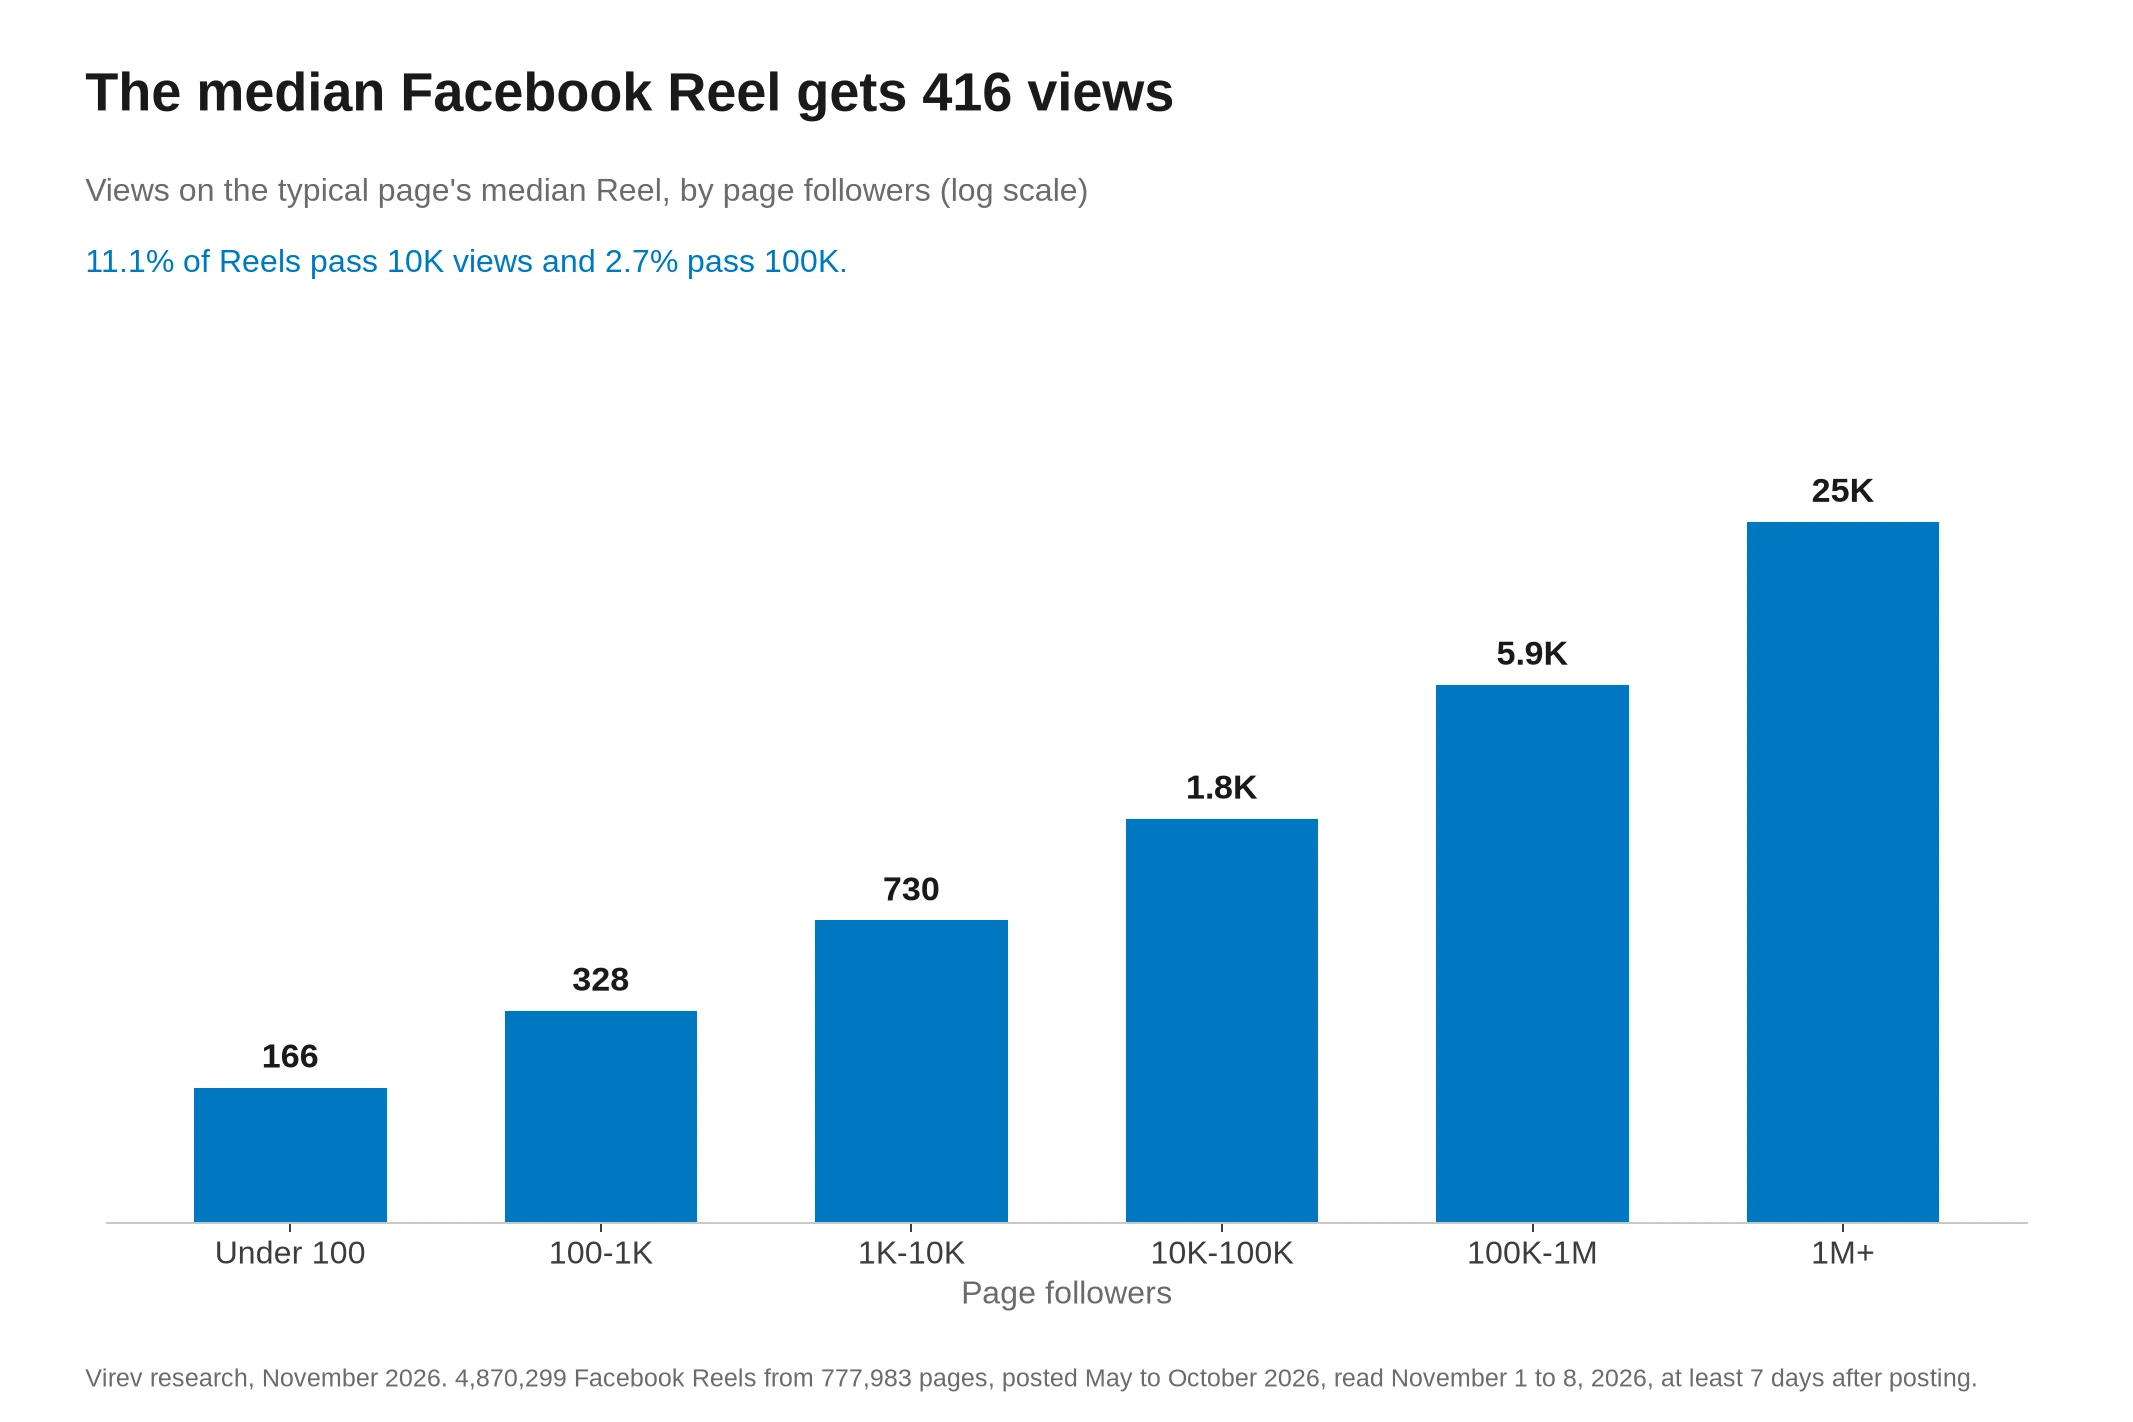
Views grow with page size, but much slower than followers. A page with 1,000 to 10,000 followers gets about 730 views on a typical Reel. A page 10 times bigger gets 1,800, and a page 100 times bigger gets 5,900.
The share of followers falls just as fast. Pages with under 100 followers got 5.4 times as many views as they have followers, likely because Facebook shows Reels to people who do not follow the page, and replays count as views too. At 1M+ followers, a typical Reel got views equal to 0.9% of the follower count.
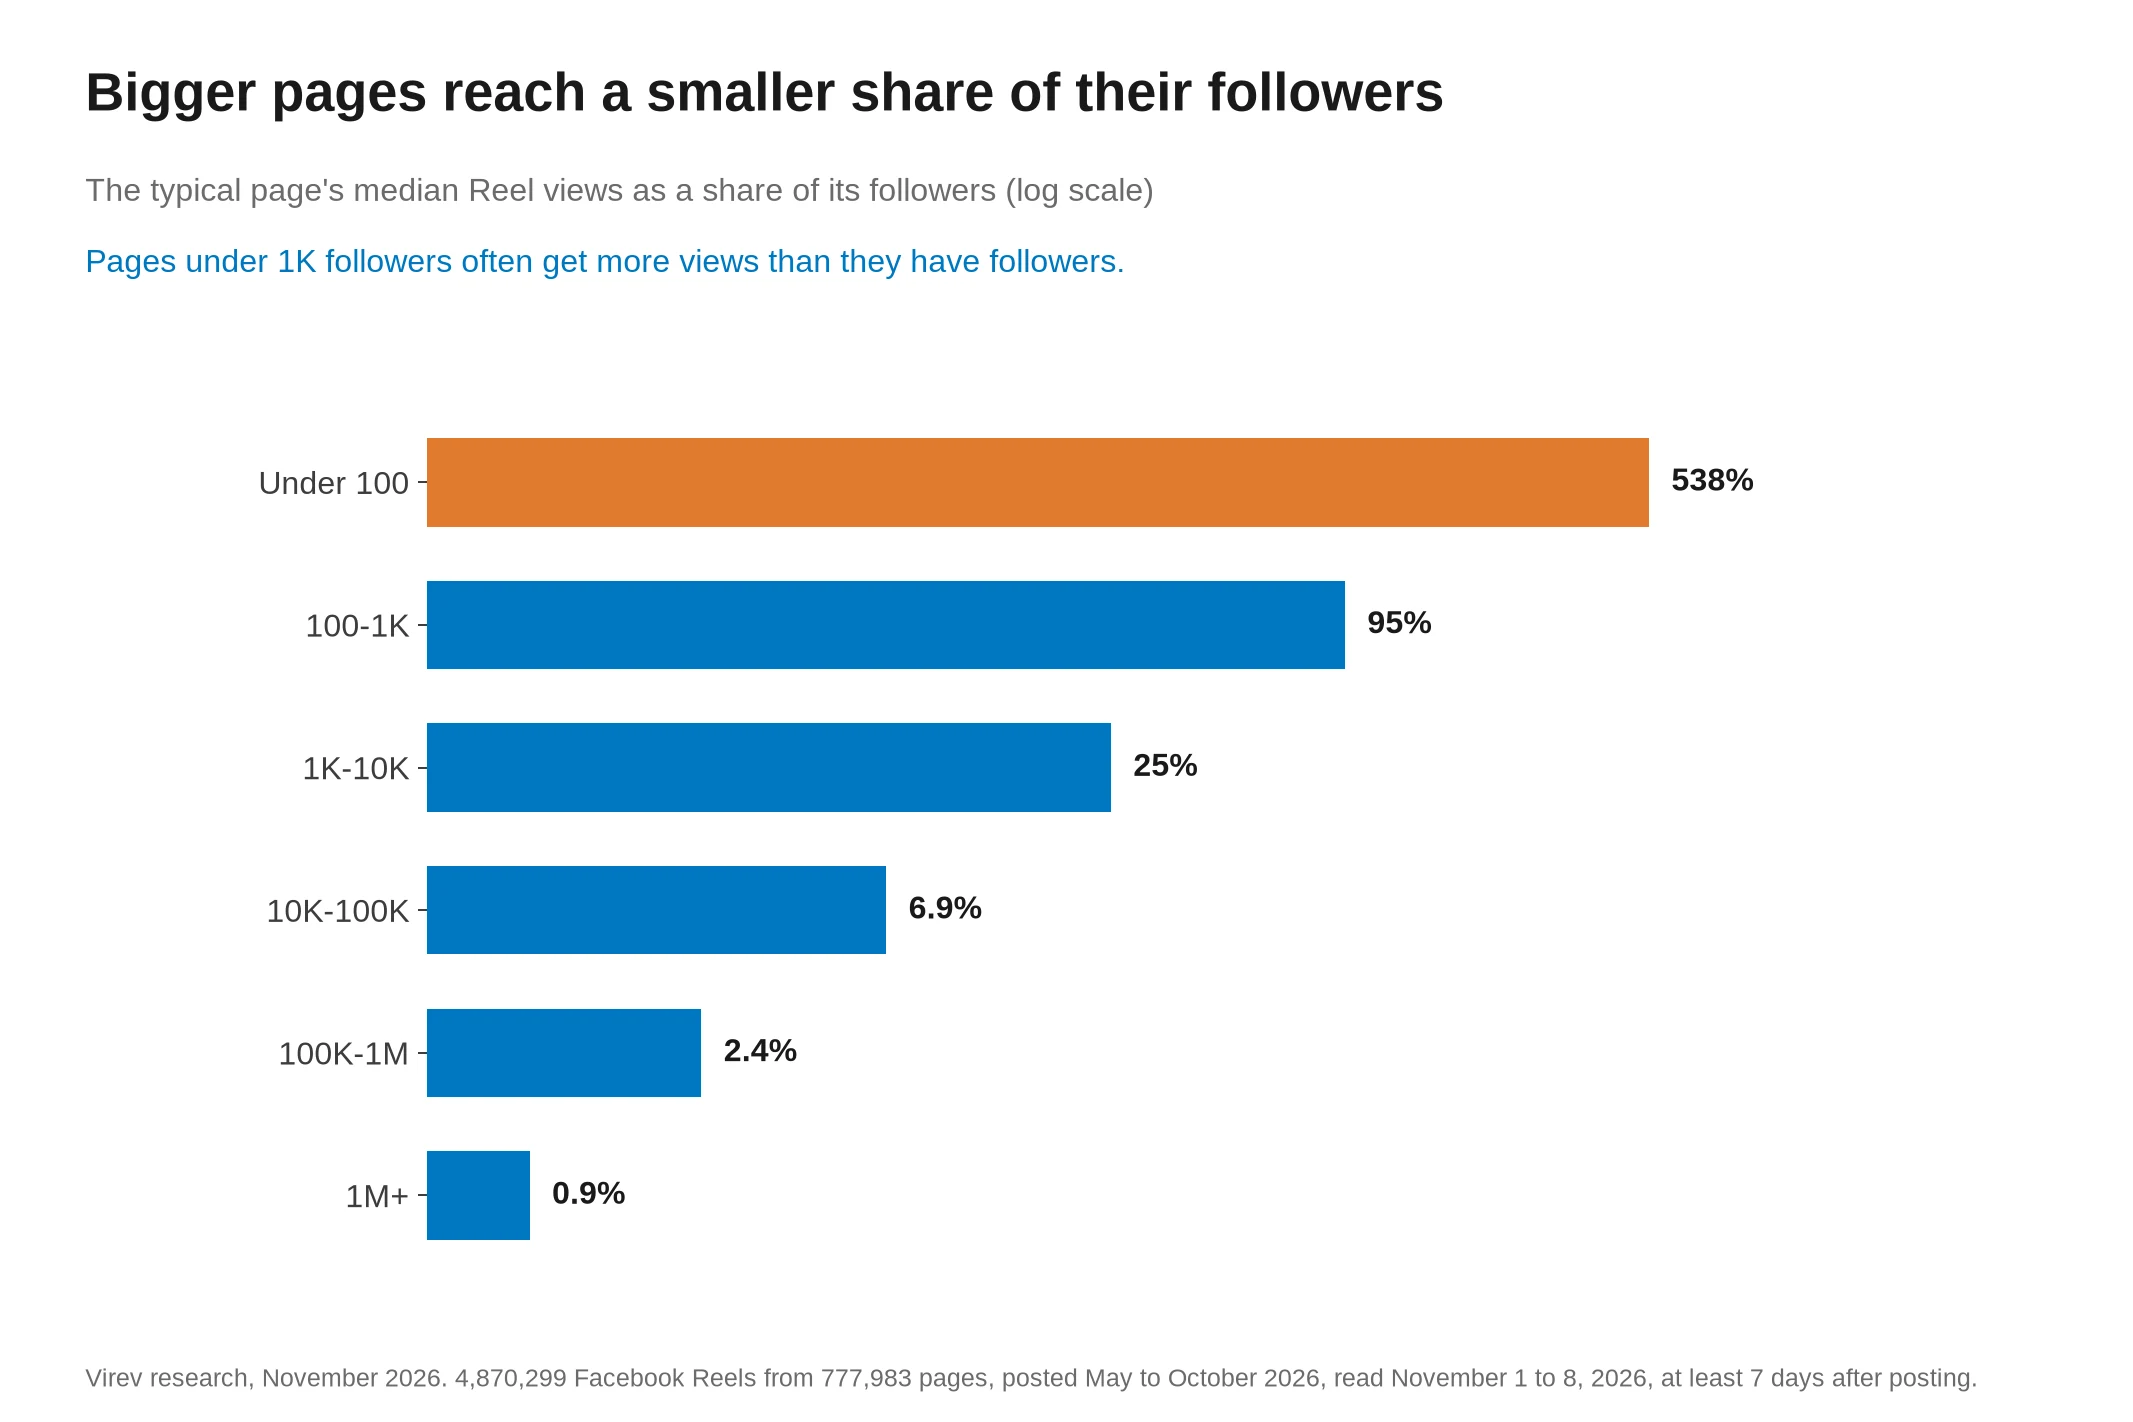
85.3% of pages with under 100 followers had a median Reel with more views than followers, against 18.5% of pages with 1,000 to 10,000 followers and 1.3% of pages with 1M+. So a Reel that beats your follower count is normal for a new page and rare for a big one.
How many Facebook Reels pass 10K, 100K and 1M views
| Page followers | Reels | Median Reel | 1K+ views | 10K+ views | 100K+ views | 1M+ views |
|---|---|---|---|---|---|---|
| Under 100 | 1,270,561 | 163 | 7.0% | 2.5% | 0.4% | 0.02% |
| 100 to 1K | 1,248,180 | 327 | 19.6% | 5.5% | 1.0% | 0.1% |
| 1K to 10K | 1,317,149 | 725 | 41.7% | 11.4% | 2.1% | 0.2% |
| 10K to 100K | 758,111 | 1,700 | 63.4% | 21.5% | 5.2% | 0.5% |
| 100K to 1M | 193,374 | 5,700 | 85.1% | 39.3% | 12.0% | 1.9% |
| 1M+ | 82,914 | 24,000 | 91.6% | 63.6% | 29.6% | 7.6% |
| All Reels | 4,870,299 | 416 | 32.9% | 11.1% | 2.7% | 0.4% |
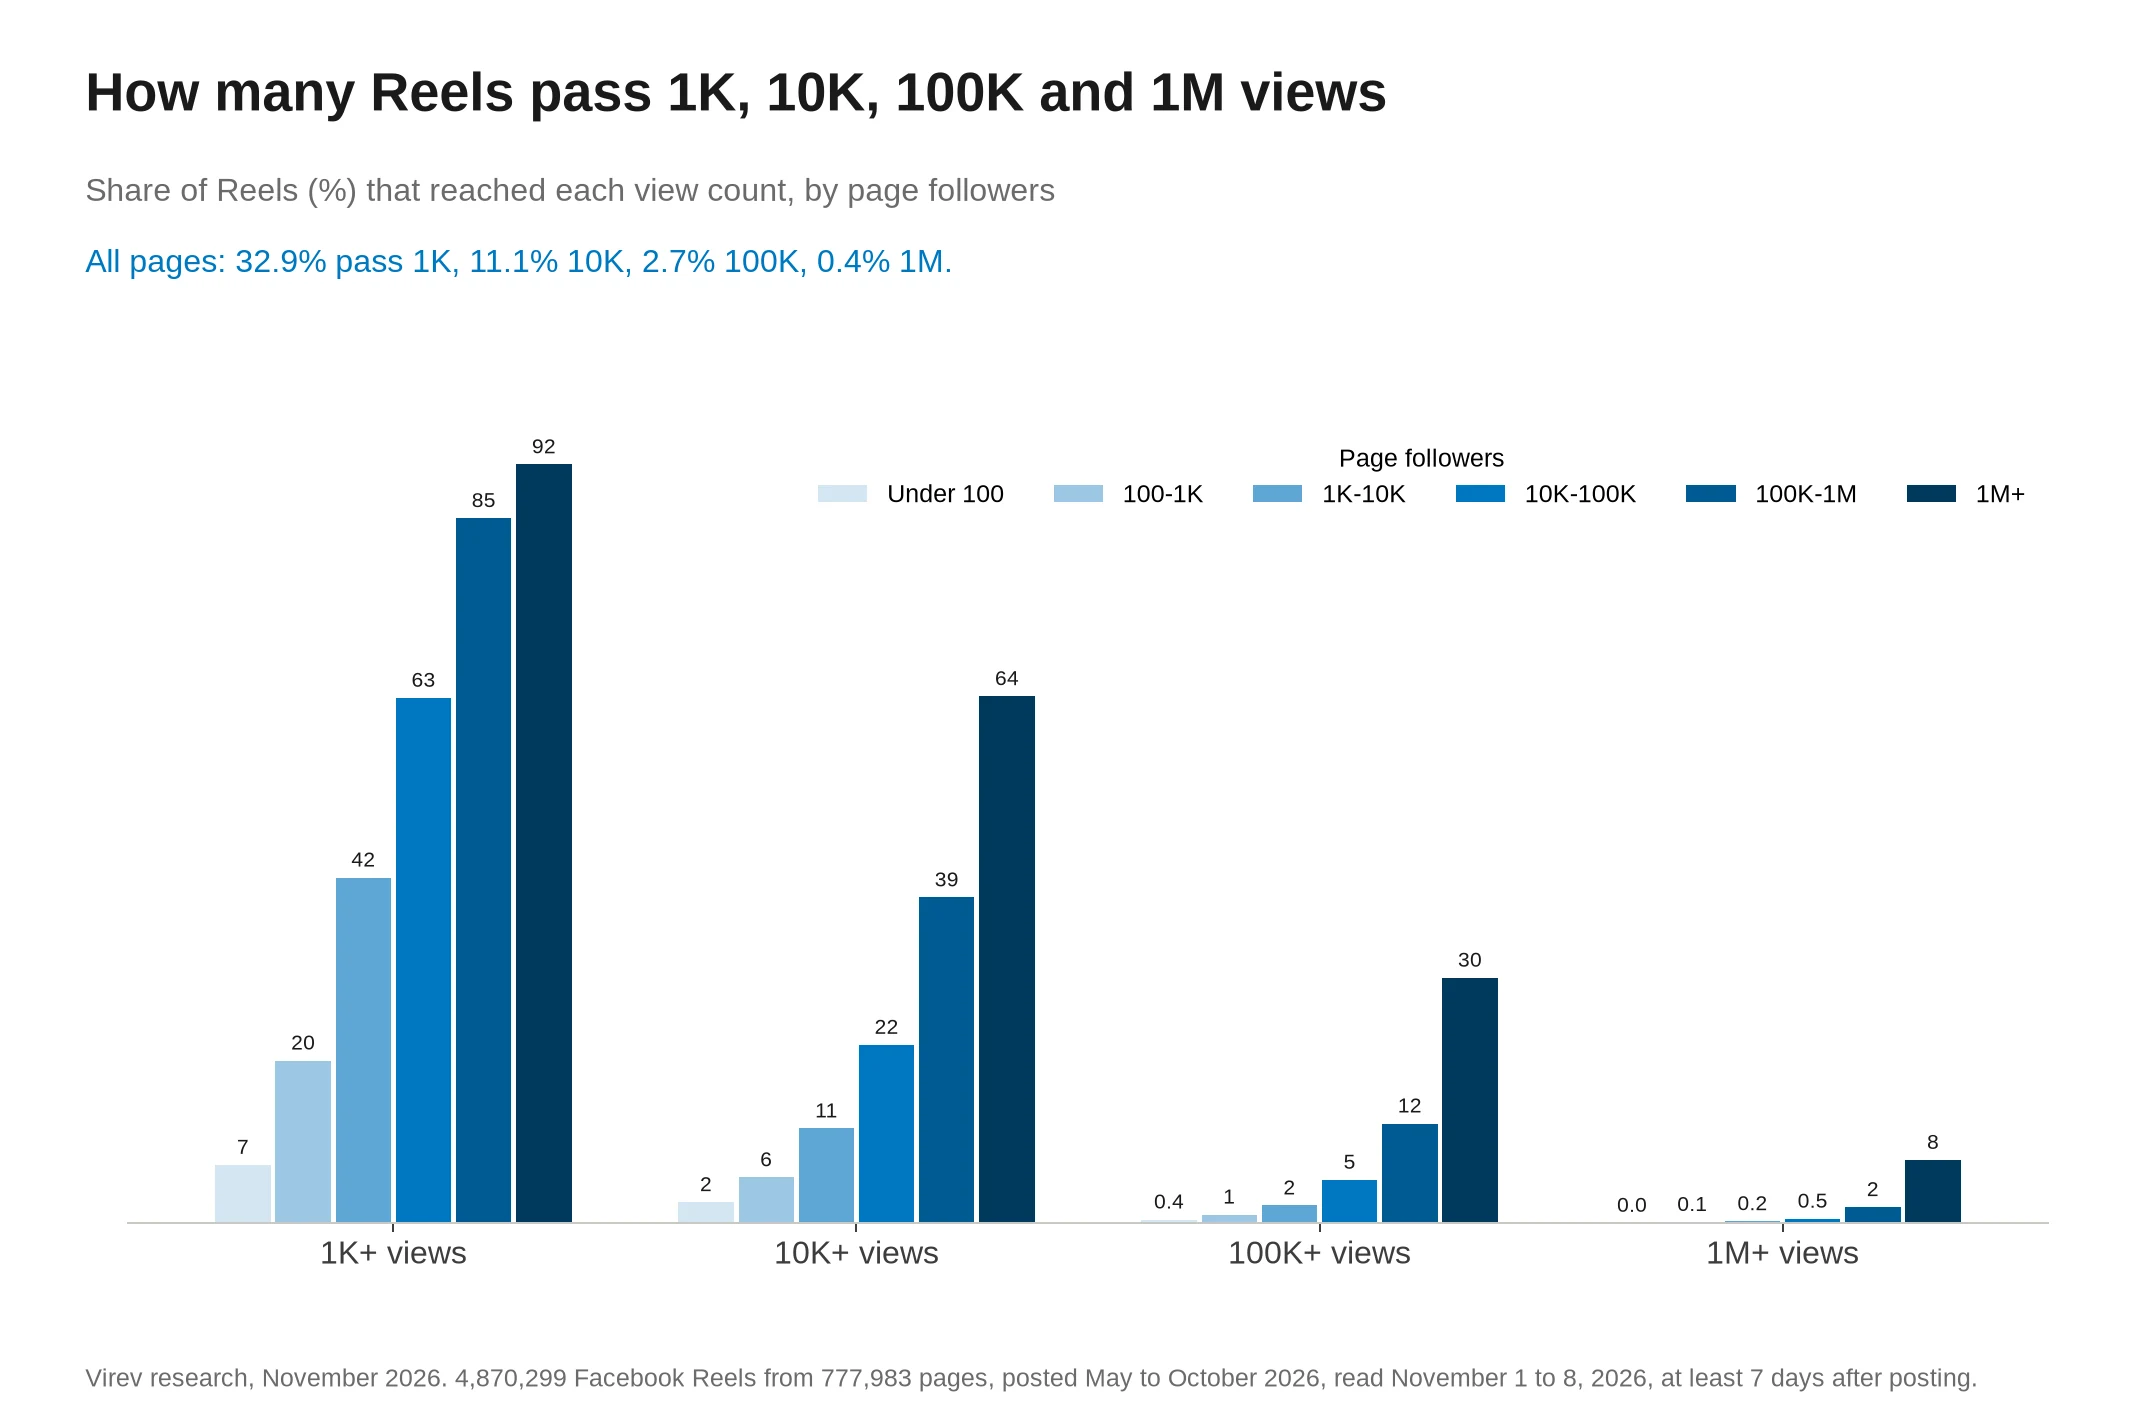
One Reel in three passed 1,000 views and one in nine passed 10,000. Only 2.7% passed 100,000 and 0.4% passed a million. A Reel with 20,000 views sits in the top 10% for a page with 1,000 to 10,000 followers, and near the middle for a page with 1M+.
Likes, comments and Facebook engagement rate
For each page with 3 or more Reels, we added up the likes, comments and views on its Reels and took the median page. The engagement rate by followers is the page's average likes plus comments per Reel, divided by its followers.
| Page followers | Likes per 1,000 views | Comments per 1,000 views | Reels with a comment | Engagement per view | Engagement rate by followers |
|---|---|---|---|---|---|
| Under 100 | 3.4 | 0.00 | 7.9% | 0.36% | 3.33% |
| 100 to 1K | 5.6 | 0.12 | 20.8% | 0.61% | 0.94% |
| 1K to 10K | 6.7 | 0.32 | 36.6% | 0.73% | 0.35% |
| 10K to 100K | 8.0 | 0.43 | 52.5% | 0.89% | 0.13% |
| 100K to 1M | 9.3 | 0.42 | 67.5% | 1.02% | 0.05% |
| 1M+ | 12.0 | 0.38 | 78.0% | 1.28% | 0.02% |
| All pages | 5.6 | 0.15 | 29.5% | 0.62% | 0.66% |
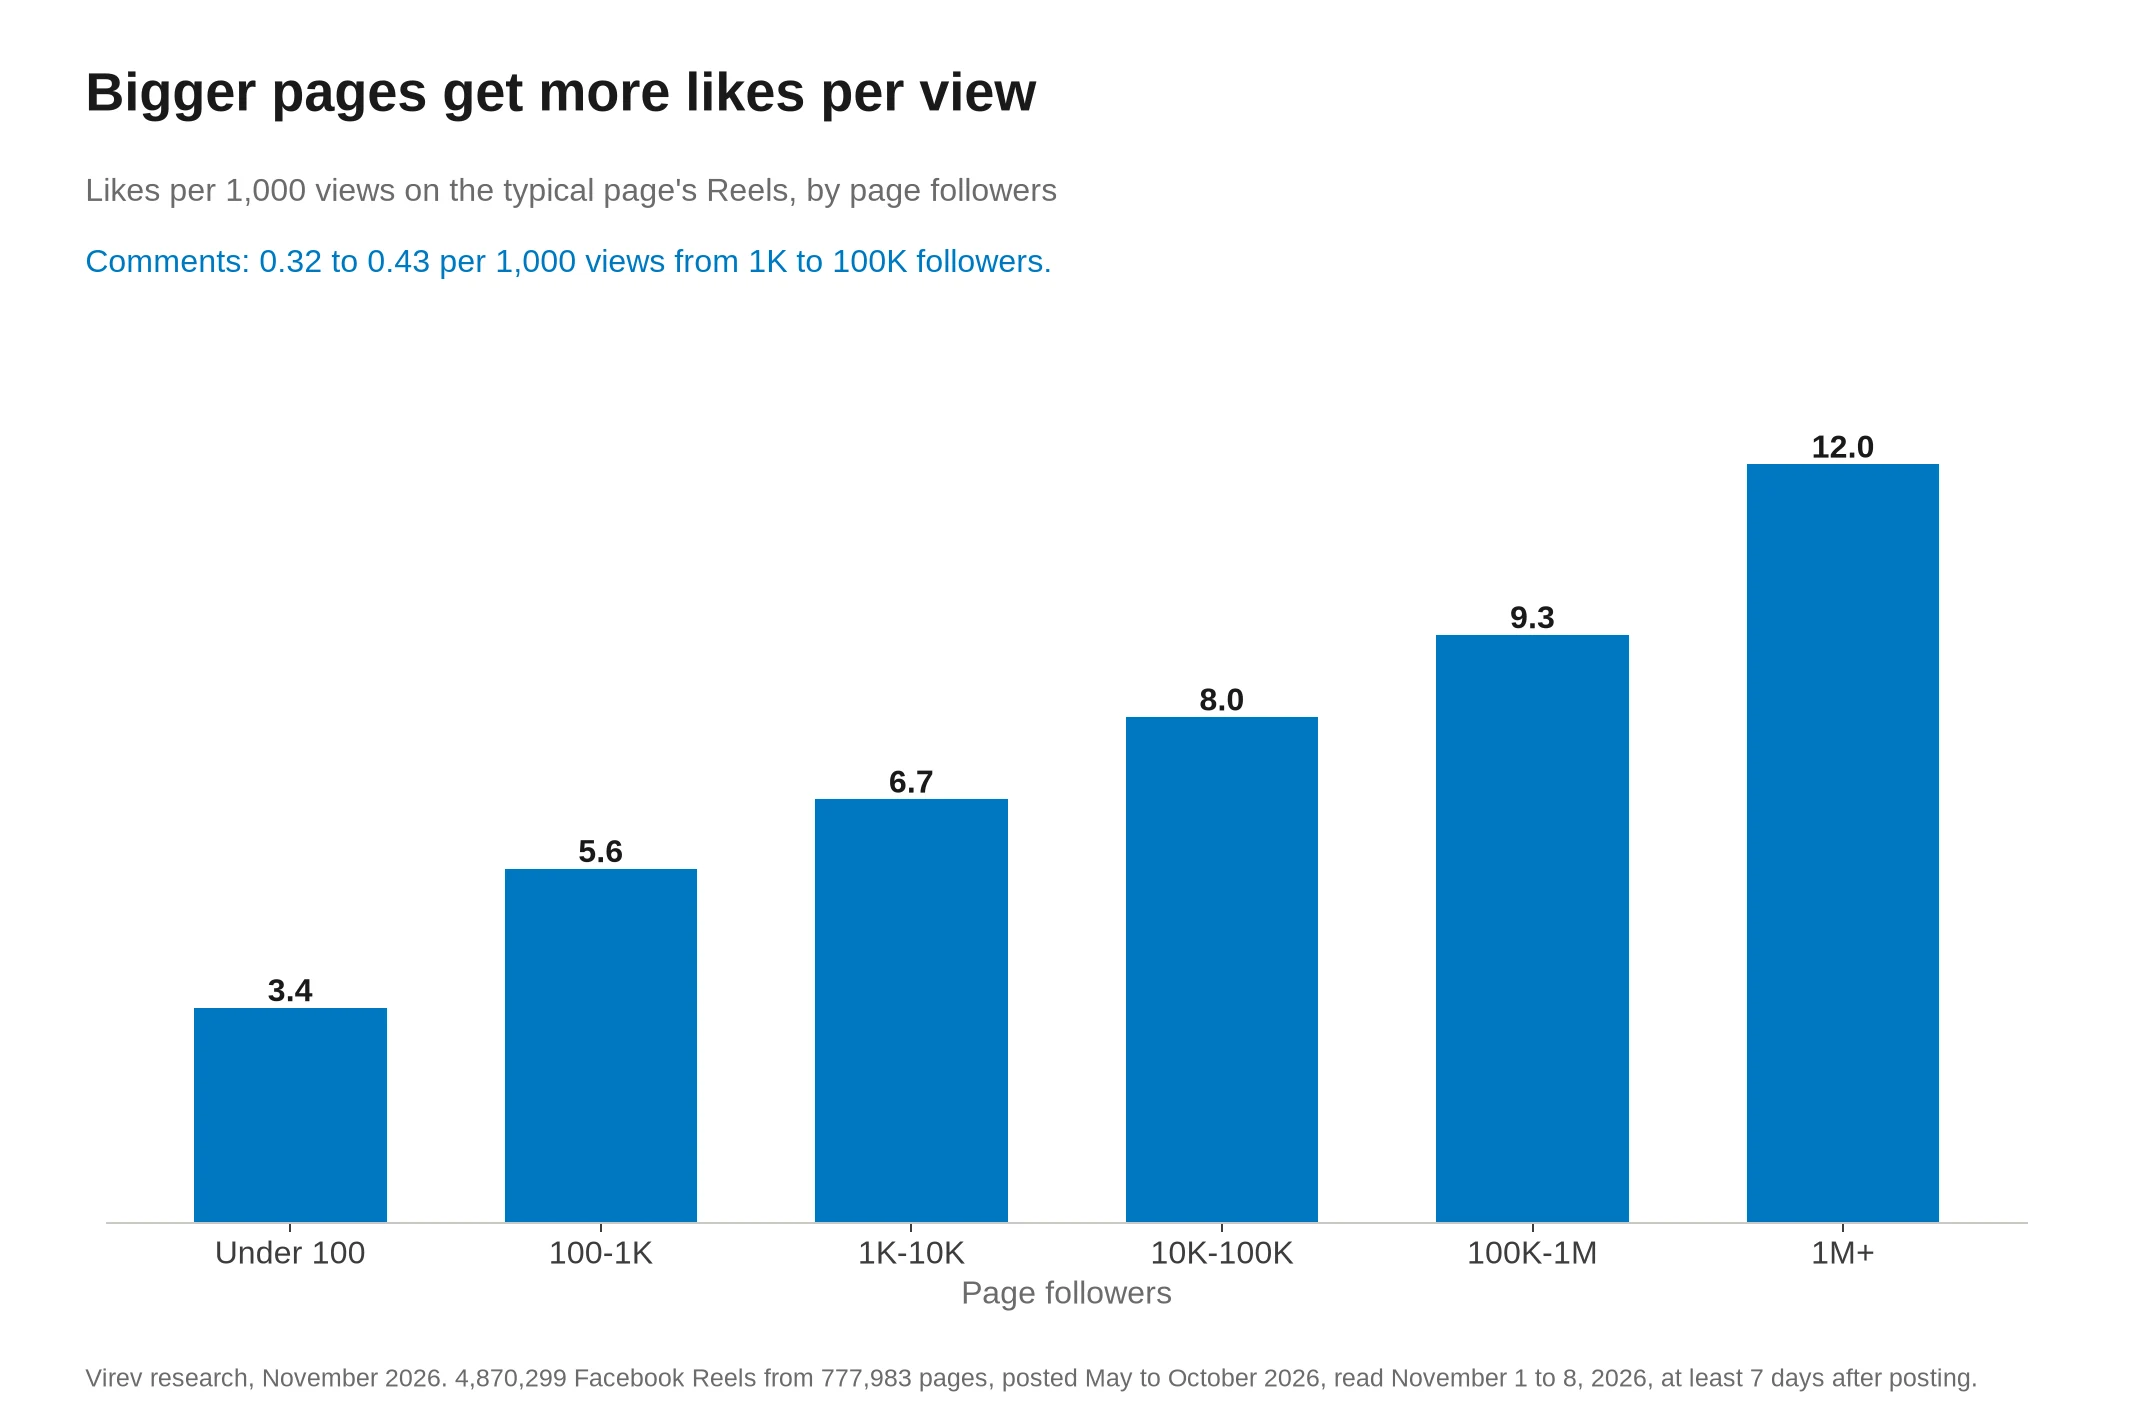
Viewers rarely react to a Facebook Reel. The typical page got 5.6 likes per 1,000 views, and 70.5% of Reels had no comment. Big pages get more likes per view, 12.0 per 1,000 at 1M+ followers against 3.4 under 100. A likely reason is that more of their viewers already follow them, though the data does not show who the viewers are.
Engagement rate by followers moves the other way, from 3.33% under 100 followers to 0.02% at 1M+, because views grow much slower than followers. A Facebook page with 1,000 to 10,000 followers had a median rate of 0.35%. Brand accounts on Instagram of that size had 2.15% in our Instagram engagement rate study, about 6 times more.
Buffer reports a median Facebook engagement rate of 2.8% per post, but it counts clicks and shares as well, and the pages are the ones that post with Buffer. Public Reels show likes and comments only, so the rates on this page are lower by design. Compare your own Reels with the likes and comments columns, which you can read on any public Reel.
One Reel in 25 gets 10 times the page's usual views
A tier table shows how rare a number is for pages your size. To judge one Reel, compare it with your own usual. We took the 517,681 pages with 5 or more Reels in the sample and compared each Reel with its page's median Reel.
| Page followers | Pages | Reels at 2x page median | Reels at 10x | Reels at half or less | Pages with a 10x Reel |
|---|---|---|---|---|---|
| Under 100 | 129,074 | 17.0% | 3.9% | 21.2% | 21.5% |
| 100 to 1K | 131,404 | 15.0% | 3.8% | 15.1% | 21.4% |
| 1K to 10K | 142,200 | 16.1% | 4.4% | 13.9% | 25.1% |
| 10K to 100K | 84,119 | 17.6% | 4.8% | 13.9% | 27.5% |
| 100K to 1M | 21,723 | 18.0% | 4.7% | 14.0% | 27.0% |
| 1M+ | 9,160 | 18.7% | 4.4% | 14.7% | 25.2% |
| All pages | 517,681 | 16.4% | 4.2% | 16.0% | 23.7% |
4.2% of Reels got 10 times their page's median, about 1 in 25, and 23.7% of pages had at least one such Reel among the Reels we read, usually 5 to 10. The share barely moves with page size. On Instagram, 3.3% of Reels reached 10 times their creator's median in our study of viral views, so a breakout Reel is a little more common on Facebook.
Reel views by page category
Pages pick a category on Facebook, such as Restaurant or Digital creator. Page size differs a lot by category, so this table holds size fixed and uses only pages with 1,000 to 10,000 followers.
| Category (1K to 10K followers) | Pages | Typical page's median Reel | Views as share of followers | Likes per 1,000 views | Comments per 1,000 views |
|---|---|---|---|---|---|
| Politician | 2,039 | 2,000 | 56% | 20.4 | 2.19 |
| Restaurant | 2,456 | 1,100 | 42% | 6.0 | 0.22 |
| Real Estate Agent | 1,082 | 915 | 37% | 3.4 | 0.19 |
| Medical & health | 2,067 | 839 | 30% | 5.4 | 0.25 |
| Public figure | 1,829 | 829 | 22% | 17.0 | 1.54 |
| School | 1,134 | 823 | 29% | 8.2 | 0.23 |
| Clothing store | 1,128 | 783 | 25% | 4.7 | 0.25 |
| Musician/band | 2,205 | 773 | 26% | 16.7 | 0.85 |
| Nonprofit organization | 2,200 | 751 | 22% | 11.9 | 0.57 |
| Shopping & retail | 2,678 | 719 | 25% | 5.0 | 0.28 |
| Product/service | 4,018 | 641 | 23% | 5.6 | 0.29 |
| Health/beauty | 4,404 | 624 | 23% | 4.8 | 0.24 |
| Digital creator | 7,706 | 592 | 16% | 18.2 | 1.34 |
| Beauty, cosmetic & personal care | 2,636 | 568 | 21% | 4.6 | 0.22 |
| Education | 1,788 | 529 | 18% | 7.1 | 0.23 |
| Jewelry/watches | 1,064 | 517 | 19% | 5.3 | 0.20 |
We picked 16 of the 28 categories that have 1,000 or more such pages, to cover each kind of page. The other 12, such as Local business, Hotel and Personal blog, got 517 to 777 views, and the CSV holds all 28.
Politicians got the most views at this size, 2,000 on a typical Reel, and restaurants came next with 1,100. Digital creators got fewer views than shops, 592, but 18.2 likes per 1,000 views against about 5 for stores and brands. Our guess is that people who watch a creator's Reel react to it more often than people who see a store's Reel.
Named pages with 1M+ followers
The biggest pages in the sample show how wide the range is at the top. Views are the median of the page's Reels in the sample, at our read.
| Page | Followers at our read | Reels in sample | Median Reel views | Top Reel views |
|---|---|---|---|---|
| Leo Messi | 118M | 10 | 7.95M | 59M |
| Neymar Jr. | 92M | 9 | 4.2M | 35M |
| Shakira | 126M | 10 | 3.75M | 315M |
| Rihanna | 102M | 7 | 3.0M | 14M |
| Selena Gomez | 84M | 5 | 2.6M | 13M |
| Eminem | 92M | 5 | 1.3M | 1.8M |
| 154M | 4 | 659K | 1.0M | |
| Will Smith | 112M | 4 | 423K | 1.1M |
| National Geographic UK | 82M | 3 | 186K | 362K |
| Samsung US | 162M | 7 | 51K | 159K |
| Samsung Portugal | 162M | 9 | 1.8K | 4.5K |
| Coca-Cola Taiwan | 106M | 10 | 2.55M | 14M |
| Coca-Cola New Zealand | 106M | 10 | 859 | 3.7K |
Stars get millions of views on a typical Reel. A brand's regional page shows the brand's global follower count and often gets the views of a small page, though some regional pages, such as Samsung Nigeria at 256,000 and Coca-Cola Chile at 640,000, get far more. Samsung Portugal lists 162M followers and its typical Reel got 1,800 views. Coca-Cola New Zealand lists 106M and got 859, while Coca-Cola Taiwan got 2.55M, which may include views from paid boosts.
2,072 of the 10,880 pages in the 1M+ band share their name with another 1M+ page, like these regional brand pages. Their typical Reel got 3,300 views, and the other 8,808 pages got 38,500, 1.4% of their followers. So the 1M+ row in the tables above is lower than it would be for single pages of that size.
Facebook Reels against Instagram Reels
Our study of average Instagram reel views found that a typical Instagram account with 1,000 to 5,000 followers got 1,800 views on its median reel, and one with 5,000 to 10,000 got 3,300. On Facebook, a page with 1,000 to 10,000 followers got 730. As a share of followers, Instagram accounts got 74.5% at 1,000 to 5,000 followers and 46.1% at 5,000 to 10,000, against 25% for Facebook pages with 1,000 to 10,000 followers.
The two samples differ. The Instagram study covers creators only, with brand and business accounts removed, and most pages here are businesses that run Meta ads. Read the gap as a rough guide, not a fixed ratio.
Views keep growing a little after the first week
| Age of the Reel at our read | Reels | Median views | 10K+ views |
|---|---|---|---|
| 7 to 13 days | 740,281 | 375 | 11.9% |
| 14 to 29 days | 1,085,456 | 384 | 11.2% |
| 30 to 59 days | 1,115,979 | 409 | 10.8% |
| 60 to 119 days | 1,113,617 | 441 | 11.1% |
| 120+ days | 814,966 | 464 | 10.8% |
Reels read 7 to 13 days after posting had a median of 375 views, and Reels read 120 days or more after posting had 464, so a one-week-old Reel already has about 80% of the views of a four-month-old one. A Reel's count after 7 days is close to where it ends. The share past 10,000 views stayed near 11% at every age.
What to do with this
For pages and creators
- Compare a Reel with the median for your size, because 730 views is typical at 1,000 to 10,000 followers and 1,800 at 10,000 to 100,000.
- Judge a Reel against your own median, and treat 10 times that median as a breakout, because 4.2% of Reels get there.
- Expect few comments, because 70.5% of Reels get none, and count likes per 1,000 views instead, where 5.6 is typical and 18 is typical for creators.
- Expect a new page's Reels to get more views than it has followers, because 85.3% of pages with under 100 followers did.
For brands choosing creators and pages
- Ask for a page's median Reel views, not its followers, because the typical page with 10,000 to 100,000 followers gets views equal to 6.9% of them on a Reel.
- Check whether a big page is a regional page of a global brand, because its follower count belongs to the brand and its Reels often get the views of a small page.
To find creators whose Reels reach real viewers, search them by niche, country and size in Virev creator search, which covers 180M+ creators, and sign up to save them. For how long the ads of these same pages run, see our study of how long Facebook ads run.
How we measured, and what can be wrong
- The data is the Reels tab of public Facebook pages, read logged out by Virev's crawler. Each read takes the first screen of the tab, up to 10 Reels, with the views, likes and comments Facebook shows on each one.
- Facebook's help center says that since September 2025 all videos on Facebook are Reels, so the Reels tab holds all of a page's videos, whatever their length.
- The crawler finds pages mostly through Meta's Ad Library: 711,751 of the 822,047 pages it read with a Reel posted since May 2026 (86.6%) also ran ads in the library. The rest came from people and pages that appear on Reels and in comments. So the sample leans to businesses that advertise, and this is why the typical page in the sample has 876 followers.
- Facebook shows a view count of 1,000 or more rounded, such as 1.3K or 113K, and 32.9% of the Reels had a rounded count. A rounded count can be off by up to about 4% at 1.3K and less for larger numbers.
- A brand that boosts a Reel with ads may add paid views to the count Facebook shows, and the data cannot separate them.
- The sample is every Reel posted May 1 to October 31, 2026 that the crawler read at least 7 days after posting, using each Reel's latest read before November 9, 2026. 4,870,238 of the 4,870,299 Reels were last read November 1 to 8, 2026, and 77.5% were read once.
- Followers come from the crawler's latest read of the page before November 9, 2026. For 303,177 pages with no such read, they come from the latest value in Virev's database, read November 1 to 9, 2026.
- Page categories come from the category the page picked on Facebook, and 777,627 of the 777,983 pages had one.
- We checked the data by hand on November 9, 2026. A reviewer opened the Reels tab of 20 random pages. On 19 of 20, the live Reels tab listed our view counts in the same order, within 5% or grown since our read, and the 20th had posted new Reels since our read, so its tab no longer showed ours. On 12 of another 14 random pages, the live Reels tab showed the same view counts in the same order as our read, apart from Reels posted since and small growth. On the other 2, the counts had changed since our read.
- The page tables use pages with 3 or more Reels in the sample and the Reel tables use every Reel, so the two medians differ a little (406 and 416).
Frequently asked questions
What is the average number of views on a Facebook Reel?
The median Facebook Reel got 416 views in our study of 4,870,299 Reels posted May to October 2026. The mean is 26,848, because a few Reels get millions of views, so the median is the better guide to a typical Reel.
How many views should a Facebook Reel get with 1,000 followers?
A page with 1,000 to 10,000 followers got 730 views on its typical Reel, about 25% of its followers. A page with 100 to 1,000 followers got 328, about as many views as it has followers.
How many views is good for a Facebook Reel with 10K followers?
A page with 10,000 to 100,000 followers got 1,800 views on its typical Reel and passed 10,000 views on 21.5% of its Reels. 7,500 views put a Reel in the top quarter for that size.
What is a good engagement rate on Facebook?
For Reels, the typical page with 1,000 to 10,000 followers had an engagement rate of 0.35% of its followers, and 0.13% at 10,000 to 100,000, counting likes and comments. Per view, the typical page got 0.62% likes plus comments. A page above those numbers beats most pages its size.
How many views is viral on Facebook Reels?
A Reel with 10 times your page's usual views is a breakout, and 4.2% of Reels get there. Across all pages, only 2.7% of Reels pass 100,000 views and 0.4% pass a million.
Download the data
All tables are in one CSV: average-facebook-reel-views-2026.csv. Each row is one group in one table, such as all Reels, a follower band, a Reel age, a posting month or a page category. The Reel rows give the number of Reels and pages, the median, mean and 25th, 75th and 90th percentile views, the share past 1K, 10K, 100K and 1M views, the median likes and the share of Reels with a comment. The page rows give the number of pages with 3 or more Reels, the typical page's median Reel, the median followers, views as a share of followers, engagement rate by followers and per view, and likes and comments per 1,000 views. Please cite "Virev, November 2026" and link this page.