



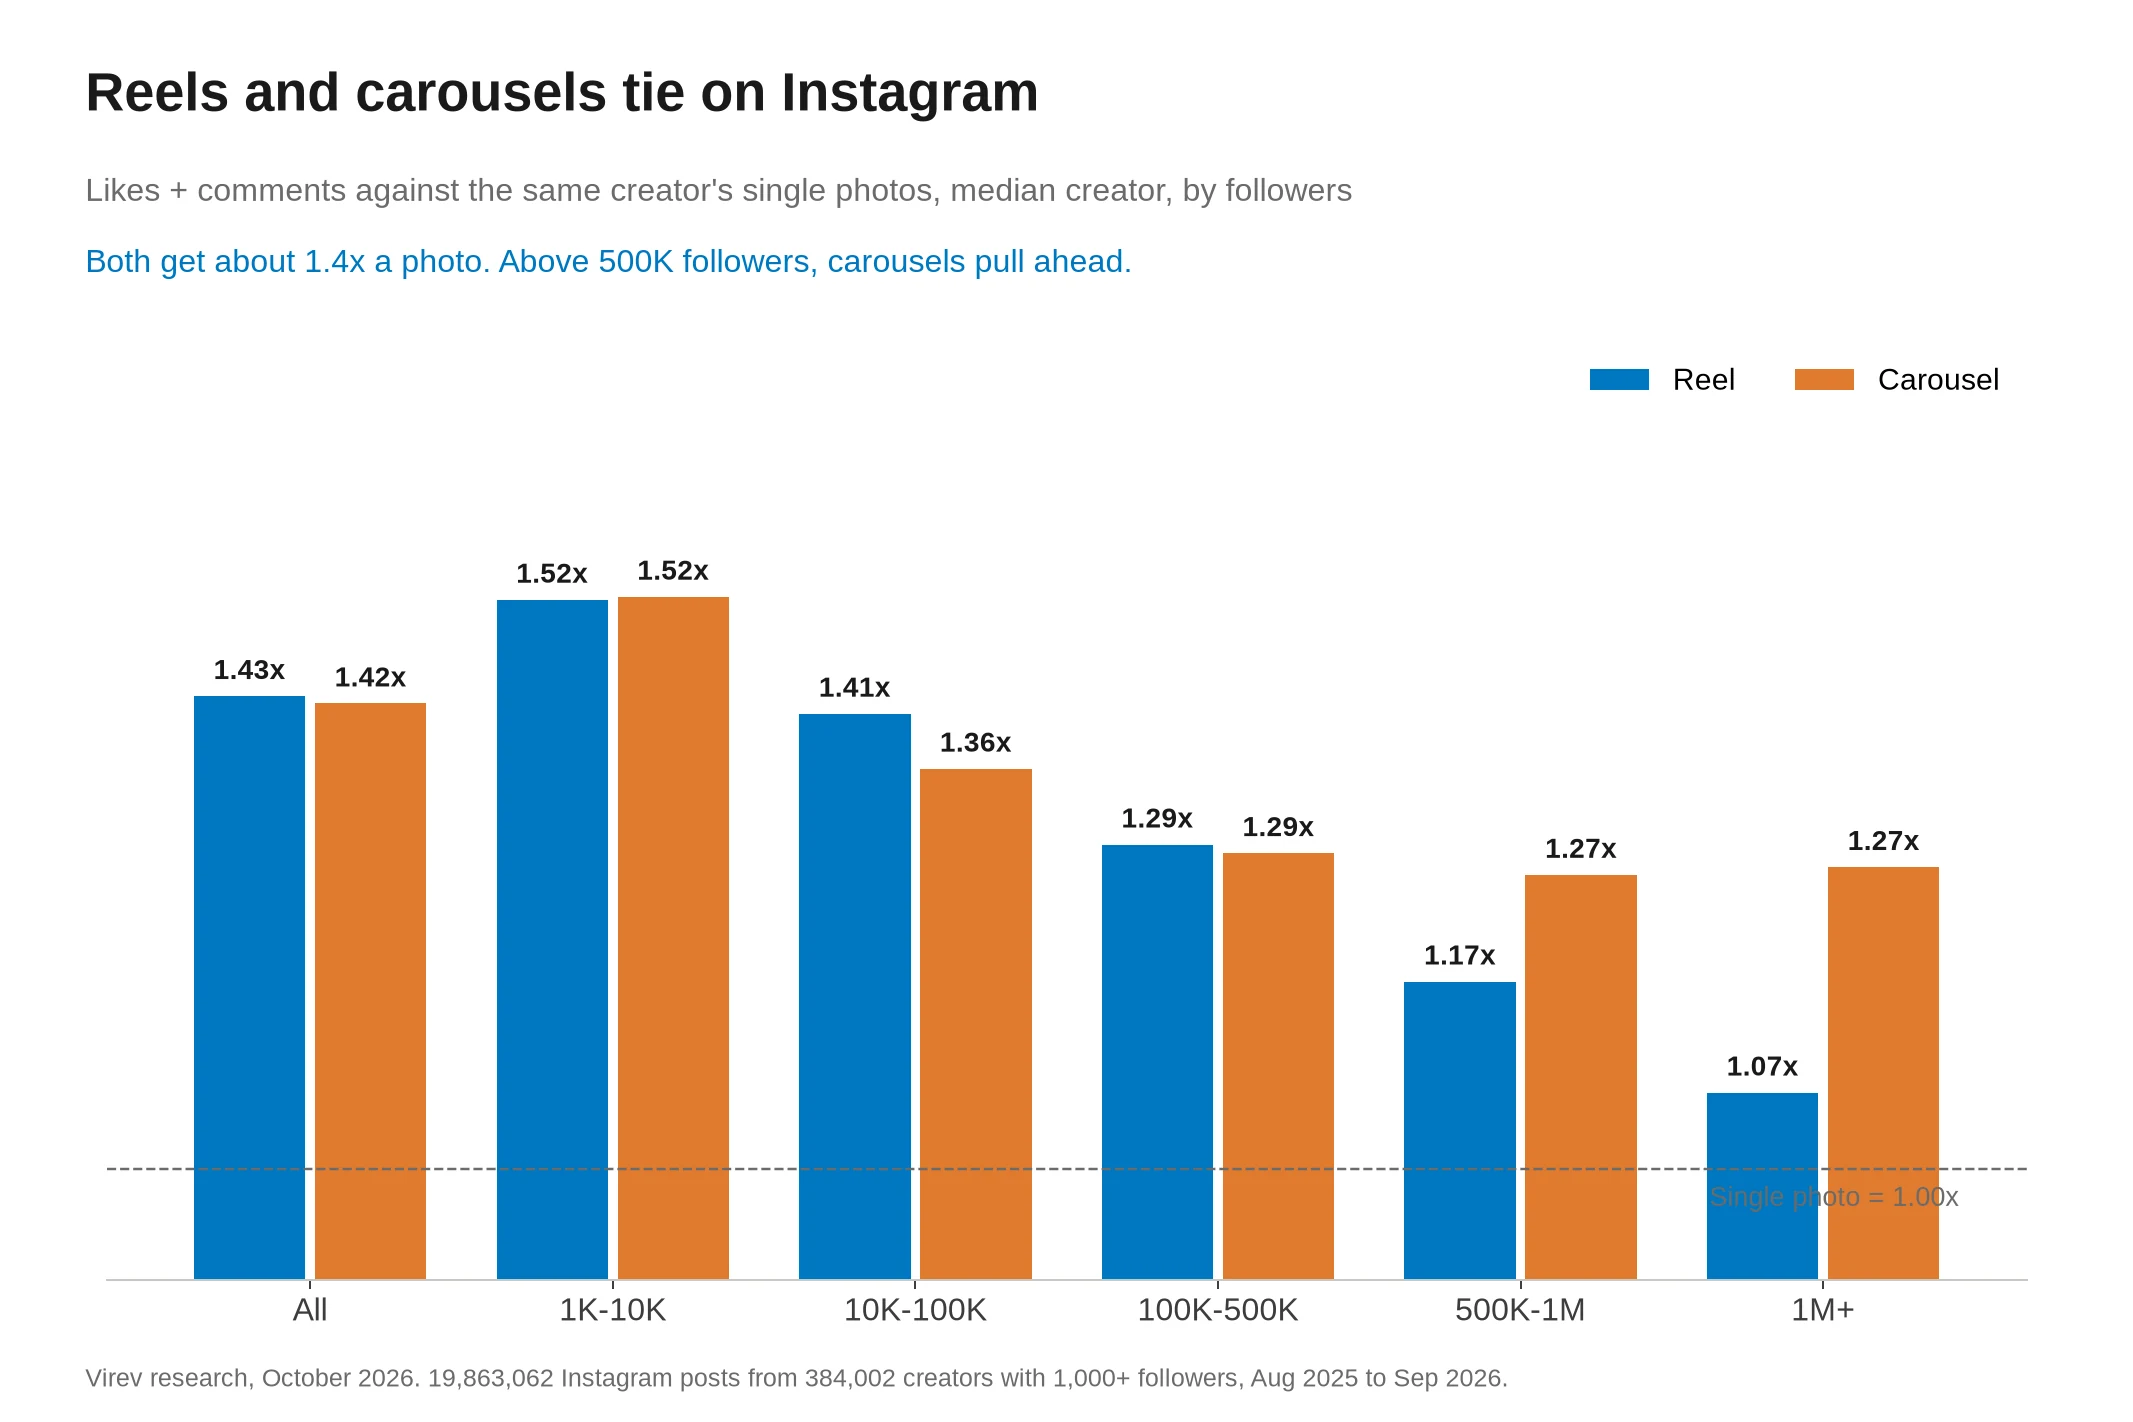
On Instagram, reels and carousels get about the same likes and comments, and both beat a single photo by about 40%. We compared each creator's posts with their own other posts, so the creator's audience and size stay the same. The typical creator's reels got 1.43x the likes and comments of their single photos, and their carousels got 1.42x. Above 500,000 followers, carousels pull ahead of reels. On TikTok, photo posts get fewer views than the same creator's videos, at 0.86x.
The sample is 19,863,062 public Instagram posts from 384,002 creators with 1,000 or more followers, and 3,507,816 TikTok posts from 53,315 creators, posted from August 2025 to September 2026.
The answers that rank for this question come from brand accounts. Socialinsider puts carousels first at 0.50% and reels at 0.48% for Q3 2026, an average over brand posts. Buffer puts carousels at 6.90% and reels at 3.31% of reach, for posts sent through Buffer. Neither compares the same account's formats with each other. This page does that for creators, by follower count and category, and adds views and TikTok photo posts.
1.43x
Reels vs single photos
1.42x
Carousels vs single photos
0.86x
TikTok photo posts
Reels vs carousels vs single photos on Instagram
For each creator we took the median likes plus comments of their reels, of their carousels and of their single photos, counting only formats with 3 or more posts. We divided one median by another, then took the median creator. A result of 1.43x means the typical creator's reels got 43% more likes and comments than the same creator's single photos.
| Followers | Reel vs photo | Carousel vs photo | Reel vs carousel | Carousel wins |
|---|---|---|---|---|
| All | 1.43x | 1.42x | 0.98x | 50.8% |
| 1K-10K | 1.52x | 1.52x | 0.99x | 50.6% |
| 10K-100K | 1.41x | 1.36x | 1.01x | 49.0% |
| 100K-500K | 1.29x | 1.29x | 0.98x | 51.2% |
| 500K-1M | 1.17x | 1.27x | 0.90x | 55.6% |
| 1M+ | 1.07x | 1.27x | 0.80x | 61.9% |
"Carousel wins" is the share of creators whose carousel median beat their reel median. The three columns use 160,841, 154,432 and 221,311 creators, and the CSV has the count for each row.
- A single photo came last at every follower count.
- Reels and carousels tie for creators under 500,000 followers, where the reel-to-carousel ratio sits between 0.98x and 1.01x.
- For creators with over 1 million followers, the typical reel got 0.80x the likes and comments of a carousel, so the carousel got 1.25x the reel.
- The gap between any format and a single photo shrinks as accounts grow, from 1.52x at 1,000 to 10,000 followers to 1.07x for reels above 1 million.
- Reels are 53.6% of the posts in the sample, carousels 26.4% and single photos 19.9%.
Among the 133,448 creators with 3 or more posts in all three formats, reels were the best format for 42.4%, carousels for 41.5% and single photos for 15.0%. Most creators have one format that works better for them, and it is about as often a carousel as a reel.
Carousels get more likes, reels get more comments
Likes and comments split the other way. For the typical creator, a reel got 0.98x the likes of a carousel and 1.08x the comments. Against a single photo, reels got 1.33x the comments and carousels 1.04x.
- Use a carousel when the goal is likes, because carousels got 2% more likes than the same creator's reels.
- Use a reel when the goal is comments, because reels drew 8% more comments than the same creator's carousels.
Engagement rate by followers for each format
The rates below divide likes plus comments by followers. For each creator we took the median post in each format, then the median creator, using 328,897 creators with 3 or more reels, 265,966 with 3 or more carousels and 192,356 with 3 or more single photos. The rate falls as accounts grow for every format.
| Followers | Reel | Carousel | Single photo |
|---|---|---|---|
| All | 1.21% | 1.31% | 0.68% |
| 1K-10K | 2.20% | 2.29% | 1.05% |
| 10K-100K | 1.01% | 1.01% | 0.50% |
| 100K-500K | 0.73% | 0.76% | 0.39% |
| 500K-1M | 0.64% | 0.71% | 0.34% |
| 1M+ | 0.45% | 0.55% | 0.28% |
- The median creator's carousels get 1.31% and their reels 1.21%, about twice the 0.68% of single photos.
- Carousels lead on this measure at every size except 10,000 to 100,000 followers, where both reach 1.01%.
- Our creator rates are about two to two and a half times the brand averages Socialinsider reports for Q3 2026, which are 0.50% for carousels, 0.48% for reels and 0.35% for images.
This table compares different creators in each column, so a carousel lead here can come from who posts carousels. The same-creator table above is the fairer test, and there reels and carousels tie below 500,000 followers.
Views where Instagram shows them
Our crawler reads a public view count only on reels, so this study cannot compare views across the three formats. The table below covers the 328,895 creators with 3 or more reels that show a view count, and each number is the median creator's median reel.
| Followers | Median reel views | Views per 100 followers | Likes + comments per 100 views |
|---|---|---|---|
| All | 9,089 | 37.8 | 3.20 |
| 1K-10K | 2,233 | 64.7 | 3.29 |
| 10K-100K | 10,026 | 33.0 | 3.10 |
| 100K-500K | 50,152 | 24.2 | 3.19 |
| 500K-1M | 142,371 | 20.2 | 3.28 |
| 1M+ | 293,107 | 14.2 | 3.31 |
- A creator with 1,000 to 10,000 followers gets a median 64.7 reel views per 100 followers, and a creator with over 1 million gets 14.2.
- People who watch a reel like or comment on it at about the same rate at every size, between 3.10 and 3.31 per 100 views.
- Buffer reports that reels got 1.36x the reach of carousels and 2.25x the reach of single images, from 4 million posts sent through Buffer from January 2022 to October 2024.
Reels vs carousels by category
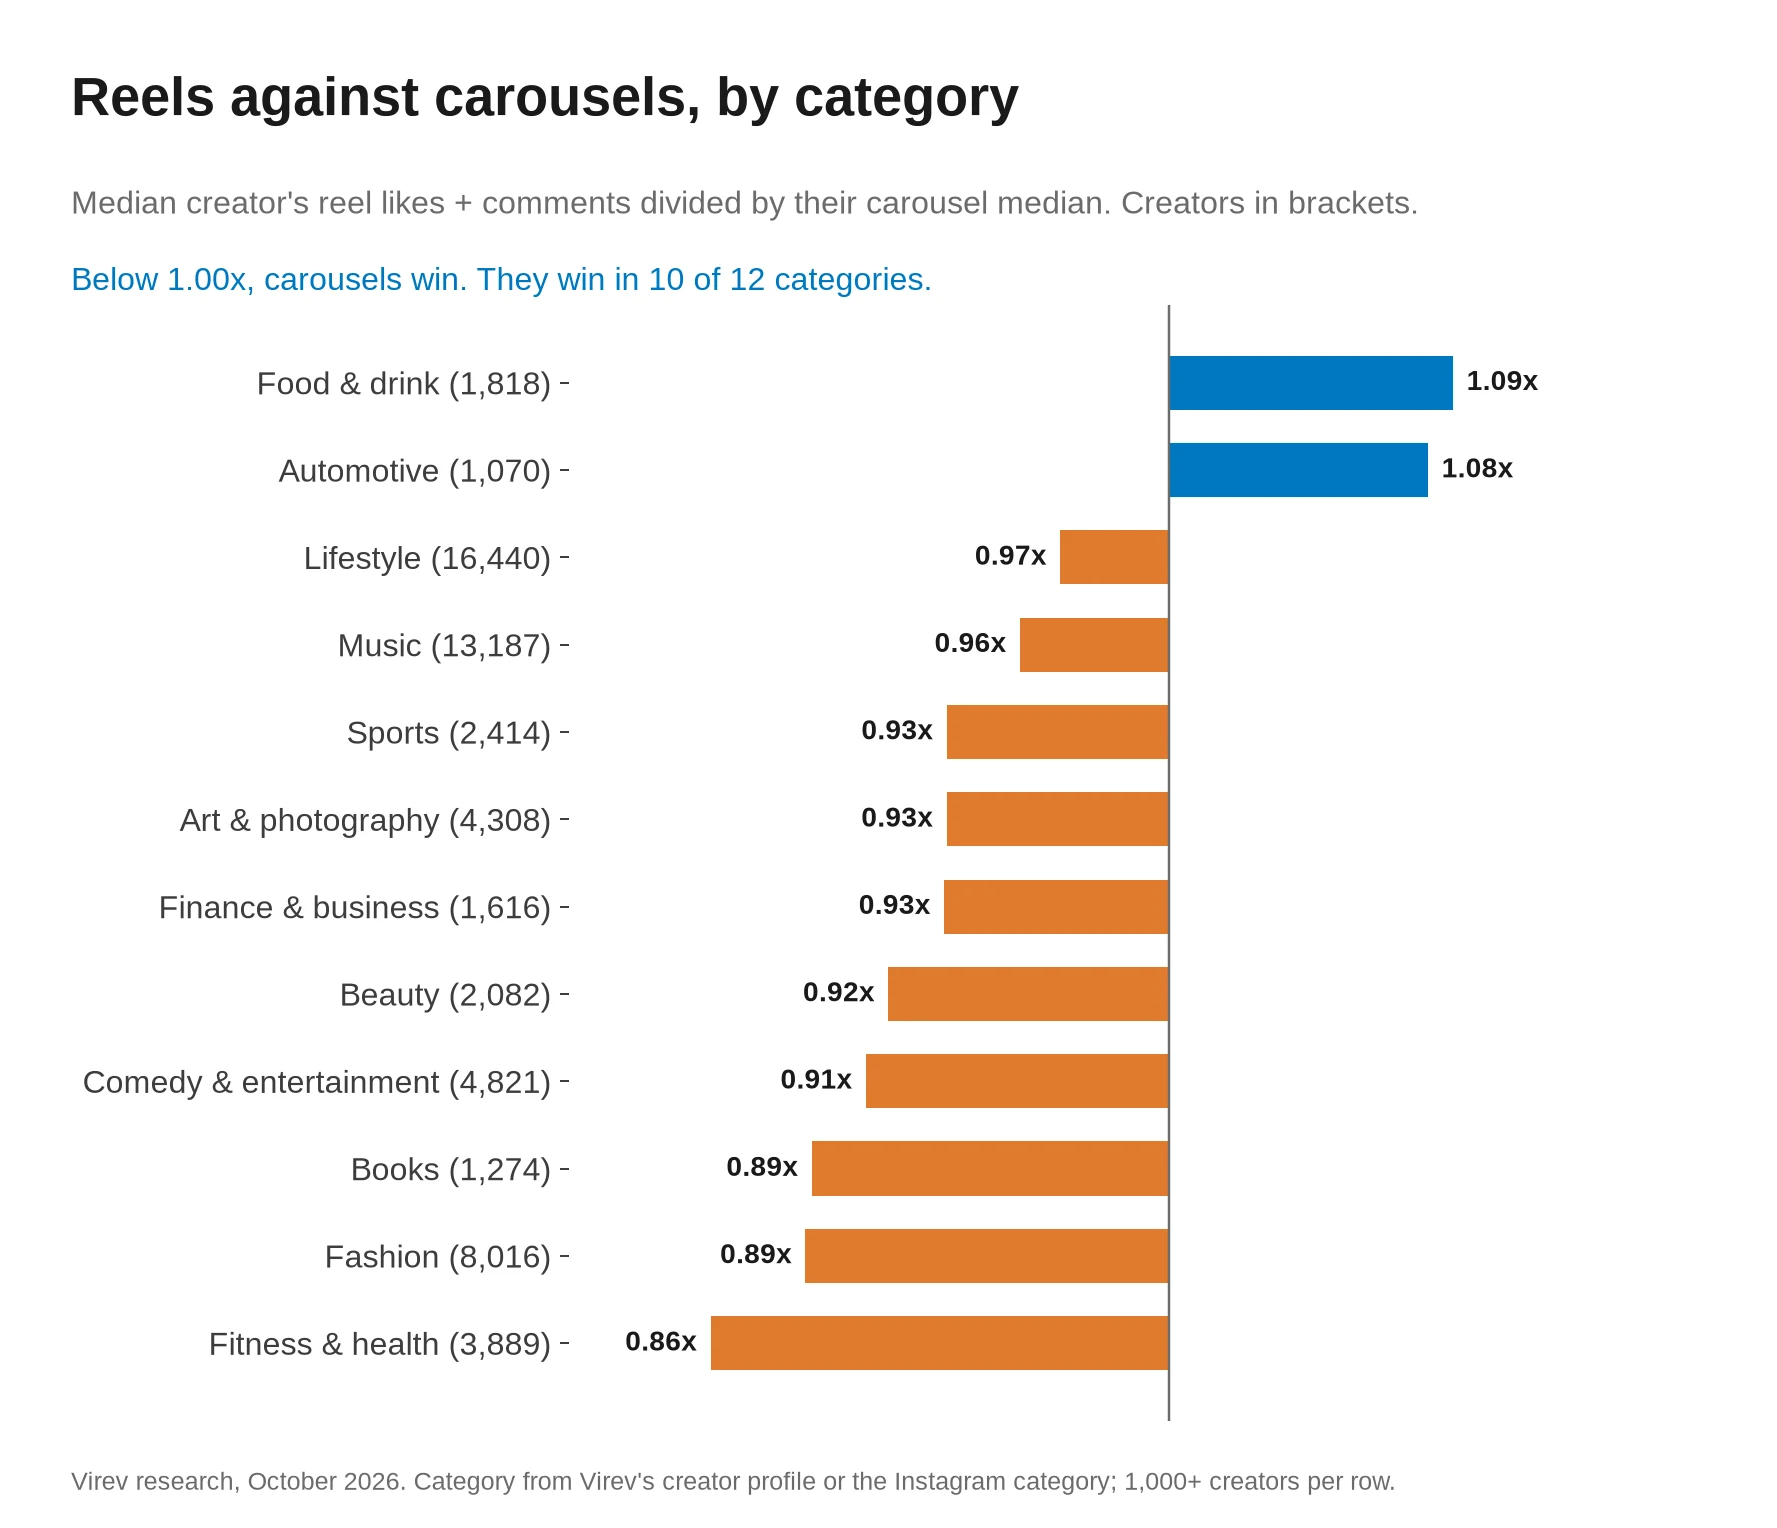
We took each creator's category from Virev's creator profile or their Instagram category. 63,973 of the 221,311 creators in the reel and carousel comparison have one.
| Category | Creators | Reel vs photo | Carousel vs photo | Reel vs carousel |
|---|---|---|---|---|
| Lifestyle | 16,440 | 1.33x | 1.27x | 0.97x |
| Music | 13,187 | 1.28x | 1.36x | 0.96x |
| Fashion | 8,016 | 1.12x | 1.25x | 0.89x |
| Comedy & entertainment | 4,821 | 1.33x | 1.42x | 0.91x |
| Art & photography | 4,308 | 1.31x | 1.41x | 0.93x |
| Fitness & health | 3,889 | 1.13x | 1.29x | 0.86x |
| Sports | 2,414 | 1.28x | 1.37x | 0.93x |
| Beauty | 2,082 | 1.35x | 1.37x | 0.92x |
| Food & drink | 1,818 | 1.42x | 1.35x | 1.09x |
| Finance & business | 1,616 | 1.23x | 1.26x | 0.93x |
| Books | 1,274 | 1.14x | 1.27x | 0.89x |
| Automotive | 1,070 | 1.63x | 1.46x | 1.08x |
"Creators" counts creators with 3 or more reels and 3 or more carousels. The two photo columns use the smaller set of those who also post 3 or more single photos, and the CSV has each count.
- Food and drink creators and automotive creators are the only two of 12 categories where reels beat carousels, at 1.09x and 1.08x.
- Fitness and health creators gain most from carousels, whose typical carousel got 1.16x the likes and comments of their reels, and 60.6% of them did better with carousels.
- Fashion, fitness and books creators get only 1.12x to 1.14x from a reel against a single photo, the smallest reel gains of the 12 categories.
- Creators with a category lean toward carousels at every follower count, with a reel-to-carousel ratio of 0.94x against 1.00x for creators without one. They are also larger, with median followers of 28,036 against 19,046, so read the category rows against each other more than against the all-creators row.
TikTok photo posts vs videos
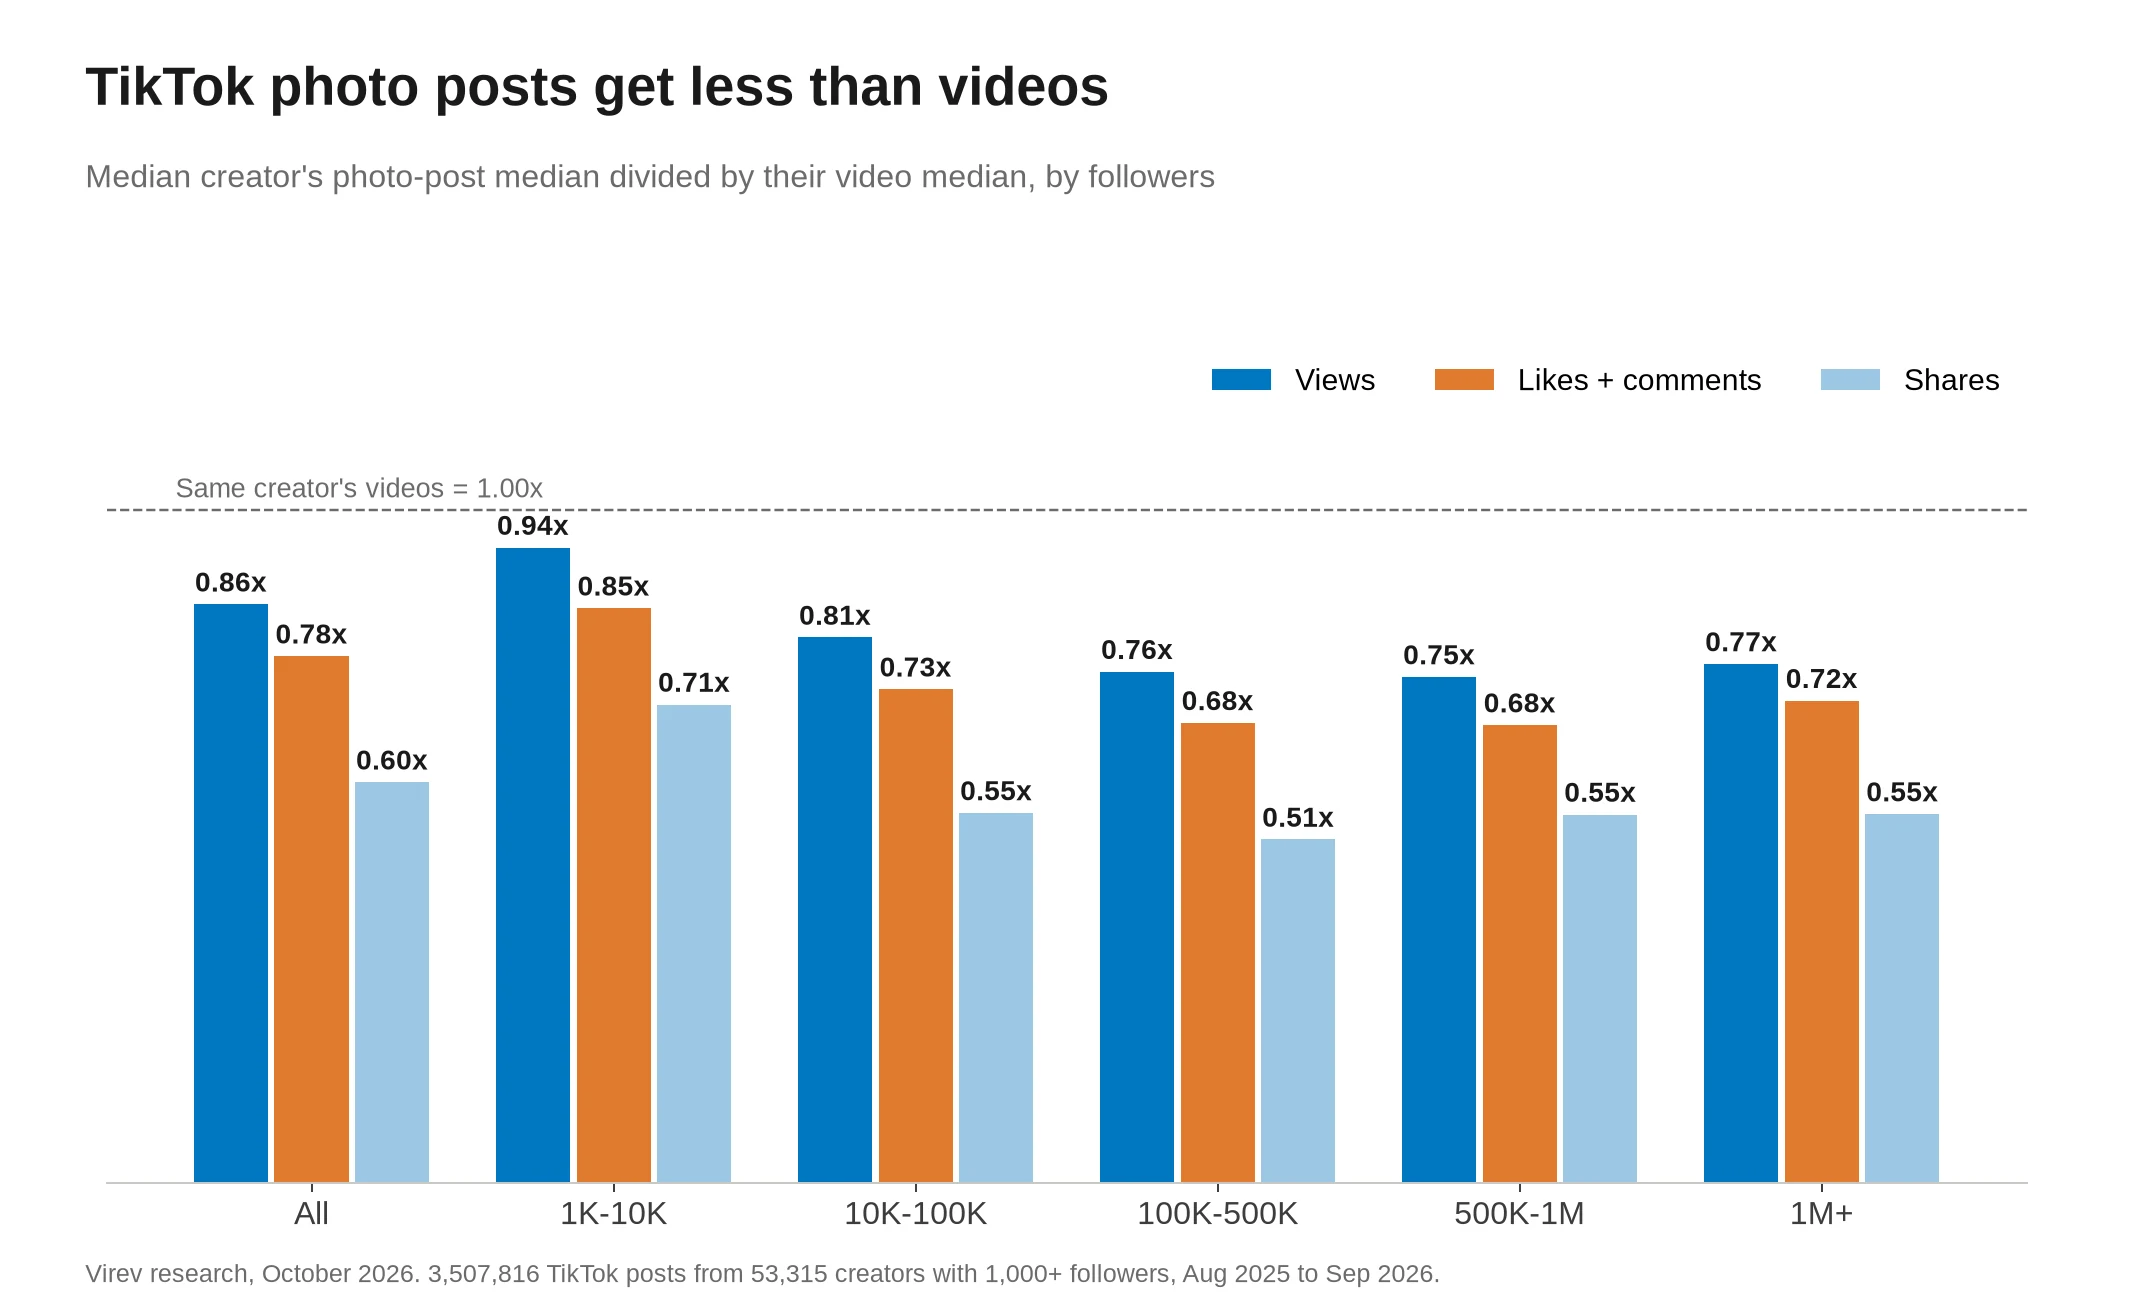
TikTok photo posts are swipeable sets of still images with sound. TikTok stores a length of 0 for them, which is how we found 235,055 photo posts, 6.7% of the TikTok sample, from 32,265 creators. We compared the photo posts of the 20,393 creators with 3 or more photo posts and 3 or more videos with their own videos.
| Followers | Creators | Views | Likes + comments | Shares | Likes + comments per view |
|---|---|---|---|---|---|
| All | 20,393 | 0.86x | 0.78x | 0.60x | 0.90x |
| 1K-10K | 8,653 | 0.94x | 0.85x | 0.71x | 0.89x |
| 10K-100K | 6,397 | 0.81x | 0.73x | 0.55x | 0.90x |
| 100K-500K | 3,128 | 0.76x | 0.68x | 0.51x | 0.91x |
| 500K-1M | 931 | 0.75x | 0.68x | 0.55x | 0.93x |
| 1M+ | 1,284 | 0.77x | 0.72x | 0.55x | 0.97x |
The shares column uses the 16,588 creators whose videos and photo posts both have a share median above zero.
- A photo post got fewer views than the same creator's videos at every follower count, from 0.94x for creators with 1,000 to 10,000 followers to 0.75x at 500,000 to 1 million.
- Shares fall the most, to 0.60x of the same creator's videos.
- People who see a photo post also like and comment a little less, at 0.90x the rate per view of a video.
- 38.6% of creators still got more views on their photo posts than on their videos, so test it on your own account before you drop the format.
- Photo posts are 12.1% of posts from creators with 1,000 to 10,000 followers and 2.9% from creators with over 1 million.
By category, lifestyle creators lose least, at 0.96x the views of their videos from 3,716 creators. Food creators lose most, at 0.61x from 352 creators, and comedy creators, the largest group with 6,184, get 0.82x.
Buffer's 2026 report puts TikTok video at a 3.39% engagement rate and images at 1.92%, from posts sent through Buffer. Our same-creator numbers point the same way.
Why Buffer and Socialinsider say carousels win
Both reports use brand accounts and a different measure from ours.
- Socialinsider averages likes plus comments per follower over 67,541,436 brand posts, so its carousel lead of 0.50% against 0.48% compares different brands, not one account's formats.
- Buffer divides likes, comments, saves and shares by reach. Buffer's report says reels are built for views and reach, which lowers their rate per person reached, so a reel can get more likes in total and still show a lower rate.
- Buffer's own split shows this, with reels at 1.36x the reach of carousels and carousels at 2.09x the engagement rate per reach.
The same-creator comparison needs no denominator. It compares the likes and comments one creator got on each format, and on that measure reels and carousels tie for most creators.
How this fits our Instagram algorithm study
Our Instagram algorithm study used the same 19,863,062 posts and reported reels at 1.54x and carousels at 1.45x a single photo. That number comes from a model that averages the log of likes plus comments over every post and holds caption length, hashtags, @mentions, Collab posts, sponsorship, posting gap, post age and month equal. We rebuilt it one step at a time.
| Model step | Reel vs photo | Carousel vs photo | Reel vs carousel |
|---|---|---|---|
| Format only | 1.59x | 1.47x | 1.08x |
| Plus post age and month | 1.59x | 1.47x | 1.08x |
| Plus Collab and sponsored | 1.54x | 1.46x | 1.06x |
| Plus caption length | 1.55x | 1.45x | 1.06x |
| Plus hashtags, mentions and gap (full model) | 1.54x | 1.45x | 1.06x |
| Median creator, this page | 1.43x | 1.42x | 0.98x |
- The full model gives back the published 1.54x and 1.45x.
- The model reports an average, and a minority of creators whose reels do far better than their other posts pull the reel average up.
- On the model's log scale, the average creator's reels get 1.08x their carousels and the median creator's get 1.02x, from 221,370 creators with 3+ of each.
- The median creator, the measure on this page, gets about the same from a reel and a carousel.
Both measures agree that a single photo comes last and that reels and carousels each earn about 1.4x to 1.5x of it.
Our TikTok algorithm study found photo posts at 0.81x the views of the same creator's 10 to 20 second videos in the same month. Here we compare with all of a creator's videos, which include longer videos that get more views, and get 0.86x. Both find that big accounts lose more on a photo post.
What to do with this
For creators
- Pick between a reel and a carousel by the idea, because the typical creator gets the same likes and comments from both.
- Post fewer single photos, since a photo was the best format for only 15.0% of creators who post all three, and put the photo in a carousel instead.
- If you have over 500,000 followers, post more carousels, which beat reels for 61.9% of creators above 1 million.
- Use reels to reach new people, since only reels show a view count and Buffer measured 1.36x the reach of carousels.
- Check your own split by taking your last 30 posts, finding the median likes plus comments per format and comparing them, as in our guide to comparing reel performance at the same age.
For brands
- Do not pay a carousel premium or a reel premium by default, because for most creators the two formats get the same engagement.
- Ask for the creator's median likes and comments on the format you are buying, because 41.5% of creators do best with carousels and 42.4% with reels.
- On TikTok, expect a photo post to get about 0.86x the views of the creator's videos and 0.60x the shares.
- Compare a creator's engagement with creators of the same size, using our Instagram engagement rate benchmarks.
- Virev creator search covers 180M+ creators on Instagram, TikTok and YouTube and shows each one's recent posts with their likes, comments and views, so you can see which format works for a creator before you book.
Start a 3-day trial to run your first search.
How we measured, and what can be wrong
- The Instagram sample is the post set of our Instagram algorithm study, which holds public accounts with 1,000+ followers read from August 3 to October 3, 2026, and removes brands, media, businesses and organizations by Virev's profile label or Instagram category.
- Posts are feed posts and reels that are not pinned, show likes, are at least 3 days old at the read and were posted within a year before it, and giveaway posts are left out because entry rules inflate their comments.
- Each creator has at least 6 posts and a median above zero, which leaves 19,863,062 posts from 384,002 creators.
- Format comes from Instagram's product type for each post, and a carousel can hold photos, videos or both.
- Likes plus comments come from the public counts at our read, and Instagram does not show saves, shares or reach on other people's posts.
- A format comparison uses only creators with 3 or more posts in each format, and the creator count changes from row to row.
- When we dropped Collab posts and sponsored posts, carousels sat at 1.05x the creator's median post, reels at 1.01x and single photos at 0.86x, close to the 1.05x, 1.02x and 0.85x with them.
- When we kept only posts 7 to 89 days old at the read, carousels sat at 1.03x, reels at 1.01x and single photos at 0.86x.
- When we compared each post with the same creator's posts from the same month, reels and carousels both sat at 1.00x and single photos at 0.91x.
- Creators choose a format for each idea, and a creator may save a strong idea for a reel or a carousel, so part of each gap may come from the idea.
- The TikTok sample is the video set of our TikTok algorithm study, which holds public creator accounts with 1,000+ followers and 10 or more videos and removes ads and giveaways, and a length of 0 marks a photo post, which we checked by hand on two posts.
- Category comes from Virev's creator profile or the Instagram category and covers a minority of creators, as the category section explains.
- Our crawler collects accounts for creator marketing, so the sample holds more active creators than Instagram or TikTok as a whole.
Download the data
The tables behind every chart and table are in one CSV: reels-vs-carousels-vs-photos-2026.csv. Each row has a table name, a platform, a follower tier or category, a format or format pair, the metric, the post and creator counts, and the value. The tables are format_vs_own_median, paired_same_creator (with views, likes_comments, shares and per-view variants for TikTok), engagement_rate_by_followers, reel_views, joint_model_bridge and joint_model_bridge_weighting. In a paired row, share_beating is the share of creators whose first format won and share_tie the share with equal medians, so the carousel share in a reel vs carousel row is what remains. The tables are free to reuse under CC BY 4.0.
Cite as Virev, "Reels vs carousels vs photos (2026)", October 2026, https://virev.ai/blog/reels-vs-carousels-vs-photos.