



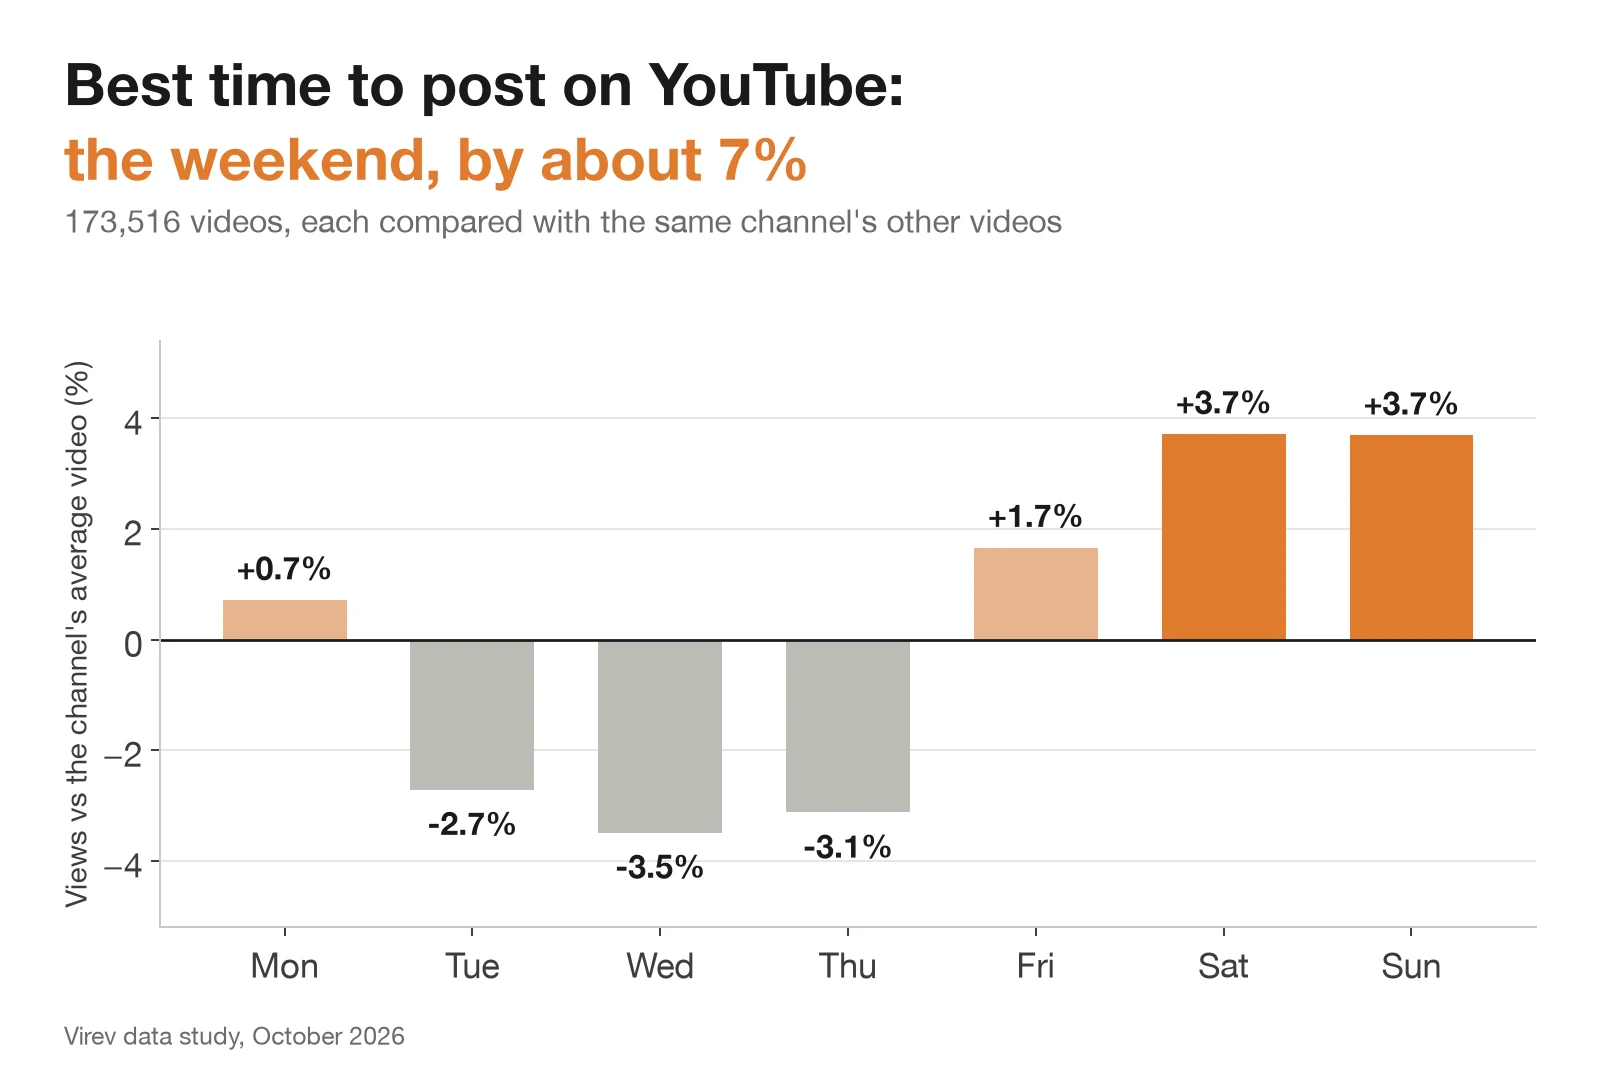
Post your YouTube videos on Saturday or Sunday. In our data, the weekend is the one timing choice that moves views by a clear amount. We compared 173,516 long-form YouTube videos with other videos from the same channel. A video uploaded on a Saturday or Sunday gets 7.0% more views than one uploaded Tuesday to Thursday. Wednesday is the weakest day, at 3.5% under the channel's average.
The hour matters less. Across the 3-hour windows that hold most uploads, the best (6 to 9 AM) and the worst (3 to 6 PM) are 3.4% apart. Two other choices move views more than the clock: how soon a video follows the last one, and how long it is.
7.0%
Weekend
3.4%
Hour
12%
Too soon
This study is one of three. For the other apps, read our studies of the best time to post on TikTok and the best time to post on Instagram. They use the same method.
The short answer
All times are the channel's local time. Each number is how many more or fewer views a video gets than the same channel's average video.
| Day | Share of uploads | Views, same channel | Same-month check | Pooled |
|---|---|---|---|---|
| Mon | 12.8% | +0.7% | +2.0% | -7% |
| Tue | 13.6% | -2.7% | -3.4% | -11% |
| Wed | 15.4% | -3.5% | -3.6% | -16% |
| Thu | 14.2% | -3.1% | -3.8% | -11% |
| Fri | 16.0% | +1.7% | +1.3% | -2% |
| Sat | 14.4% | +3.7% | +4.5% | +23% |
| Sun | 13.6% | +3.7% | +4.8% | +31% |
"Same-month check" compares each video only with the same channel's videos from the same month. "Pooled" is the method most published studies use: median views per subscriber across all channels, with no same-channel comparison.
Channels upload most on Friday and Wednesday, and least on Monday. Wednesday is the second-busiest day for uploads and the worst day for views.
| Window | Share of uploads | Views, same channel | Pooled |
|---|---|---|---|
| 12 to 3 AM | 2.2% | +4.4% | -29% |
| 3 to 6 AM | 1.2% | -6.9% | -22% |
| 6 to 9 AM | 9.8% | +1.4% | -4% |
| 9 AM to noon | 15.2% | +0.1% | -6% |
| Noon to 3 PM | 18.1% | -0.8% | 0% |
| 3 to 6 PM | 19.6% | -1.9% | 0% |
| 6 to 9 PM | 25.5% | +1.1% | +11% |
| 9 PM to midnight | 8.3% | +0.9% | -7% |
The windows between midnight and 6 AM hold 3.4% of uploads, so their numbers move a lot by chance. Among the six windows that hold the rest, the spread is 3.4%: 6 to 9 AM at +1.4%, 3 to 6 PM at -1.9%. By single hour, 8 PM does best (+3.3%, 11,518 videos) and 3 PM worst (-3.2%).
Pooled data shows a 56% weekend lead, same-channel data 7%
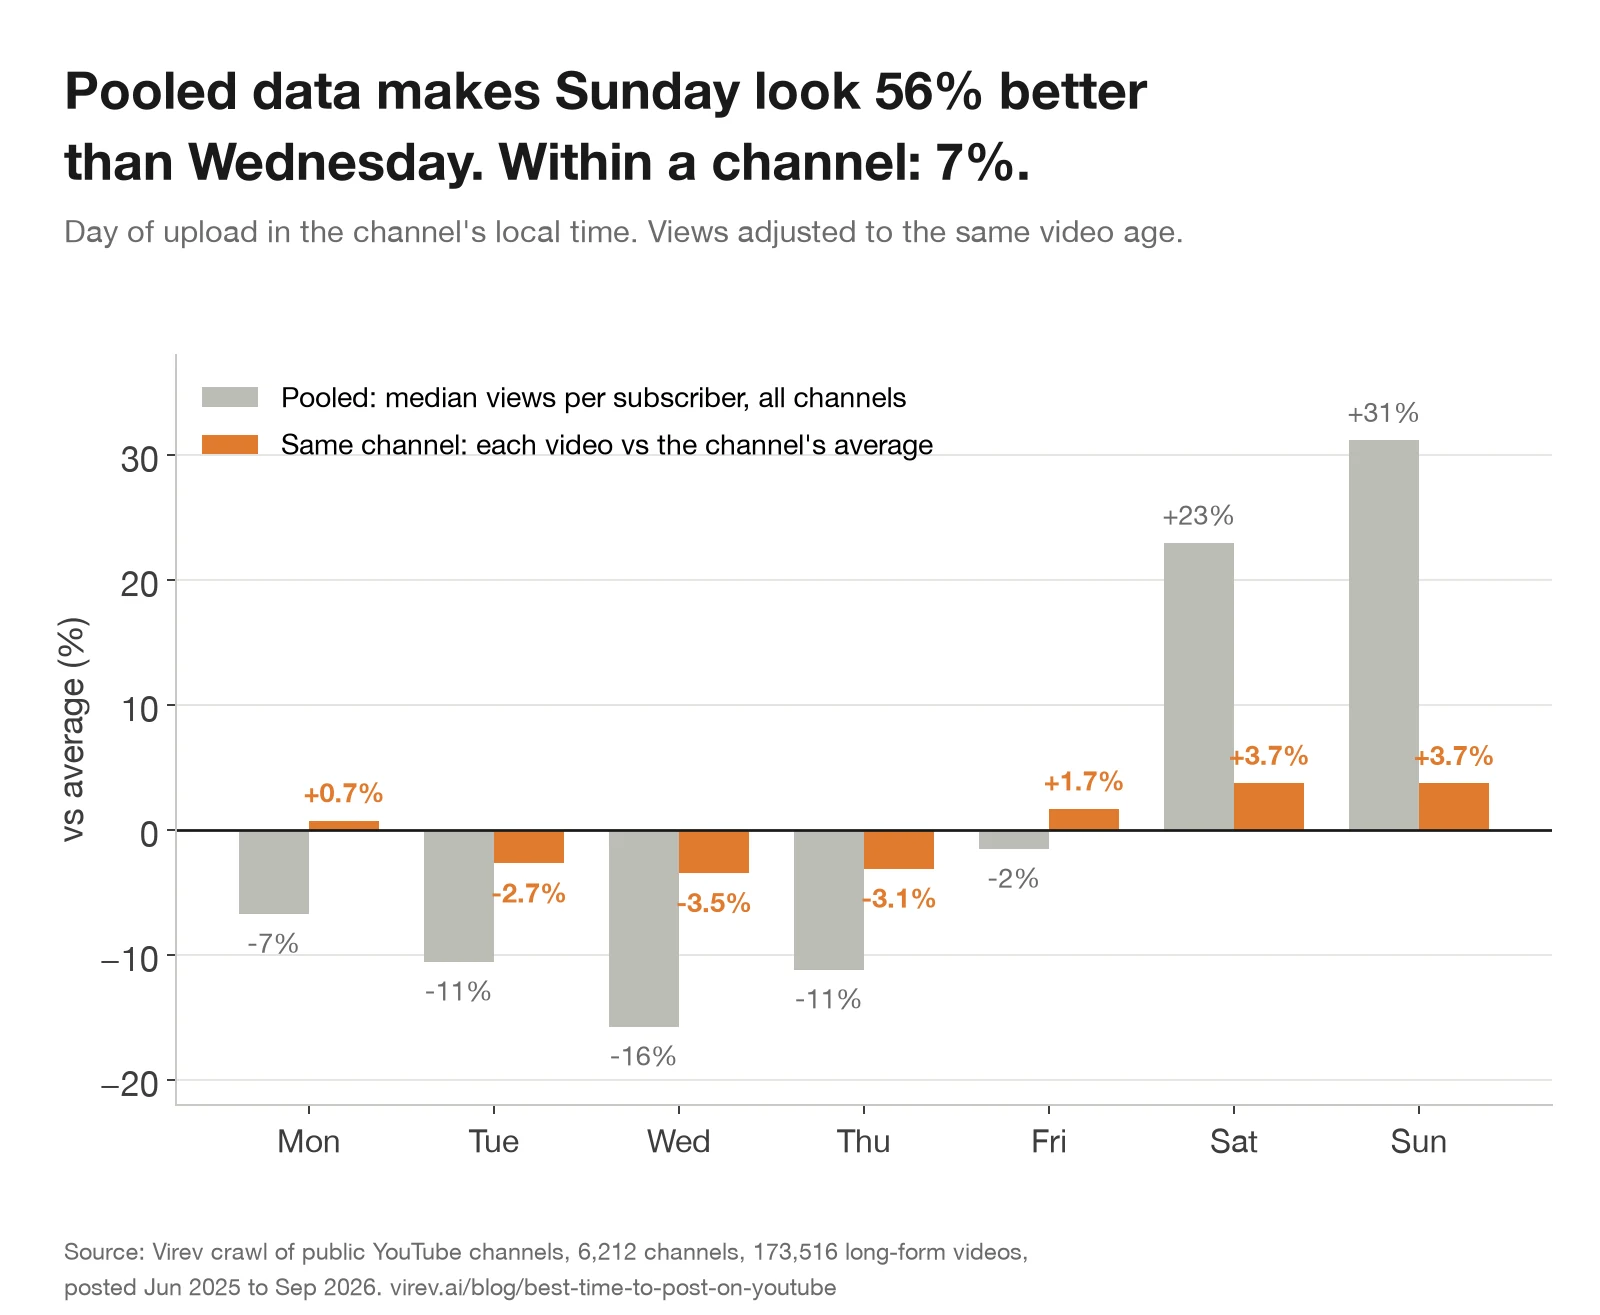
Both methods pick the weekend, but by very different amounts. Pooled across all channels, Sunday videos get 56% more views per subscriber than Wednesday videos. Within the same channel, the gap is 7.4%.
Most of the pooled gap comes from which channels upload on weekends. Channels that upload once a week or less put 36% of their videos on Saturday or Sunday. Channels that upload eight or more times a week put 24% there. The once-a-week channels get a median of 0.30 views per subscriber per video; the daily channels get 0.012, 24 times less. So the pooled weekend is partly a weekly-uploader weekend.
Our same-channel result agrees with the one other published study that compares each upload with its own channel. vidIQ measured 40.2 million US uploads and found Sunday 3.5% and Saturday 2.2% over a channel's average day, and Wednesday 2.2% under. Studies built on pooled scheduler data give other answers. SocialPilot, with 301,000 videos from its own customers, recommends Wednesday to Friday from 2 to 4 PM, which is the weakest part of the week in our data.
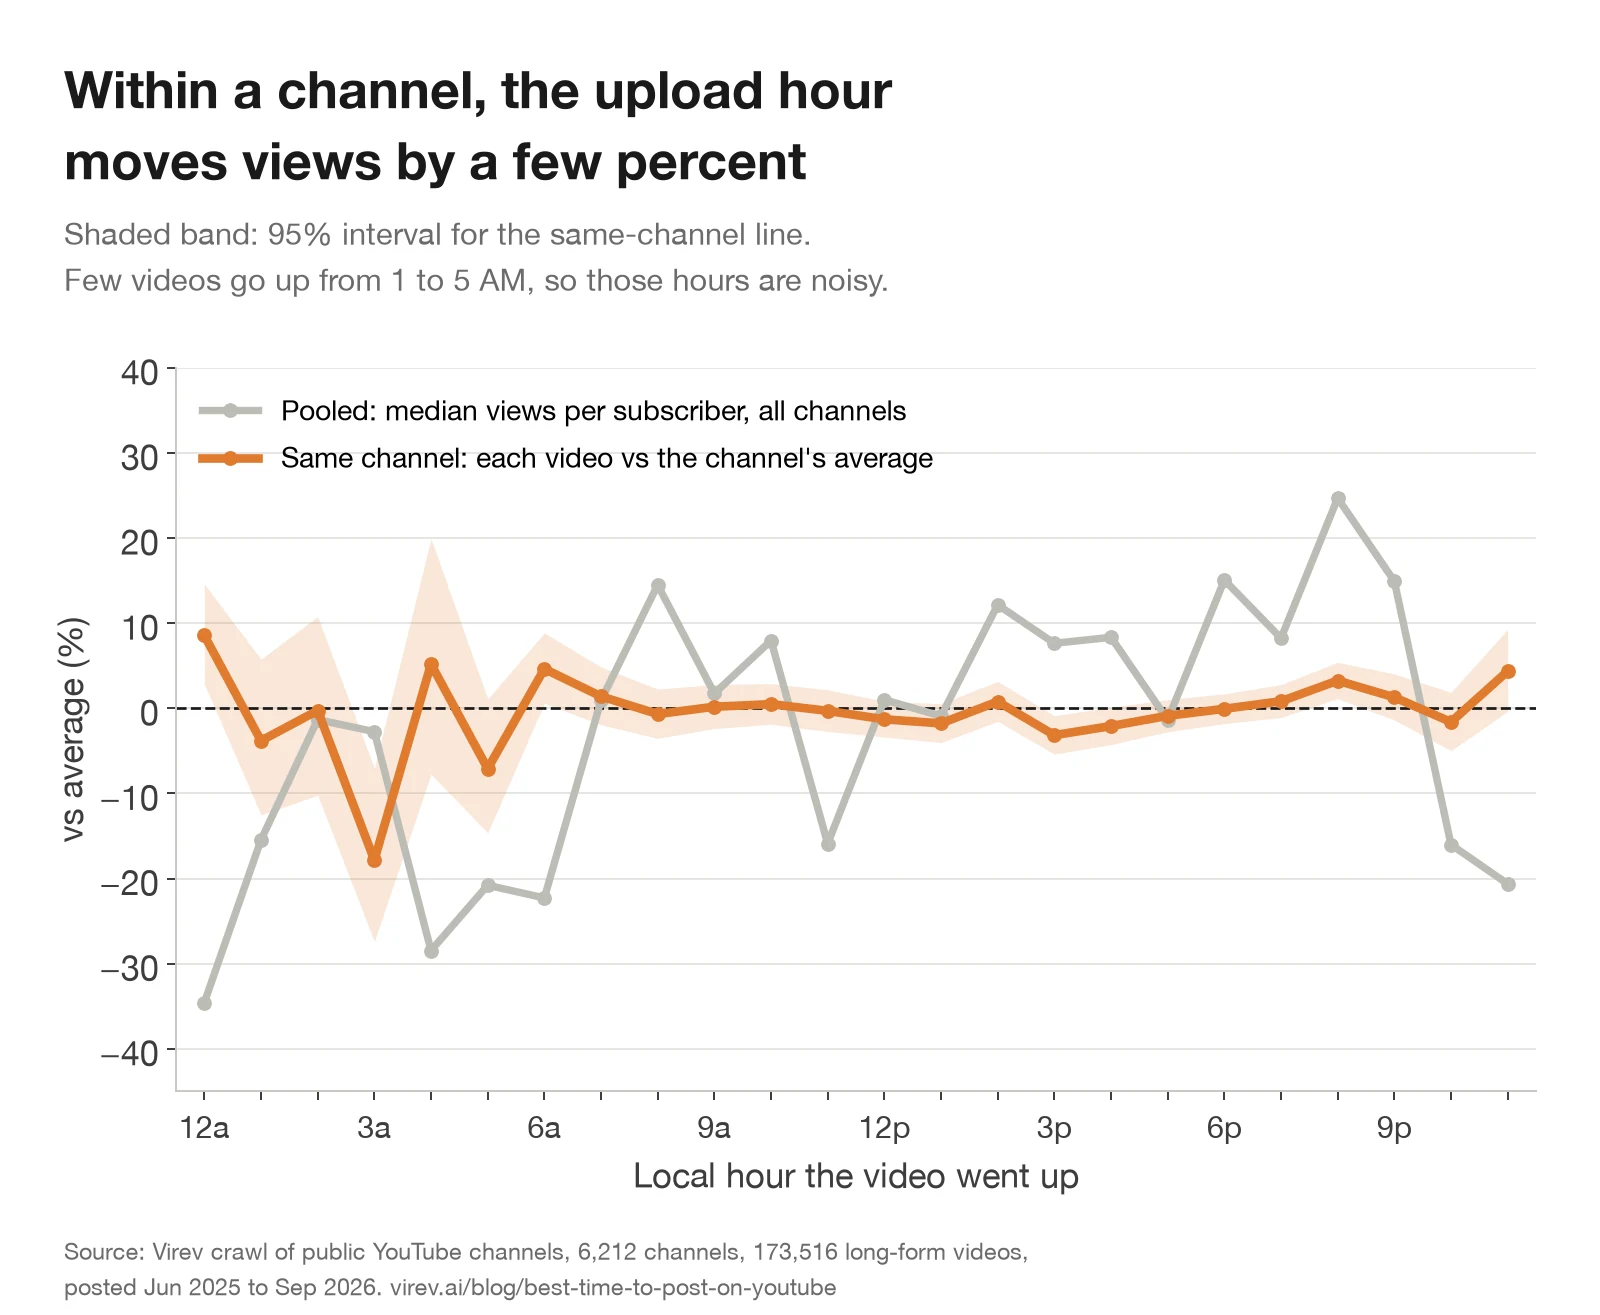
The hour shows the same pattern. Pooled, the evening from 6 to 9 PM gets 11% more views per subscriber than average, and the hours after midnight 22% to 29% fewer. Within the same channel, every hour from 6 AM to midnight is within 5% of average.
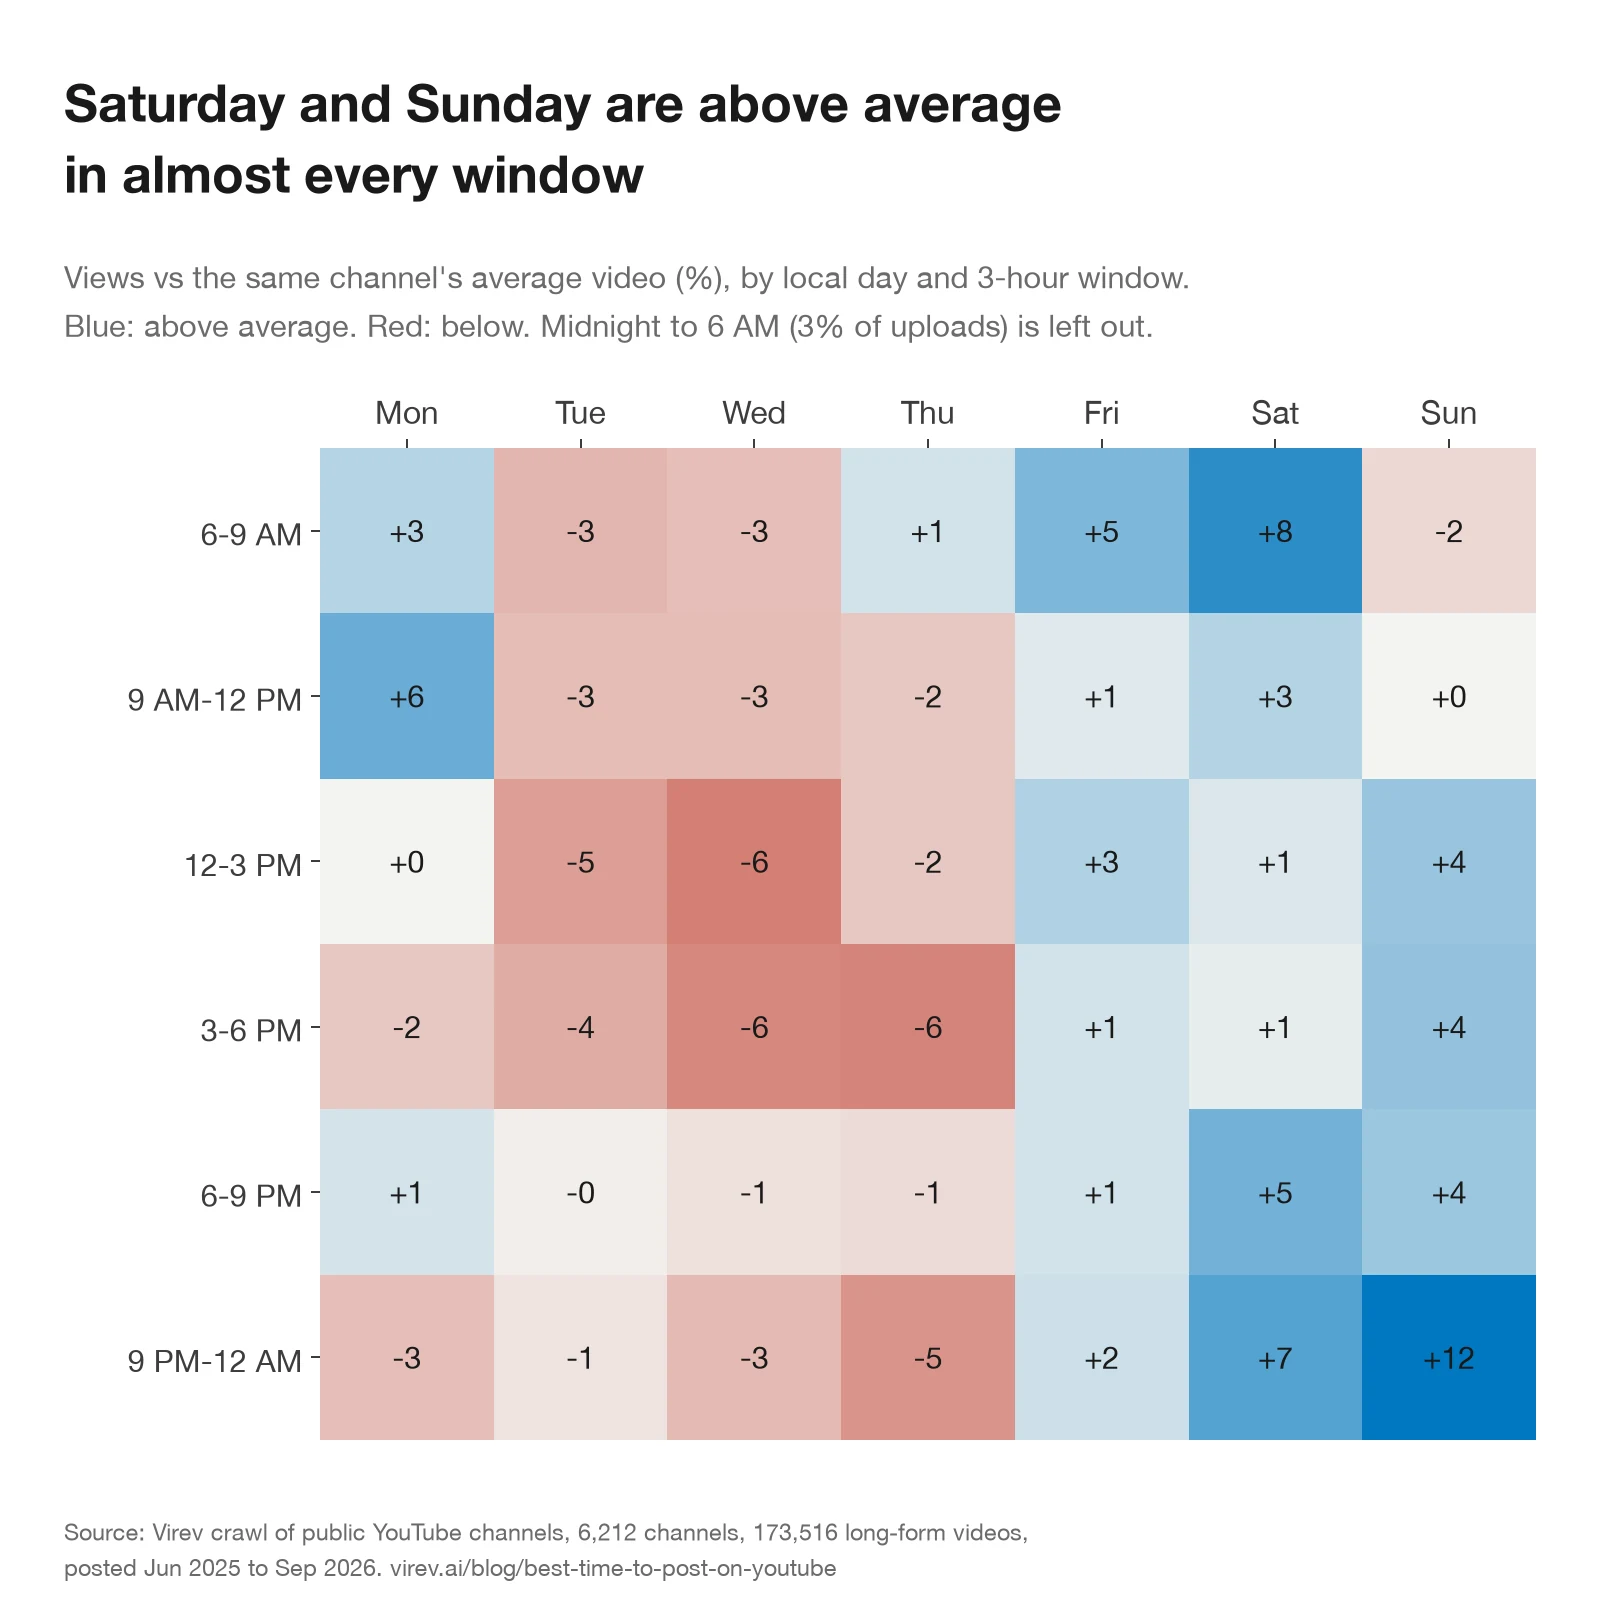
Day by window, the best cells are Sunday from 9 PM to midnight (+12%), Saturday from 6 to 9 AM (+8%) and Saturday from 9 PM to midnight (+7%). The worst are Wednesday and Thursday afternoons, at -6%. Friday is above average in most windows.
Your usual window matters more than the hour
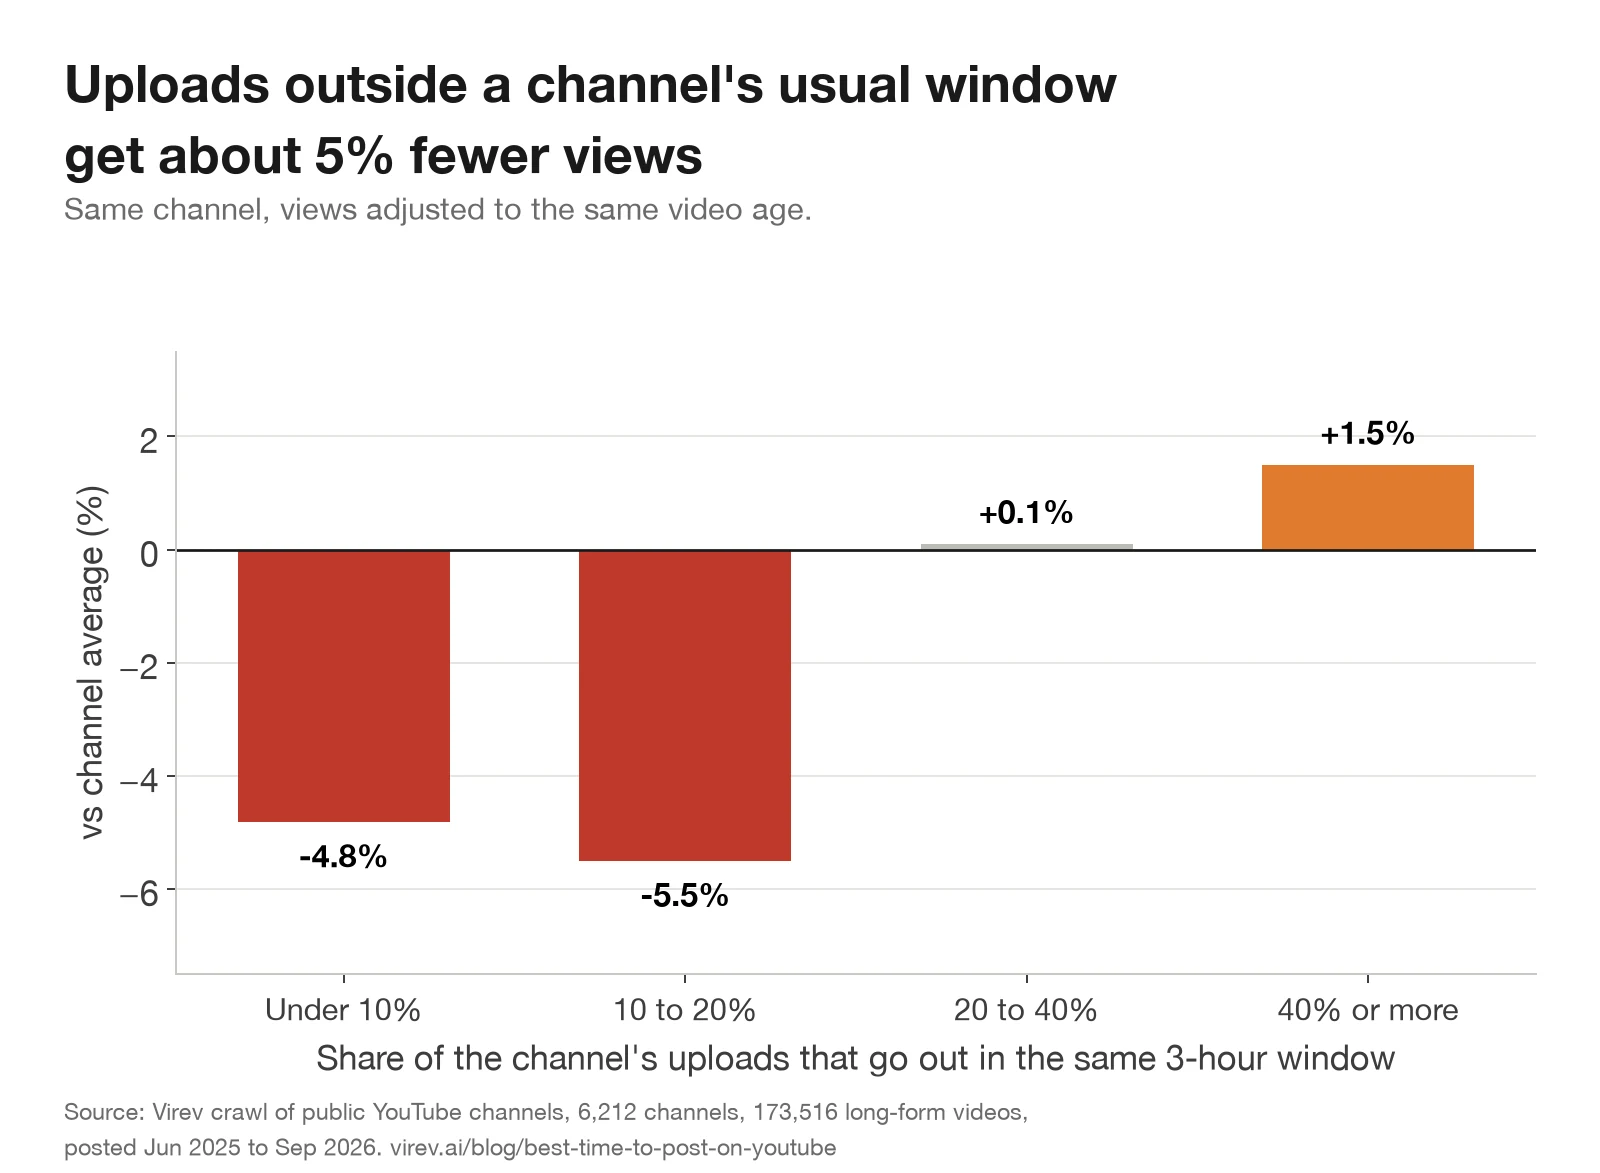
61% of uploads go out in a window the channel uses for at least 40% of its videos. Those get 1.5% more views than the channel's average. Uploads in a window the channel uses for less than a fifth of its videos get about 5% fewer. That gap, 6% to 7%, is larger than the gap between the best and worst hours of the day. The same-month check gives the same order.
We cannot tell from this data why. Subscribers may expect a video at the usual time. Or an off-schedule upload may be a different kind of video: a quick reaction, a clip, a late upload. The Doctor Mike case below shows the second explanation is not always right.
By region and country
| Region | Channels | Videos | Weekend vs weekdays | Best day | Worst day |
|---|---|---|---|---|---|
| Americas | 2,541 | 67,448 | +7.5% | Sun | Wed |
| Europe, Africa, Middle East | 1,674 | 43,664 | +4.8% | Sat | Tue |
| Asia-Pacific | 1,997 | 62,404 | +3.0% | Fri | Thu |
The weekend lead holds in all three regions and is largest in the Americas. "Weekend vs weekdays" compares Saturday and Sunday uploads with Monday to Friday uploads from the same channel.
| Country | Channels | Videos | Weekend vs weekdays | Best day | Worst day |
|---|---|---|---|---|---|
| United States | 1,954 | 50,372 | +7.9% | Sun | Wed |
| India | 775 | 25,121 | -0.5% | Fri | Thu |
| United Kingdom | 346 | 8,495 | +9.7% | Sat | Wed |
| Japan | 292 | 7,939 | +8.4% | Sun | Thu |
| Indonesia | 177 | 6,061 | +9.9% | Sun | Thu |
| Brazil | 158 | 5,356 | +4.3% | Mon | Wed |
| Canada | 157 | 3,709 | -2.4% | Mon | Wed |
| Mexico | 142 | 4,421 | +12.9% | Sat | Mon |
| France | 142 | 3,605 | +16.3% | Sat | Thu |
| Russia | 133 | 3,286 | +11.9% | Sun | Tue |
| Spain | 123 | 3,006 | +7.0% | Mon | Tue |
| Thailand | 114 | 3,476 | -9.8% | Tue | Sun |
| Germany | 106 | 3,234 | +6.9% | Fri | Wed |
The weekend wins in 10 of the 13 countries with 100 or more channels. India is flat, with Friday best. Thailand is the exception, at nearly 10% under on weekends, and Canada is slightly under. In the US, Sunday is 6.3% over the channel's average and Wednesday 5.6% under, about twice the size vidIQ found on its US data. Countries with 100 to 200 channels can move by 5 points or more by chance.
By subscriber tier
| Tier | Channels | Videos | Weekend vs weekdays | Best day | Best window | Its lift |
|---|---|---|---|---|---|---|
| 1K to 10K | 708 | 14,927 | +8.6% | Sat | 6 to 9 AM | +2.9% |
| 10K to 100K | 1,277 | 26,671 | +8.1% | Sat | 6 to 9 PM | +4.4% |
| 100K to 1M | 2,211 | 65,556 | +4.5% | Sun | 9 AM to noon | +1.9% |
| 1M to 10M | 1,736 | 56,591 | +4.1% | Sun | 9 PM to midnight | +5.2% |
| 10M+ | 280 | 9,771 | +2.7% | Fri | 9 PM to midnight | +8.5% |
Small channels gain most from the weekend: about 8% for channels under 100,000 subscribers, 4% to 4.5% for channels with 100,000 to 10 million, and 2.7% above 10 million. The largest channels do best late in the evening, as on TikTok. Their viewers live in many time zones, so the channel's own clock matters less.
By YouTube category
The category is the one YouTube shows on most of the channel's videos.
| Category | Channels | Videos | Weekend vs weekdays | Best day |
|---|---|---|---|---|
| Entertainment | 1,432 | 40,934 | +5.1% | Sat |
| People & Blogs | 1,212 | 32,038 | +2.6% | Fri |
| Gaming | 752 | 19,722 | +4.7% | Tue |
| Music | 676 | 16,526 | -2.3% | Fri |
| Education | 484 | 14,451 | +13.4% | Sat |
| News & Politics | 330 | 12,640 | +10.0% | Sun |
| Film & Animation | 325 | 10,061 | +5.2% | Sat |
| Howto & Style | 229 | 6,502 | +3.1% | Sun |
| Sports | 218 | 6,786 | +16.3% | Sun |
| Comedy | 173 | 4,779 | +4.2% | Sun |
| Science & Technology | 137 | 3,447 | +11.0% | Sun |
| Travel & Events | 120 | 2,555 | +3.6% | Thu |
Education, science and sports channels gain most from the weekend, by 11% to 16%. People watch long explainers and match reactions when they have time. Music is the one large category where weekday uploads do better: Friday is its best day, which fits the music industry's Friday release day.
Upload spacing and frequency
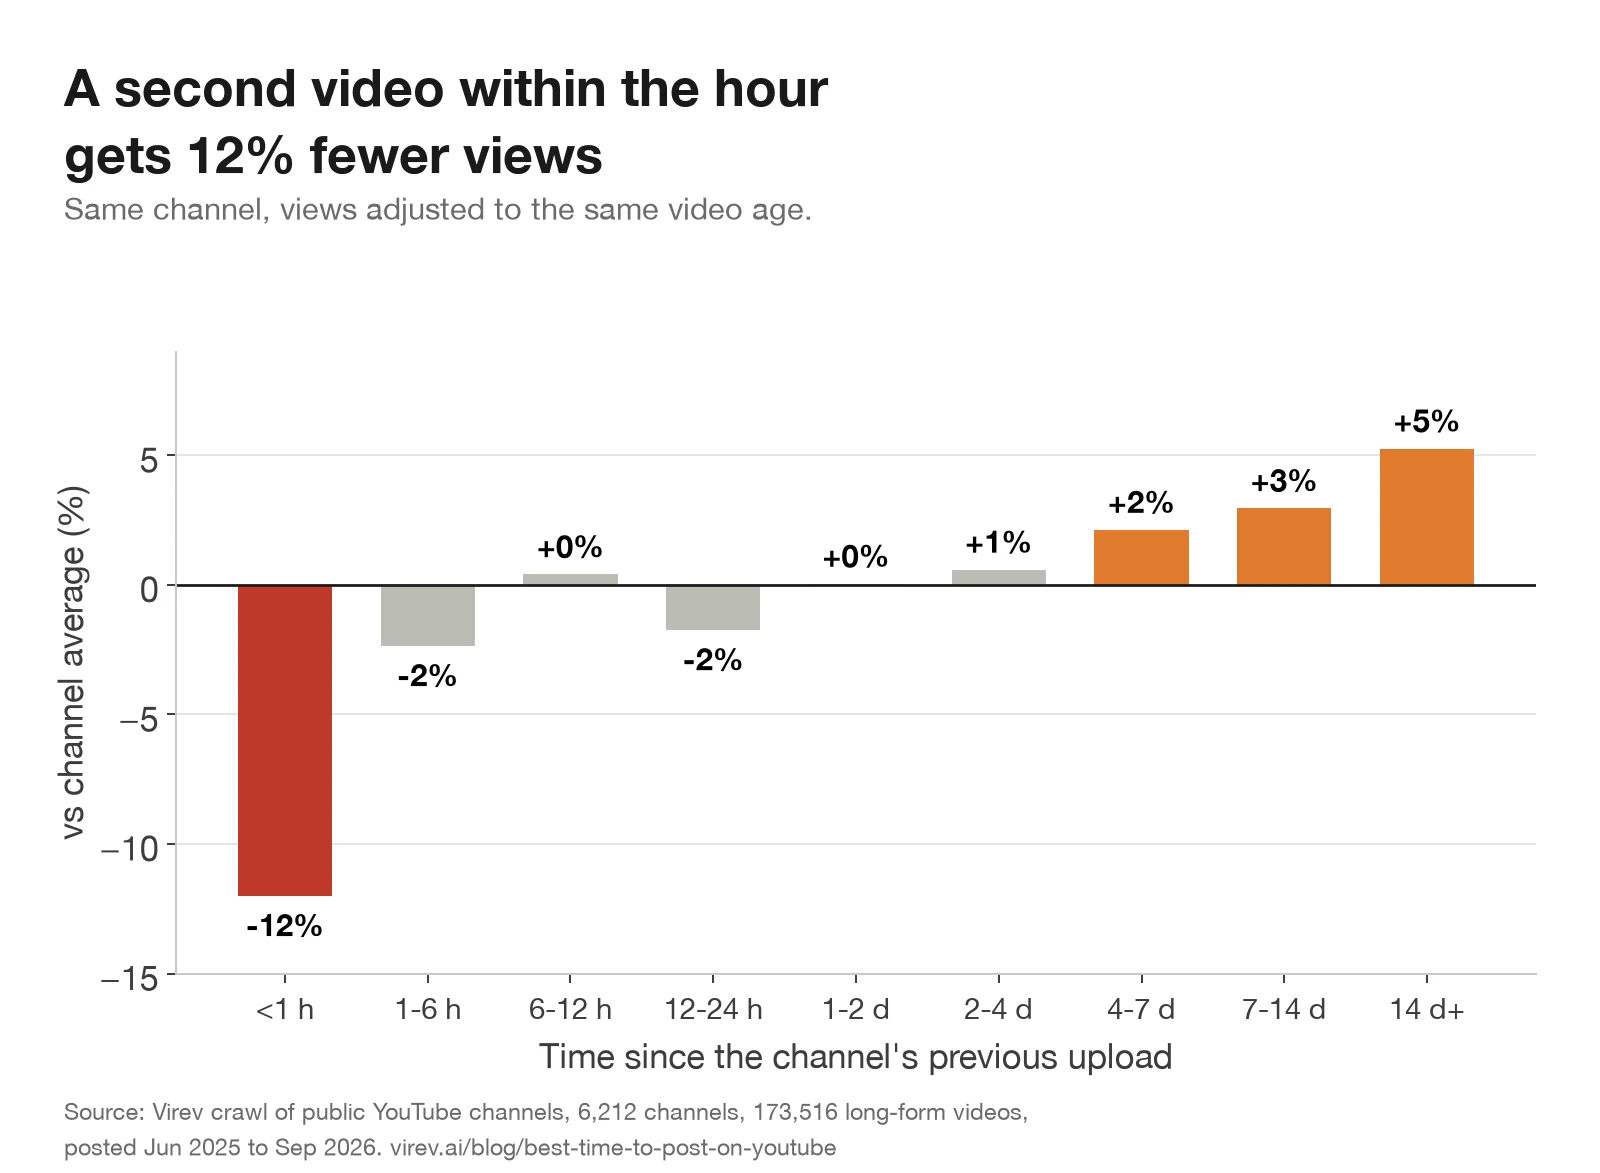
5.5% of the videos in our data went up less than an hour after the channel's previous upload. Those get 12% fewer views than the channel's average, and 8.7% fewer in the same-month check. From 6 hours on, the loss is 2% or less. Two videos in the same hour compete for the same home feed and the same notification.
Videos after a break of two weeks or more get 5% more views. That may say more about what channels post after a break than about the break.
| Uploads that week | Videos | Channels | Views per video, same channel |
|---|---|---|---|
| 1 | 44,105 | 4,594 | +5.0% |
| 2 to 3 | 53,888 | 4,366 | -0.9% |
| 4 to 7 | 44,115 | 2,224 | -1.3% |
| 8 to 14 | 14,625 | 613 | -2.9% |
| 15 or more | 16,783 | 264 | -3.8% |
In weeks with 8 to 14 uploads, each video gets 2.9% fewer views than the channel's average. The week holds four times as many videos as a week with 2 or 3, so the week's total views are far higher. The median channel in our study uploads 1.7 long-form videos a week.
Length moves views more than the clock
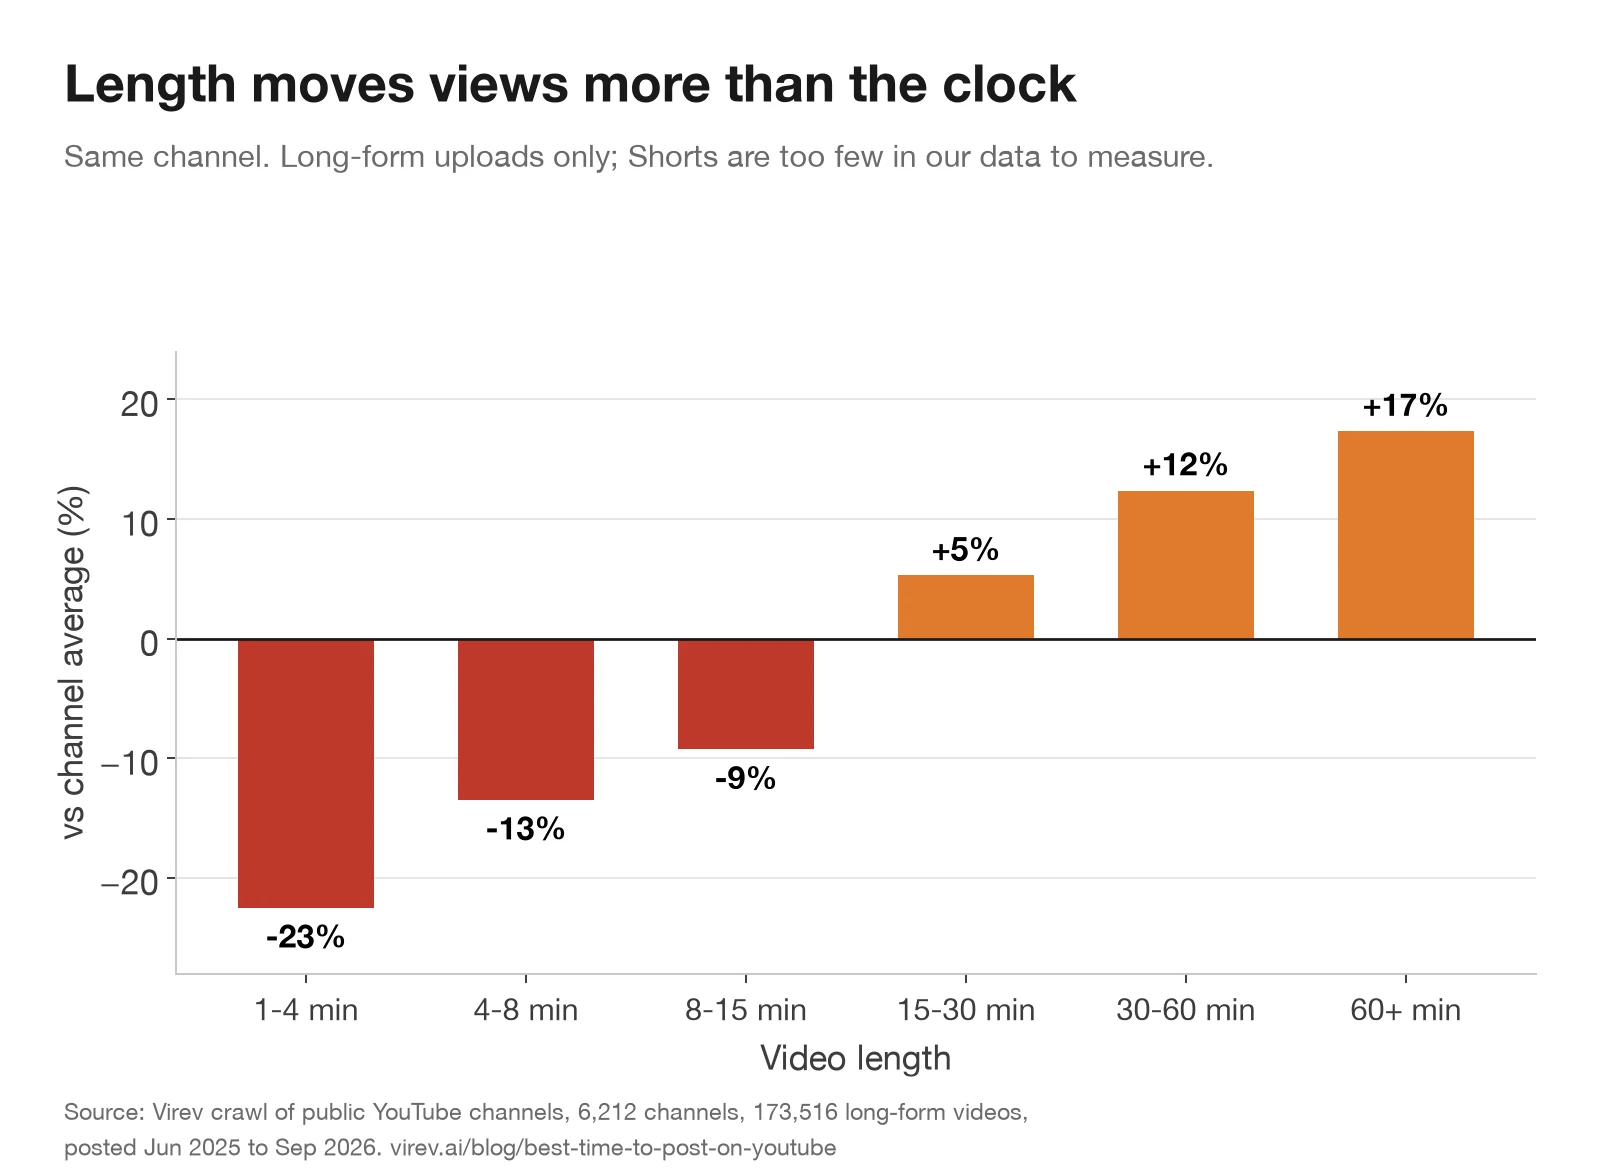
Within the same channel, a video of 30 to 60 minutes gets 12% more views than the channel's average, and a video of 1 to 4 minutes 23% fewer. Length is a choice about content as much as about format: a 2-minute clip and a 40-minute deep dive from the same channel are different videos. Still, the spread between lengths is more than ten times the spread between hours.
We could not measure Shorts. Of the 390,032 YouTube videos in our store, only 878 are Shorts, too few to measure. Buffer reports that Shorts do best on Friday evenings and long-form on Sunday mornings, from median engagement across its customers' accounts. We could not test that.
How fast long-form views arrive
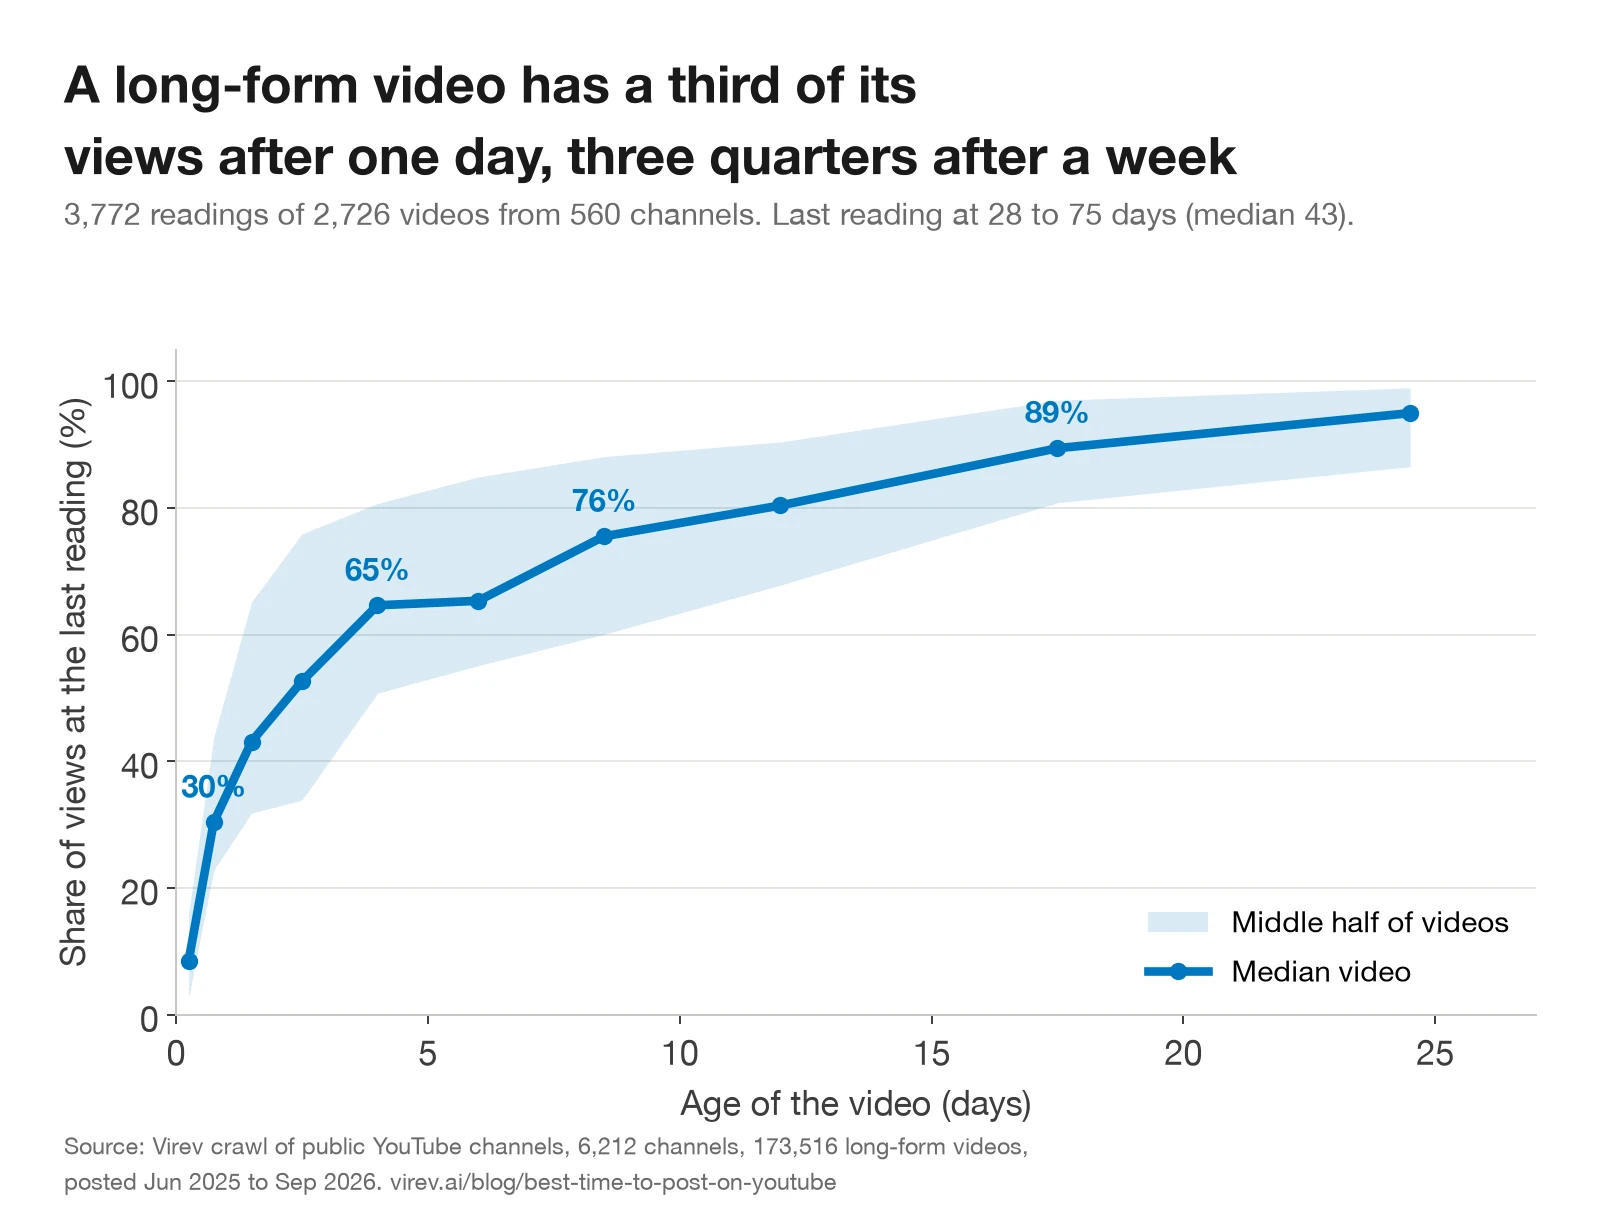
The top pages for this query say the first hours decide a video's reach. CollabPals tells creators to post "1-2 hours before" their audience's peak, and Buffer says early engagement signals decide whether YouTube recommends a video. Our crawler reads some videos more than once, so we can show how fast the views come.
A median long-form video has 30% of its day-43 views after one day, 65% after four days and 76% after a week. On TikTok, a video has 60% of its day-6 views after one day (TikTok study). A YouTube video still collects a quarter of its views after its first week. A video posted at 3 PM on a Wednesday is still being watched on Saturday, which may be why the upload hour matters so little.
It also means that the view count of a 3-day-old video and a 3-month-old video cannot be compared directly. Every result on this page uses views adjusted to a common age (see the method below).
Two channels: JackSucksAtGeography and Doctor Mike
Averages hide big swings for single channels. We picked two channels with 98 or more videos in our data and a clear schedule. We checked both in YouTube on October 3, 2026.
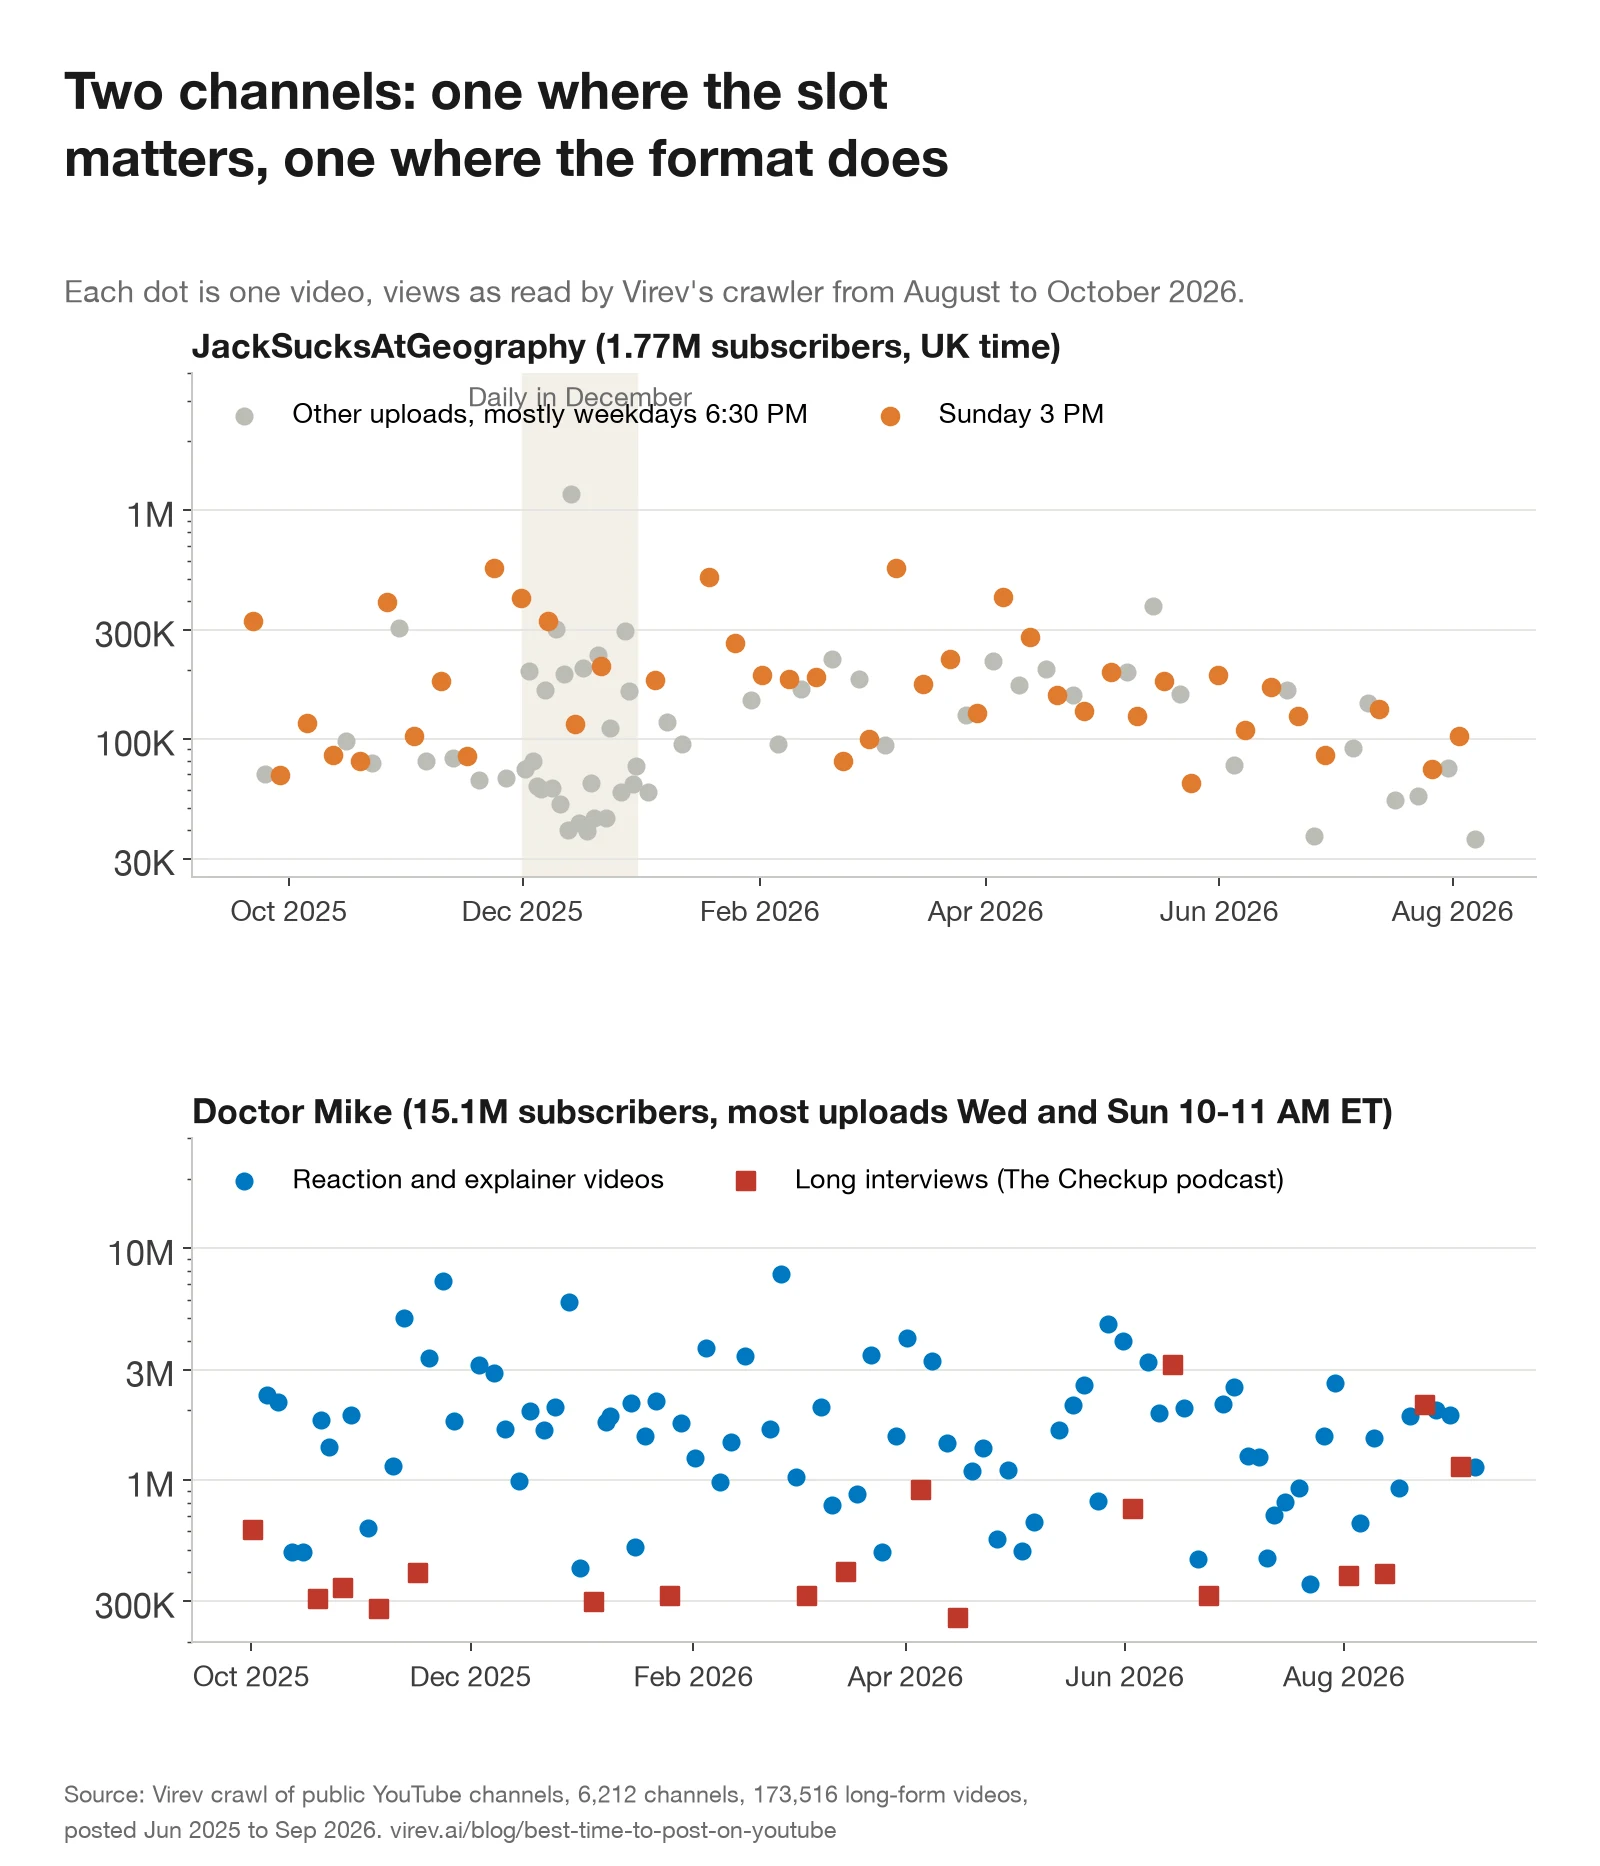
JackSucksAtGeography, where the slot holds the best series. Jack, a British geography YouTuber with 1.77 million subscribers, uploads at two times: Sunday at 3 PM UK time, and 6:30 PM on weekdays. Of his 101 videos in our data, 42 went up on Sunday at 3 PM, with a median of 171,400 views. The other 59 have a median of 93,900. Sunday holds his flagship formats: "Maps I Find ..." (median 218,700) and 1v1 matches against a Geoguessr pro. Without the map series, the Sunday median is still 135,800.
In December 2025 he uploaded almost every day: 28 videos, against 9 in November. The median video barely moved (78,400 against 84,000), and the month's total rose from 1.64 million to 4.56 million views. His weekday Geoguessr Duels videos that month had a median of 55,400. His most-viewed video in our data came from the daily run, on Saturday, December 13 at 6:31 PM: "There's 197 Countries, Can I Name Them All?" Our crawler read 1,178,145 views. On October 3, YouTube showed 1.2 million views and more than 16,000 likes.
Doctor Mike, where the format decides. Mike Varshavski, a family doctor with 15.1 million subscribers, uploads on Wednesday and Sunday between 10 and 11 AM Eastern time. 80 of his 98 videos in our data went out in that slot. Inside the slot, his 63 reaction and explainer videos have a median of 1.64 million views, and his 17 long interviews from The Checkup podcast a median of 391,400. "Doctor Reacts To 'Strange Addictions'" went up on Wednesday, February 25, 2026 at 11:01 AM and had 8.1 million views on October 3. A Checkup interview with astrophysicist Dr. Becky Smethurst went up on Wednesday, April 15 at 11:00 AM and had 264,000. Same weekday, same hour, 31 times the views.
His 17 other videos outside the slot, mostly reaction videos and several tied to new episodes of the TV show The Pitt, have a median of 1.79 million. They do as well as his on-schedule videos. For Doctor Mike, which video goes out matters far more than when.
What to do with this
For creators
- Put your strongest video of the week on Saturday or Sunday. Expect about 4% more views than your average, and 7% more than a Tuesday to Thursday upload, not double.
- Avoid midweek afternoons, especially Wednesday and Thursday from noon to 6 PM.
- Pick one or two upload windows and keep them. Videos in a channel's usual window do 6% to 7% better than videos in a window it rarely uses.
- Leave at least 6 hours between uploads. A second video within the hour loses 12% of its views.
- Upload more often if you can keep the quality. Each video lost about 3% in weeks with 8 to 14 uploads, and the week had four times as many videos.
- Check your own pattern. YouTube Studio's audience tab shows when your viewers are on YouTube. Compare each video with your median video, not with your best one. For your other platforms, our TikTok engagement rate calculator and Instagram engagement rate calculator give your median-post rate.
For brands and agencies
- Do not let a posting day decide the price of a YouTube integration. The weekend is worth about 4% more views than the channel's average.
- Ask the creator not to upload your sponsored video within an hour of another upload. That costs about 12% of the views.
- Judge the creator's usual video, not the best one. Our guide to evaluating a YouTube channel's back catalog before sponsoring it shows how, and tracking YouTube sponsorship performance over time covers the weeks after launch. Views keep coming for weeks: three quarters arrive in the first week.
- For what those views earn the creator, see our study of how much YouTube pays per view. A sponsored post also costs reach on its own: 31% of engagement on Instagram, in our sponsored post engagement study.
- Virev creator search shows each YouTube channel's recent videos and views, so you can see its own pattern before a campaign.
For journalists
The headline numbers, the CSV and the method are in the box at the top. The point that differs from most published advice: studies from scheduling tools pool their customers' channels. Pooled, Sunday looks 56% better than Wednesday. Compared with themselves, channels do 7% better on weekends than midweek, and the upload hour moves views by about 3%.
How we measured, and what can be wrong
- Channels: public YouTube channels with 1,000+ subscribers read by Virev's crawler. We removed channels that Virev's profile label marks as a brand, business, media company or organization. Most channels have no label, so some company channels, such as TV networks and publishers, remain. Leaving out News & Politics channels moves the weekday results by less than half a point and the common windows by less than one point.
- Videos: long-form uploads posted from June 1, 2025 to September 19, 2026, not live streams, read at least 3 days after upload. We removed 2,156 videos that showed 0 views at a reading at least 3 days old; these are probably members-only or not yet public. Each channel needed at least 10 videos.
- Local time: from the channel's country on YouTube or in Virev's profile (6,158 channels), or from the script of video titles for Korean, Japanese and Thai channels without a country (54). Countries with several time zones use the main one: Eastern for the US and Canada, Sydney for Australia, Sao Paulo for Brazil, Moscow for Russia, Jakarta for Indonesia. A US channel in Los Angeles is off by three hours. Daylight saving is applied. YouTube shows upload times to the second.
- Round-the-clock channels: we dropped 545 channels that put more than a third of their uploads between 1 and 6 AM local time. For many of these, the local clock is probably wrong.
- Views at a fixed age: our crawler reads each video at a different age, from 3 days to 16 months (median 64 days). We estimated how views grow with age within each channel, in 14 age bins, and adjusted every reading to the same age. A check that uses only readings taken 14 to 60 days after upload (54,816 videos) gives the same order: Saturday +5.1%, Sunday +4.0%, Thursday -4.3%.
- Measure: for each video, the log of age-adjusted views minus the channel's average. We report each group's average as a percentage over or under the channel's average video. A version that caps extreme videos at about 7 times above or below the channel's average shows the same weekday order and a weekend lead of 6.9% over Wednesday.
- View curve: 2,726 videos with a reading in the first 28 days and a last reading 28 to 75 days after upload. This set includes company channels. Each age bin holds different videos, so the curve is a cross-section, not one video tracked over time.
- Choice: channels choose when to upload, and they may put their best ideas on certain days, as Jack does on Sundays. This is an observational study. It shows what videos on each day got, not what moving one video would do.
- Precision: with 173,516 videos, the standard error of each common window is 0.6 to 1 percentage point, and of the weekend-to-midweek gap 0.7 points. Single cells in the heatmap and countries or categories with under 200 channels move more by chance.
Download the data
The aggregate tables behind every chart are in one CSV: best-time-to-post-on-youtube-2026.csv. It has the result for each local hour, 3-hour window and weekday, the weekday-by-hour grid for each region, each country, tier and category by window and day, the spacing, frequency, usual-window and length tables, and the view curve. Every row has video counts, channel counts, the views lift, the same-month check and the pooled figure. Please cite "Virev, October 2026" and link this page.
Sources
- Best Time to Post on YouTube: Data from 1.8M Videos
- When is the Best Time to Post on YouTube?
- Best Time to Post on YouTube in 2026 (301K Videos Analyzed)
- Best Time to Post on YouTube and Shorts (2026)
- There's 197 Countries, Can I Name Them All?
- Doctor Reacts To "Strange Addictions"
- Should You Be Scared Of A Black Hole? | Dr. Becky Smethurst