



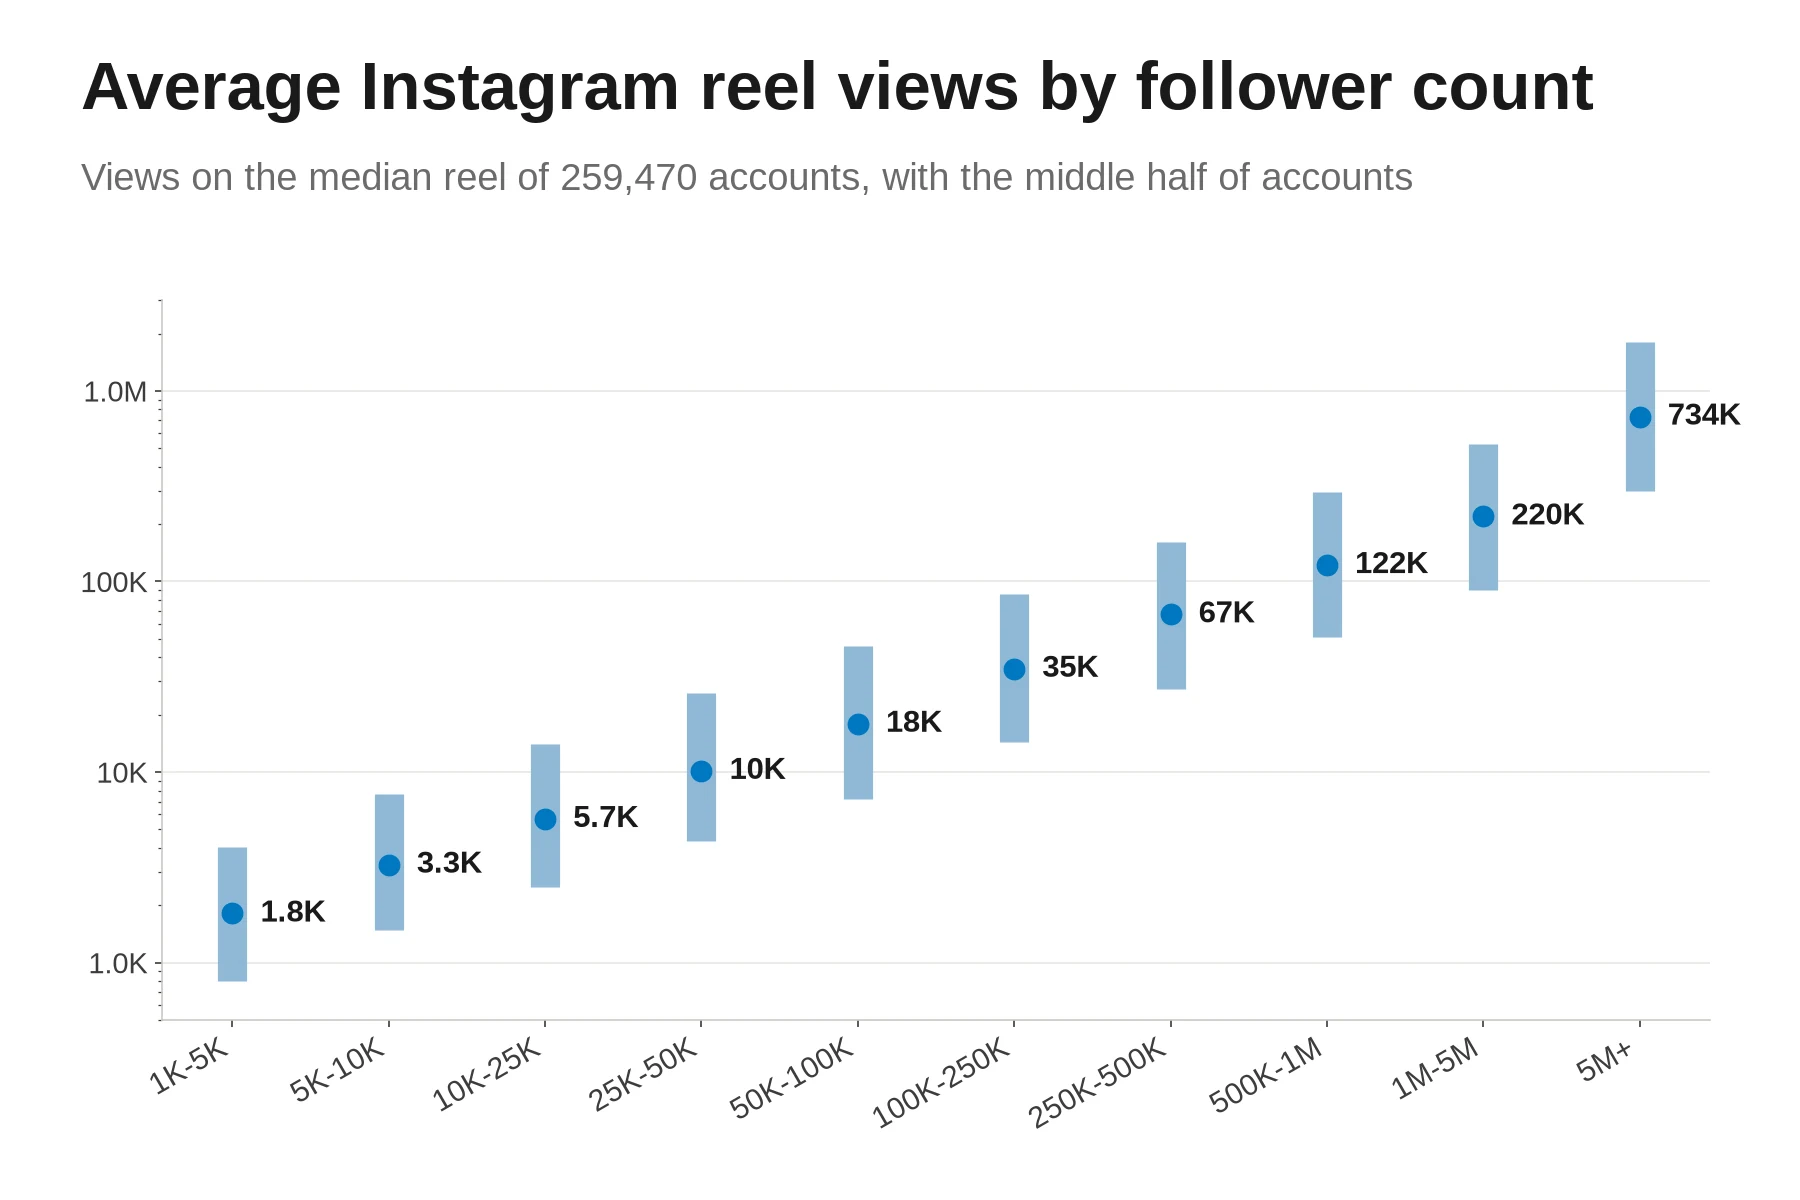
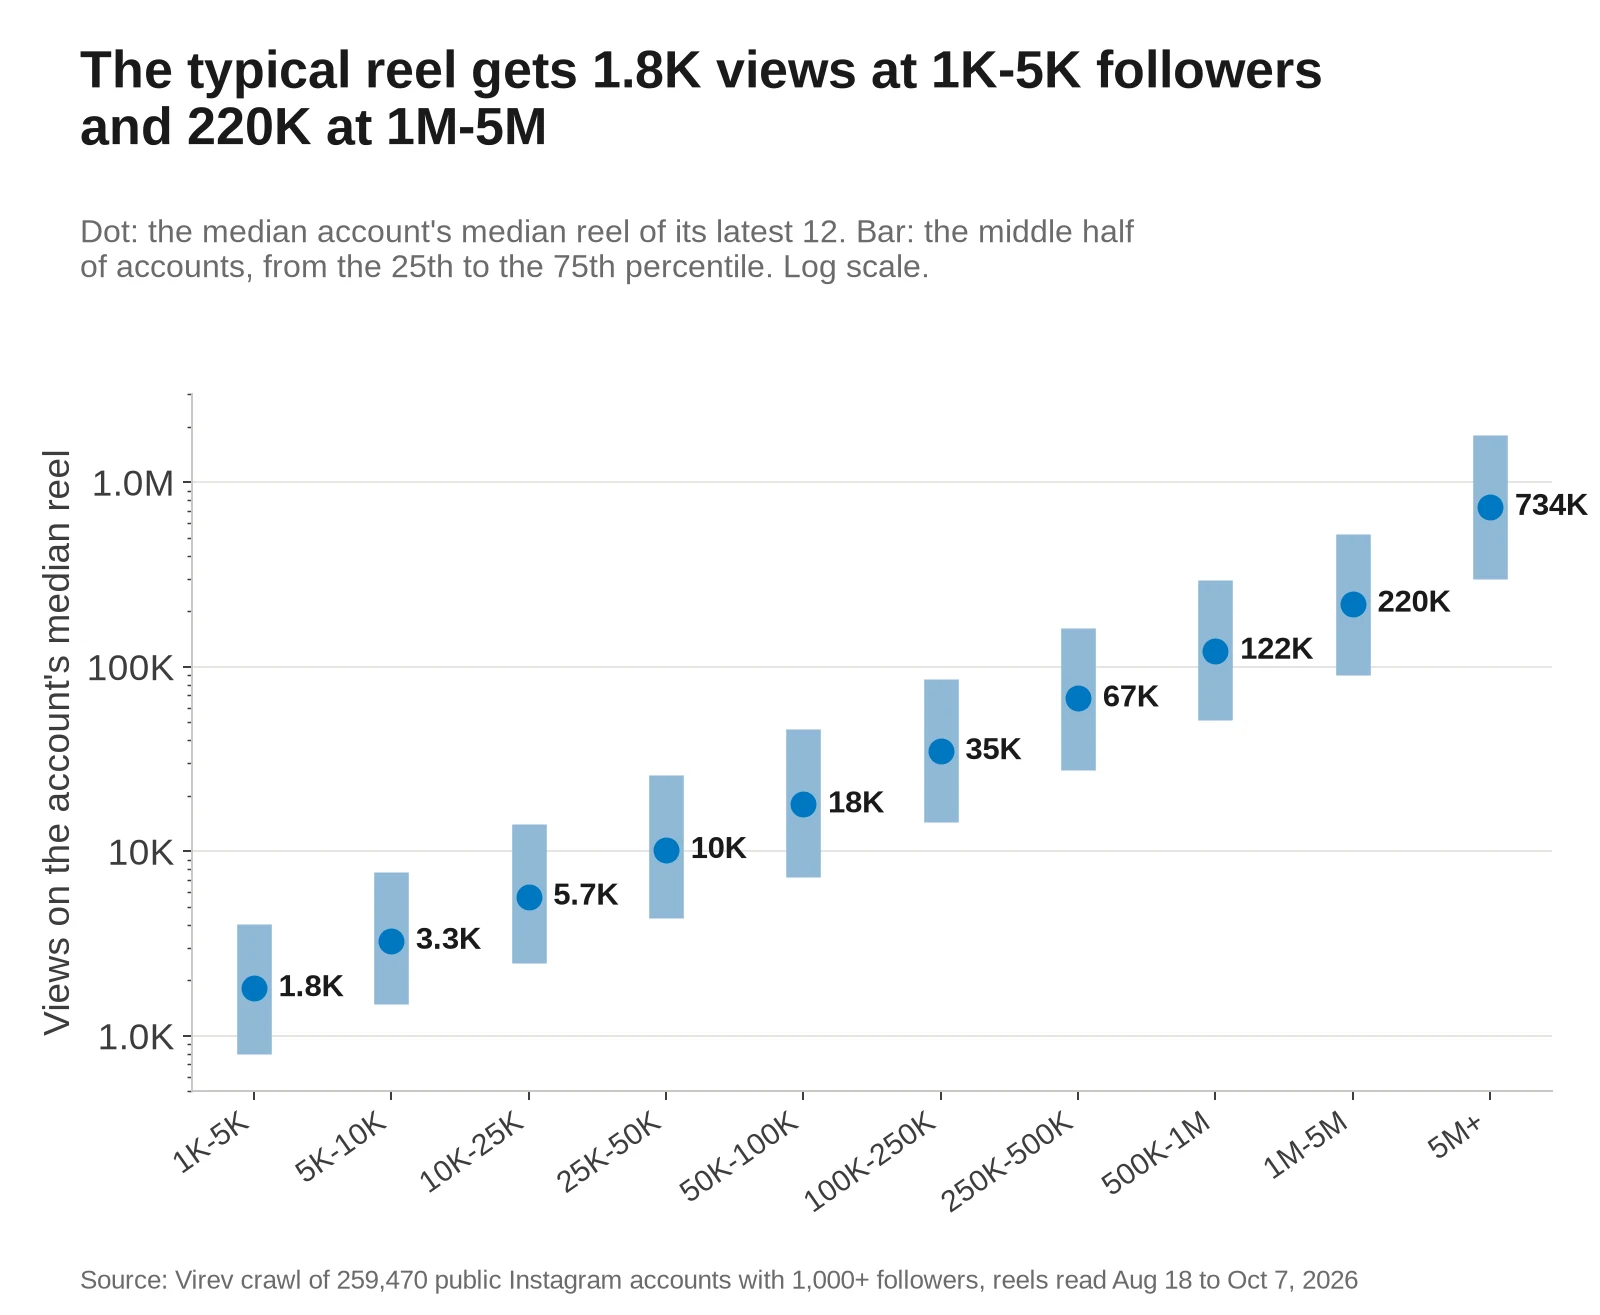
The typical Instagram account with 1,000 or more followers gets 9,479 views on its median reel. We measured up to the 12 latest reels of each of 259,470 public accounts, read by Virev's crawler between August 18 and October 7, 2026. Normal reel views depend on account size: 1,811 for an account with 1,000 to 5,000 followers, 17,937 at 50,000 to 100,000, and 219,733 at 1 million to 5 million.
The view count on a reel is the number Instagram shows on the account's Reels tab. Instagram renamed it from plays to views in August 2024, and it counts replays. One person can add several views, and many views come from people who do not follow the account, so views divided by followers overstates the share of followers who saw the reel.
The pages that rank for "average reel views" are calculators from creator tools (Sup, Modash, HypeAuditor) and stat lists. They print ranges per follower tier with no sample size, or measure a few hundred reels, or report a mean of all reels that one viral account can move. This study adds ten follower bands from 259,470 accounts, the share of reels that get fewer views than the account has followers, the gap between average and median inside each account, how views grow with age, cuts by Instagram category and country, and a band-by-band comparison with TikTok. It names seven accounts, each read again on October 27, 2026. The calculator below places any account against the bands.
9,479
Typical account
34%
Views per follower
86%
Under followers
Instagram average reel views calculator
Type the views of your latest reels, or of the creator you are checking, and the follower count. Use reels at least a week old and skip pinned ones. Nothing leaves this page.
The median, the average and where they sit for accounts of the same size appear here.
Average reel views on Instagram by follower count
For each account we took the median of its latest 12 reels, the view count in the middle when you sort them. Then we read the 25th percentile, the median and the 75th percentile of those account medians in each follower band.
| Followers | Accounts | Median reel, 25th pct | Median | 75th pct | Average, median account | Median views per follower |
|---|---|---|---|---|---|---|
| All | 259,470 | 2,715 | 9,479 | 42,057 | 19,165 | 33.8% |
| 1K-5K | 51,188 | 799 | 1,811 | 4,037 | 2,952 | 74.5% |
| 5K-10K | 28,764 | 1,481 | 3,269 | 7,694 | 5,819 | 46.1% |
| 10K-25K | 43,803 | 2,493 | 5,675 | 14,002 | 10,826 | 35.7% |
| 25K-50K | 33,208 | 4,326 | 10,150 | 25,927 | 19,595 | 28.9% |
| 50K-100K | 31,353 | 7,242 | 17,937 | 46,068 | 34,369 | 25.9% |
| 100K-250K | 29,577 | 14,327 | 34,846 | 85,723 | 64,489 | 22.5% |
| 250K-500K | 15,995 | 27,393 | 67,285 | 162,105 | 118,099 | 19.3% |
| 500K-1M | 13,042 | 51,276 | 122,079 | 294,356 | 203,980 | 17.3% |
| 1M-5M | 11,042 | 90,329 | 219,733 | 524,233 | 353,431 | 13.2% |
| 5M+ | 1,498 | 298,912 | 734,121 | 1,798,011 | 1,153,189 | 6.9% |
- A median reel under the 25th percentile puts an account in the bottom quarter of its band. At 10,000 to 25,000 followers that line is 2,493 views.
- A median reel above the 75th percentile puts it in the top quarter. At 100,000 to 250,000 followers that line is 85,723 views.
- The bands overlap. A top-quarter account with 25,000 to 50,000 followers (25,927 views) gets more views than a bottom-quarter account with 100,000 to 250,000 (14,327).
- The "Average" column is the mean of the account's latest reels, which is what most calculators report. In each band it is 1.57 to 1.93 times the median reel column, so compare an average only with other averages.
What percent of your followers see a reel
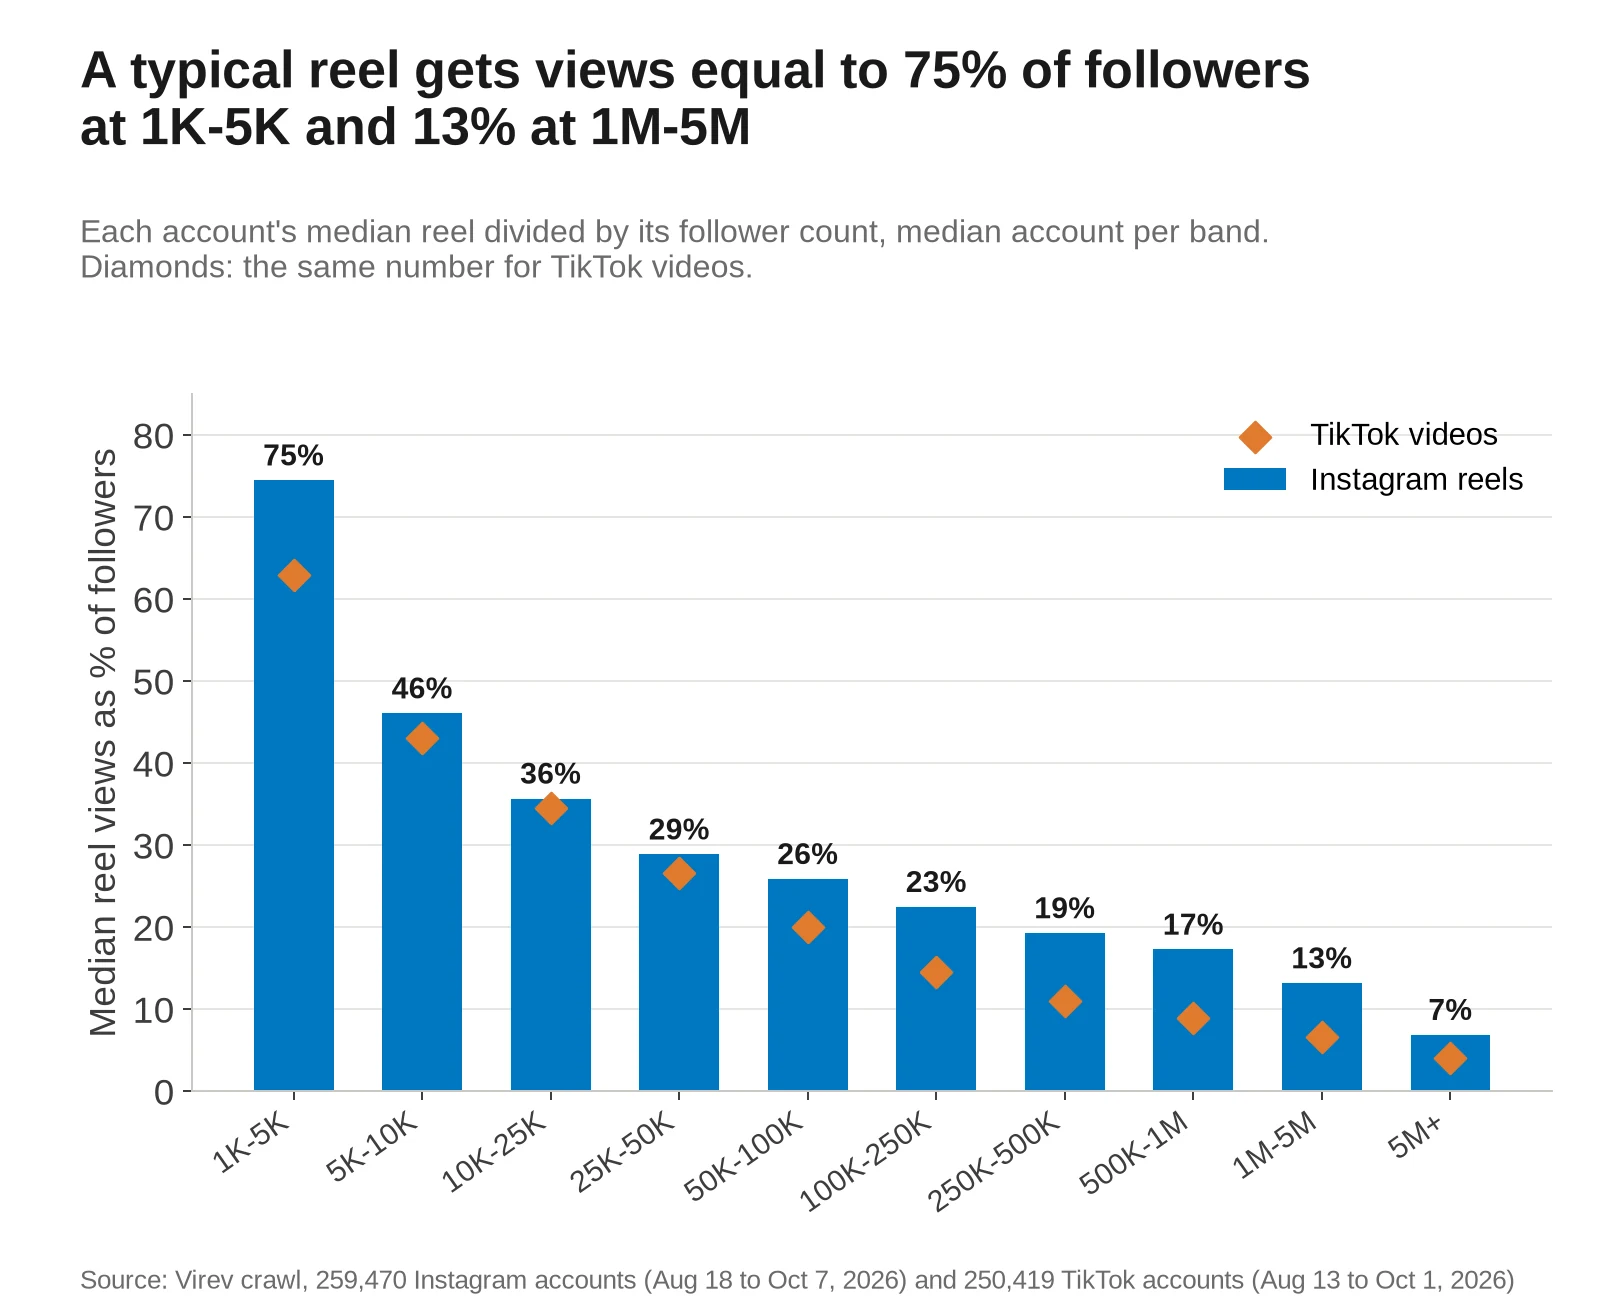
Views divided by followers answers "how many views is good for my follower count". We divided each account's median reel by its follower count.
| Followers | Views per follower, 25th pct | Median | 75th pct | Median reel beats followers | Reels under followers, median account | All reels under followers |
|---|---|---|---|---|---|---|
| All | 13.7% | 33.8% | 86.3% | 21.8% | 85.7% | 35.7% |
| 1K-5K | 33.4% | 74.5% | 170.1% | 40.5% | 66.7% | 19.8% |
| 5K-10K | 21.1% | 46.1% | 107.9% | 27.0% | 83.3% | 29.3% |
| 10K-25K | 15.8% | 35.7% | 87.3% | 22.1% | 83.3% | 33.0% |
| 25K-50K | 12.3% | 28.9% | 72.7% | 18.7% | 90.0% | 36.7% |
| 50K-100K | 10.4% | 25.9% | 64.7% | 16.5% | 91.7% | 38.9% |
| 100K-250K | 9.4% | 22.5% | 54.2% | 12.6% | 91.7% | 42.3% |
| 250K-500K | 7.9% | 19.3% | 46.1% | 10.4% | 91.7% | 47.9% |
| 500K-1M | 7.3% | 17.3% | 41.4% | 8.4% | 100.0% | 53.2% |
| 1M-5M | 5.4% | 13.2% | 31.1% | 5.5% | 100.0% | 63.8% |
| 5M+ | 3.2% | 6.9% | 16.8% | 2.1% | 100.0% | 80.0% |
- The median account with 1,000 to 5,000 followers gets views equal to 74.5% of its followers on a typical reel. Above 5 million followers it gets 6.9%.
- A median reel with more views than followers is common for small accounts and rare for large ones. 40.5% of accounts with 1,000 to 5,000 followers have one, against 2.1% of accounts above 5 million.
- The median account got fewer views than it had followers on 85.7% of its reels. Above 500,000 followers it was all of them.
- About one account in three, 35.7%, had no reel in the sample that reached its follower count. Above 5 million followers it was 80.0%.
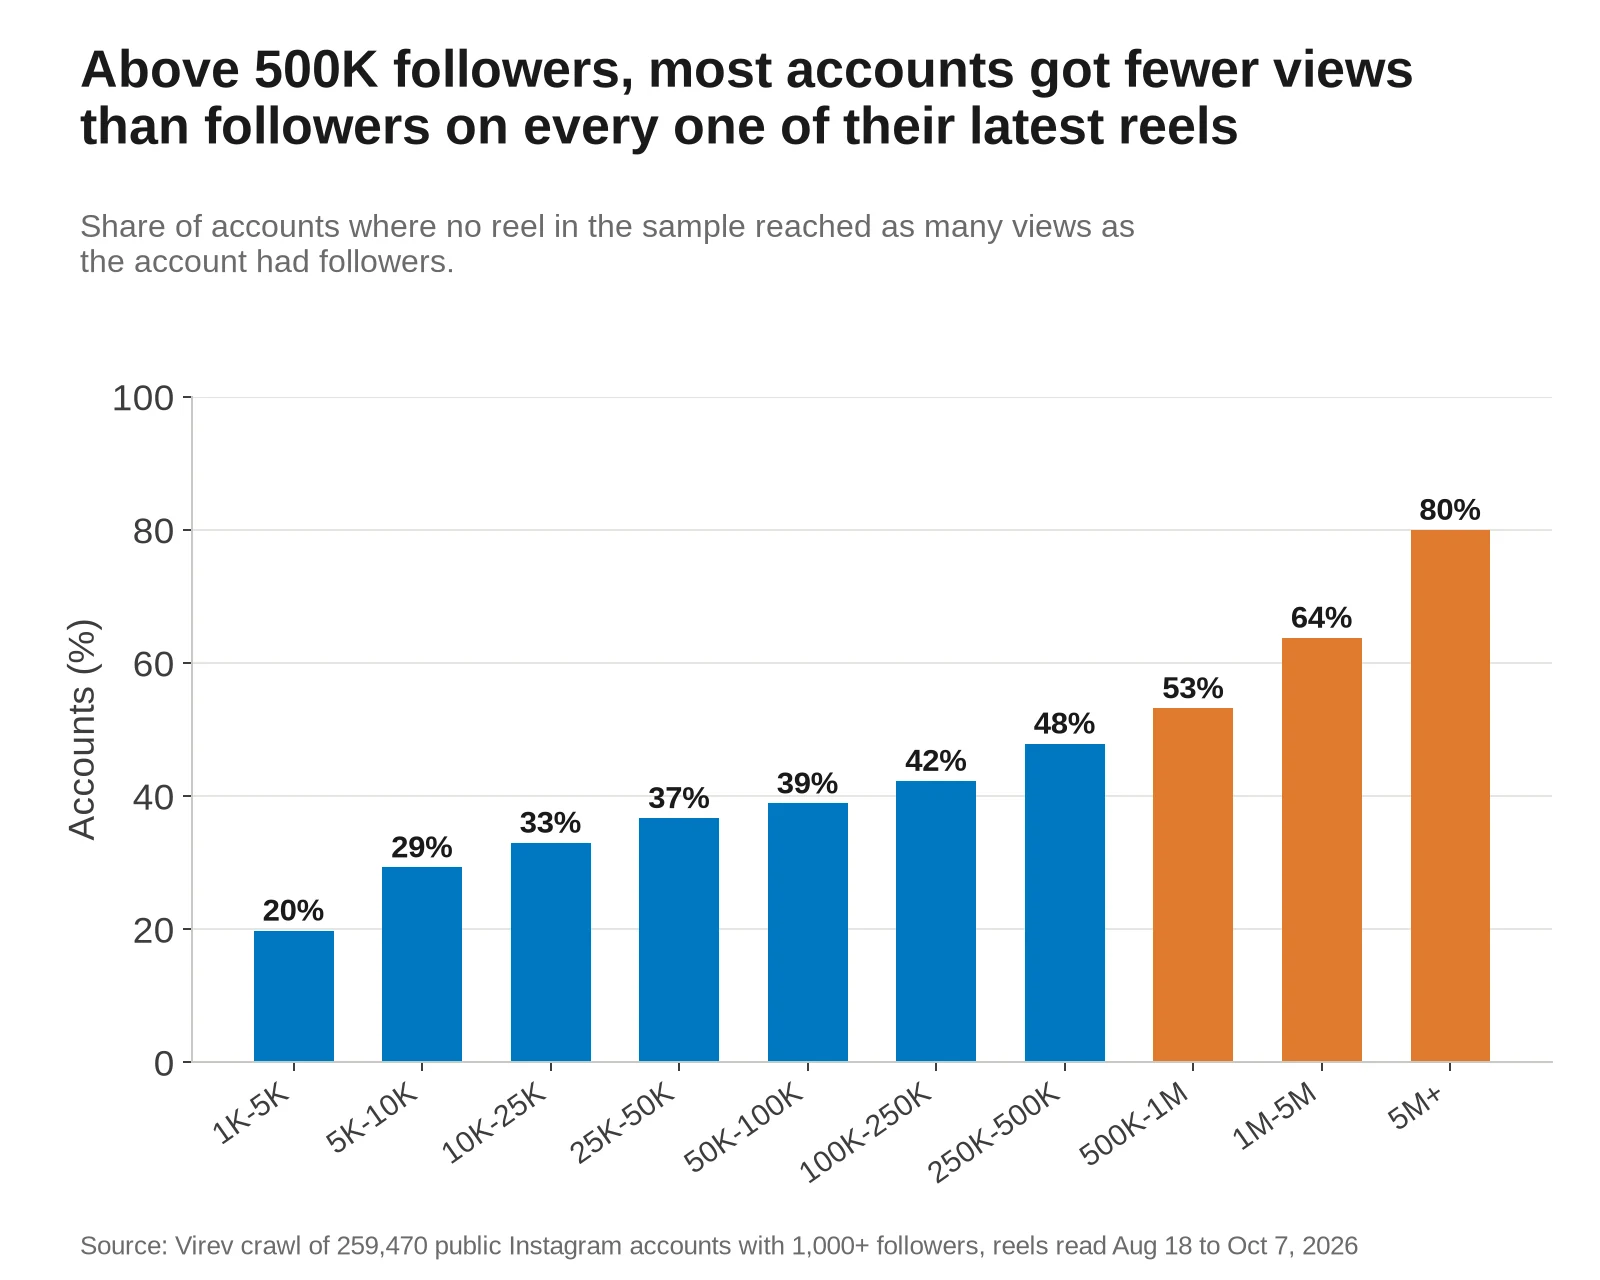
These ratios are an upper bound on the share of followers who saw a reel. Instagram counts every play and replay as a view, and much of a reel's audience comes from the Reels feed and Explore, where viewers do not follow the account. Only the account owner sees how many accounts were reached and how many of them follow. The often quoted "3.5% of followers see a post" is a different number: social.plus cites it from Socialinsider's 2025 data for brand business accounts, across all post formats. For engagement per follower and likes per view by follower tier, see our Instagram engagement rate benchmarks.
Average story views on Instagram
Stories show their view count only to the account owner, so no public crawl can measure them, and this study has no story numbers. What a brand can check from outside is the reel side: a creator's reel views per follower, set against the band table above. For a story figure, ask the creator for a screenshot of story insights, which shows views and accounts reached for each story.
The story benchmarks that rank come from business accounts that connect their analytics to a tool. HKWeb quotes an average story view rate of 4.42% of followers, falling from 8.18% under 10,000 followers to 1.47% above 1 million, and credits Hootsuite and Socialinsider without a link to the study. We could not check these numbers.
Why the average sits above the median
In most Instagram accounts, one or two reels get more views than the rest. In the median account, the most-viewed of its latest reels held 29.0% of all their views and got 4.6 times the account's median. That reel pulls the average up and leaves the median where it was.
| Followers | Average over median, median account | Average over 2x median | Top reel's share of views | Held-out reel beats median | Held-out reel beats average | Held-out reel under half the average |
|---|---|---|---|---|---|---|
| All | 1.47x | 30.1% | 29.0% | 49.9% | 31.5% | 38.6% |
| 1K-5K | 1.40x | 27.7% | 28.0% | 49.8% | 32.2% | 36.7% |
| 5K-10K | 1.46x | 30.7% | 28.9% | 49.8% | 31.4% | 38.5% |
| 10K-25K | 1.50x | 32.9% | 29.6% | 49.9% | 31.0% | 39.9% |
| 25K-50K | 1.52x | 33.1% | 29.8% | 49.9% | 30.8% | 40.1% |
| 50K-100K | 1.52x | 32.2% | 29.7% | 49.9% | 30.9% | 40.0% |
| 100K-250K | 1.51x | 31.2% | 29.7% | 49.9% | 31.1% | 39.9% |
| 250K-500K | 1.48x | 28.1% | 28.9% | 49.9% | 31.6% | 38.5% |
| 500K-1M | 1.43x | 24.3% | 27.8% | 49.9% | 32.4% | 36.4% |
| 1M-5M | 1.39x | 22.1% | 27.1% | 49.9% | 32.9% | 35.4% |
| 5M+ | 1.35x | 21.0% | 26.3% | 49.9% | 33.7% | 33.4% |
To test which number predicts a reel, we held out each reel in turn and compared it with the median and the average of the same account's other reels. Each account counts once.
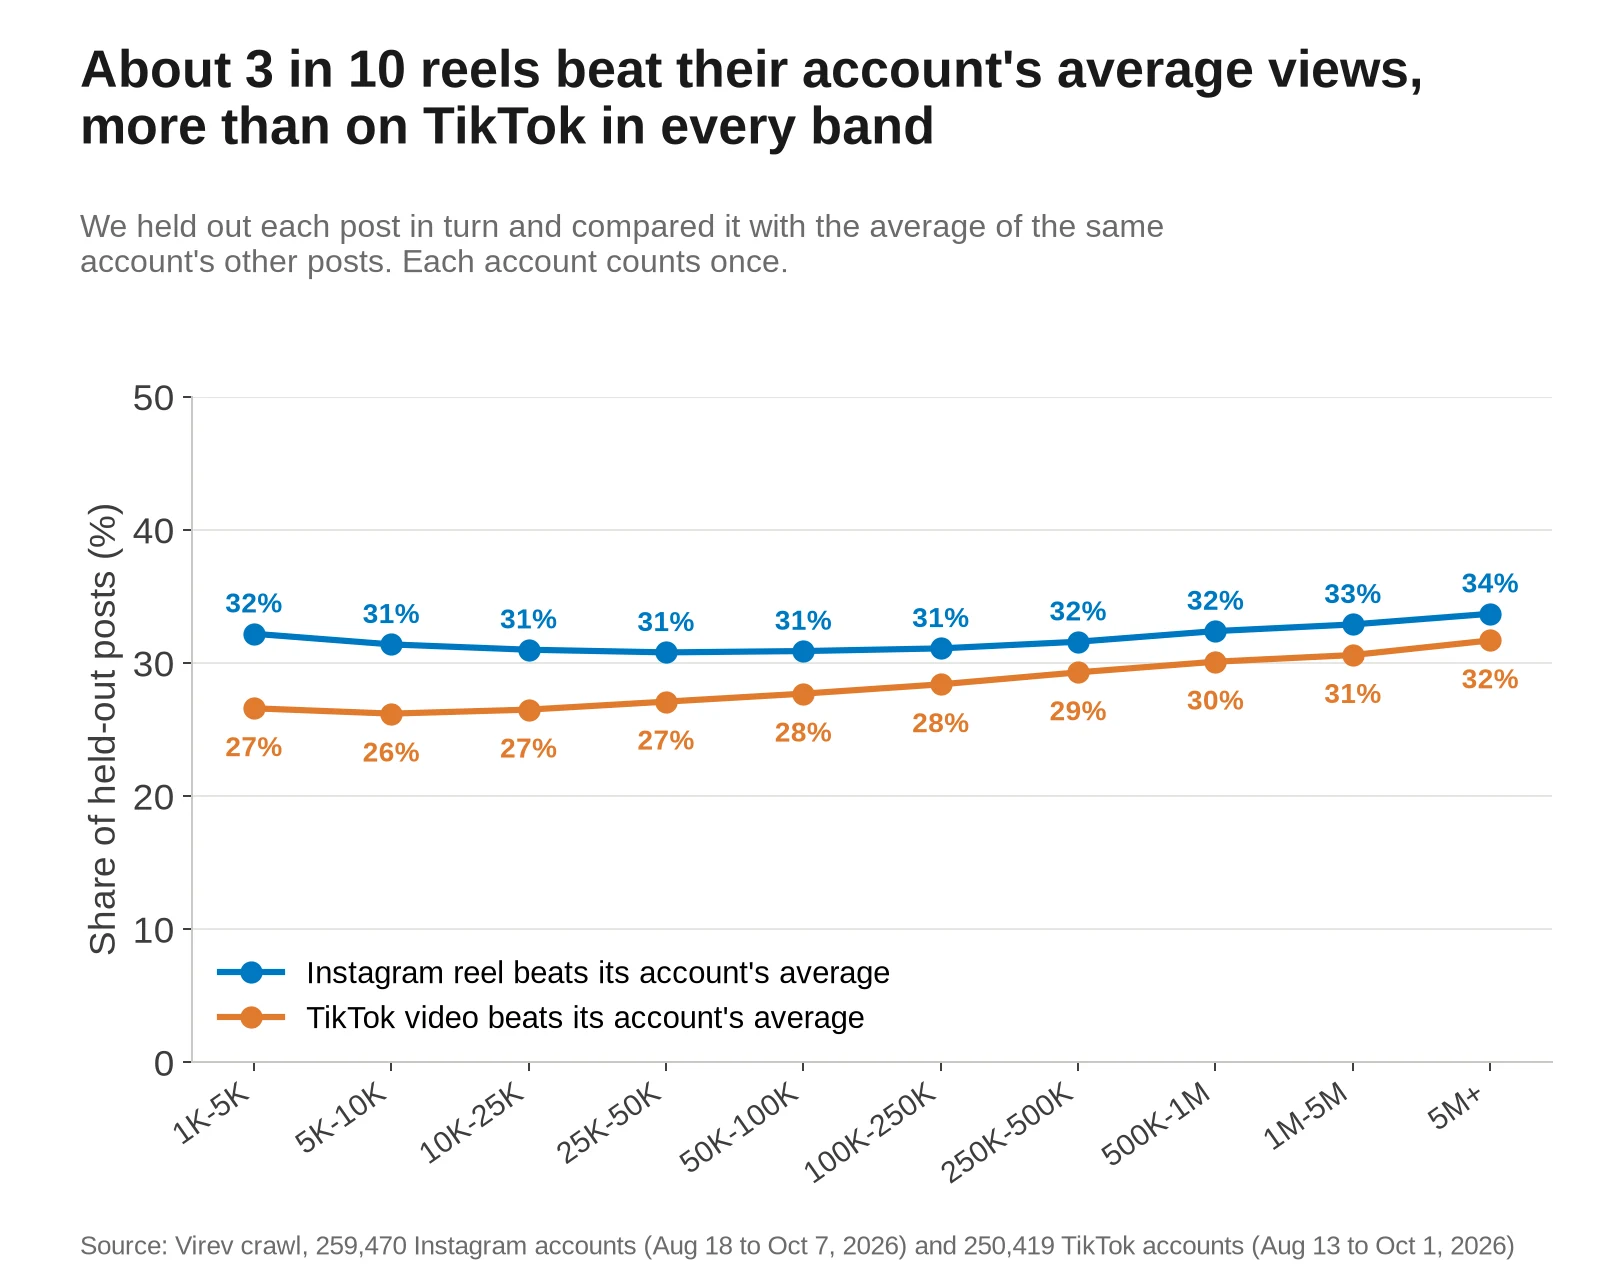
- A held-out reel beat the median of the account's other reels 49.9% of the time, as a middle value should.
- It beat their average 31.5% of the time. So about 7 in 10 reels fall short of their own account's average views.
- 38.6% of held-out reels got less than half of the account's average. Against the median, 17.0% did.
- Reel views are steadier than TikTok views. The typical Instagram account's average is 1.47 times its median, against 2.03 times on TikTok, and its top reel holds 29.0% of its views, against 36.1% for the top TikTok video.
If you price a sponsored reel on a creator's average views, expect most reels to come in under it. A brand that plans on the median gets a number that half of reels beat.
Claire's 12 reels at our read
Claire Grand-Clement (@danslacuisinedeclaire) posts recipes and food from Bordeaux. She had 88,192 followers when we read the account. Eleven of her latest 12 reels got between 13,178 and 272,505 views. The twelfth, posted July 31, 2026, had 39,610,508.
- Her median reel was 23,816 views, 1.3 times the median for her band and at about its 58th percentile, and her average was 3,367,679, which is 141 times the median.
- An average views calculator would have told a brand to expect 3.4 million views a reel. The reel she posted next, on August 13, got 151,871, and the two after it got 16,904 and 19,953.
- On October 27, 2026, the July 31 reel showed 82.1 million views on her Reels tab, and another reel of hers showed 56.4 million. Her latest 12 reels had a median of 20,000 views. Both hits sit far above her usual views, and the median stayed near 20,000 through both.
Click "Try @danslacuisinedeclaire at our read" in the calculator above to see the same numbers.
Instagram reels against TikTok videos
Our average TikTok views study used the same method on 250,419 TikTok accounts with 1,000+ followers, read from August 13 to October 1, 2026: the same ten bands, the median of up to 12 latest posts 3 to 180 days old, and at least 6 posts per account.
| Followers | Reels, median | TikTok, median | Reels over TikTok | Reels, views per follower | TikTok, views per follower | Reels, average over median | TikTok, average over median |
|---|---|---|---|---|---|---|---|
| All | 9,479 | 8,007 | 1.18x | 33.8% | 27.2% | 1.47x | 2.03x |
| 1K-5K | 1,811 | 1,327 | 1.36x | 74.5% | 62.9% | 1.40x | 2.14x |
| 5K-10K | 3,269 | 3,044 | 1.07x | 46.1% | 43.1% | 1.46x | 2.36x |
| 10K-25K | 5,675 | 5,490 | 1.03x | 35.7% | 34.6% | 1.50x | 2.32x |
| 25K-50K | 10,150 | 9,452 | 1.07x | 28.9% | 26.6% | 1.52x | 2.19x |
| 50K-100K | 17,937 | 14,050 | 1.28x | 25.9% | 20.0% | 1.52x | 2.08x |
| 100K-250K | 34,846 | 23,200 | 1.50x | 22.5% | 14.6% | 1.51x | 1.96x |
| 250K-500K | 67,285 | 38,100 | 1.77x | 19.3% | 11.0% | 1.48x | 1.86x |
| 500K-1M | 122,079 | 61,200 | 1.99x | 17.3% | 8.9% | 1.43x | 1.78x |
| 1M-5M | 219,733 | 125,325 | 1.75x | 13.2% | 6.6% | 1.39x | 1.69x |
| 5M+ | 734,121 | 373,050 | 1.97x | 6.9% | 4.1% | 1.35x | 1.59x |
- Up to 50,000 followers, a typical reel and a typical TikTok get about the same views, within 7%, except in the smallest band, where reels get 1.36 times as many.
- From 100,000 followers up, the typical reel gets 1.5 to 2.0 times the views of the typical TikTok. At 500,000 to 1 million followers it is 122,079 against 61,200.
- TikTok views lean harder on one hit. In every band the TikTok account's average sits further above its median, and a held-out TikTok beat its account's average 27.6% of the time, against 31.5% for a reel.
- About a third of accounts on both apps got fewer views than followers on every post: 35.7% on Instagram and 33.3% on TikTok.
In all ten bands, reels got more views per follower than TikTok videos in our data. For where the viral bar sits on each app, see how many views is viral.
Views, likes and comments
A reel's views, likes and comments move together. The median account got 3.05 likes per 100 reel views, or one like for about 33 views, and that rate stays between 2.96 and 3.24 in every band. Comments are rarer and fall with size.
| Followers | Likes per 100 views | Comments per 100 views |
|---|---|---|
| All | 3.05 | 0.075 |
| 1K-5K | 3.17 | 0.099 |
| 5K-10K | 3.02 | 0.092 |
| 10K-25K | 2.97 | 0.086 |
| 25K-50K | 2.96 | 0.078 |
| 50K-100K | 2.97 | 0.072 |
| 100K-250K | 3.01 | 0.066 |
| 250K-500K | 3.10 | 0.060 |
| 500K-1M | 3.15 | 0.053 |
| 1M-5M | 3.16 | 0.046 |
| 5M+ | 3.24 | 0.038 |
- If a creator hides like counts, the views still show. A reel with 10,000 views usually carries about 300 likes.
- 3,997 accounts in the sample (1.5%) had a median reel with under one like per 200 views. The ones we looked at were mostly brand accounts, and a reel that runs as an ad can collect paid views on its public count. Without these accounts, the typical account's median reel is 9,280 views instead of 9,479.
- Comments per 100 views fall from 0.099 at 1,000 to 5,000 followers to 0.038 above 5 million, so big accounts get proportionally fewer comments even when likes keep up.
Our reels vs carousels vs photos study compares likes and comments across the three formats, and our Instagram algorithm study ranks what moves a reel's views inside one account.
Accounts far above and below their band
We picked accounts whose median reel sat far above or below the median of their follower band. On October 27, 2026 we opened each Reels tab in a browser and read the follower count and the views on the latest 12 reels, leaving out pinned ones.
| Account | Followers at our read | Median reel at our read | Band median | Followers on Oct 27 | Median reel on Oct 27 |
|---|---|---|---|---|---|
| Ashton Hall (@ashtonhall), fitness and routine | 18,893,783 | 41,912,110 | 734,121 | 18.4M | 9,350,000 |
| Virginia (@virginia), creator and founder | 56,485,495 | 26,430,679 | 734,121 | 56.8M | 46,000,000 |
| Reenu (@reenu_debnath), acting | 3,824,716 | 20,169,913 | 219,733 | 3.9M | 24,800,000 |
| Prakaash Bhardwaaj (@prakashbhardwaaj), host and producer | 1,886,794 | 2,290 | 219,733 | 1.8M | 67,100 |
| Claire Grand-Clement (@danslacuisinedeclaire), food | 88,192 | 23,816 | 17,937 | 89.5K | 20,000 |
| Uttam Nirwal (@uttam_inverse), digital creator | 2,213 | 368,402 | 1,811 | 2,325 | 14,150 |
| Dr Neha Das (@drnehalaldas), political commentary | 4,249 | 1,024,146 | 1,811 | 6,094 | 4,763 |
- Ashton Hall's median reel got 41.9 million views at our read, 2.2 times his follower count and 57 times the median for accounts above 5 million followers. On October 27 his latest 12 reels ranged from 2.7 million to 77.2 million, with a median of 9.35 million, still 13 times his band.
- Virginia, who has 56.8 million followers and whose bio links her beauty brand WePink, got a median of 26.4 million views at our read, 36 times her band. Even so, 11 of her 12 reels got fewer views than she had followers. On October 27 her latest 12 ran from 23.5 million to 89.7 million, with a median of 46 million.
- Reenu, an actor based in Mumbai, got a median of 20.2 million views on 3.8 million followers, 5.3 times her follower count, and none of her 12 reels fell under it. On October 27 her median was 24.8 million.
- Prakaash Bhardwaaj, a host and producer with 1.9 million followers, had a median of 2,290 views at our read, 0.12% of his followers, and all 12 reels sat between 1,200 and 3,061. On October 27 his eight newest reels had 41,900 to 121,000 views, and the median of his latest 12 was 67,100. A median from one stretch of reels can move 30 times in two months.
- Uttam Nirwal had 2,213 followers and a median of 368,402 views, 166 times his follower count, and all 12 reels passed it. On October 27 his latest 12 reels had 2,329 to 977,000 views, with a median of 14,150, still 6 times his followers.
- Dr Neha Das had 4,249 followers at our read. Six of her reels posted August 5 to 15 got 2.0 to 4.4 million views each, and six posted August 4 to 6 got 2,284 to 4,406. On October 27 her latest 12 had a median of 4,763 views on 6,094 followers, with one at 236,000.
A large follower count with a median in the low thousands, as Prakaash Bhardwaaj had in August, is a reason to look at more than 12 reels and to ask for the creator's insights before a booking. The public numbers do not say why views rose or fell, so we do not guess.
Views keep growing after posting
A view count keeps rising after the day a reel is posted. To see by how much, we compared each account's reels of one age with its own reels read 3 to 13 days after posting. Comparing inside one account keeps the account's size and topic the same.
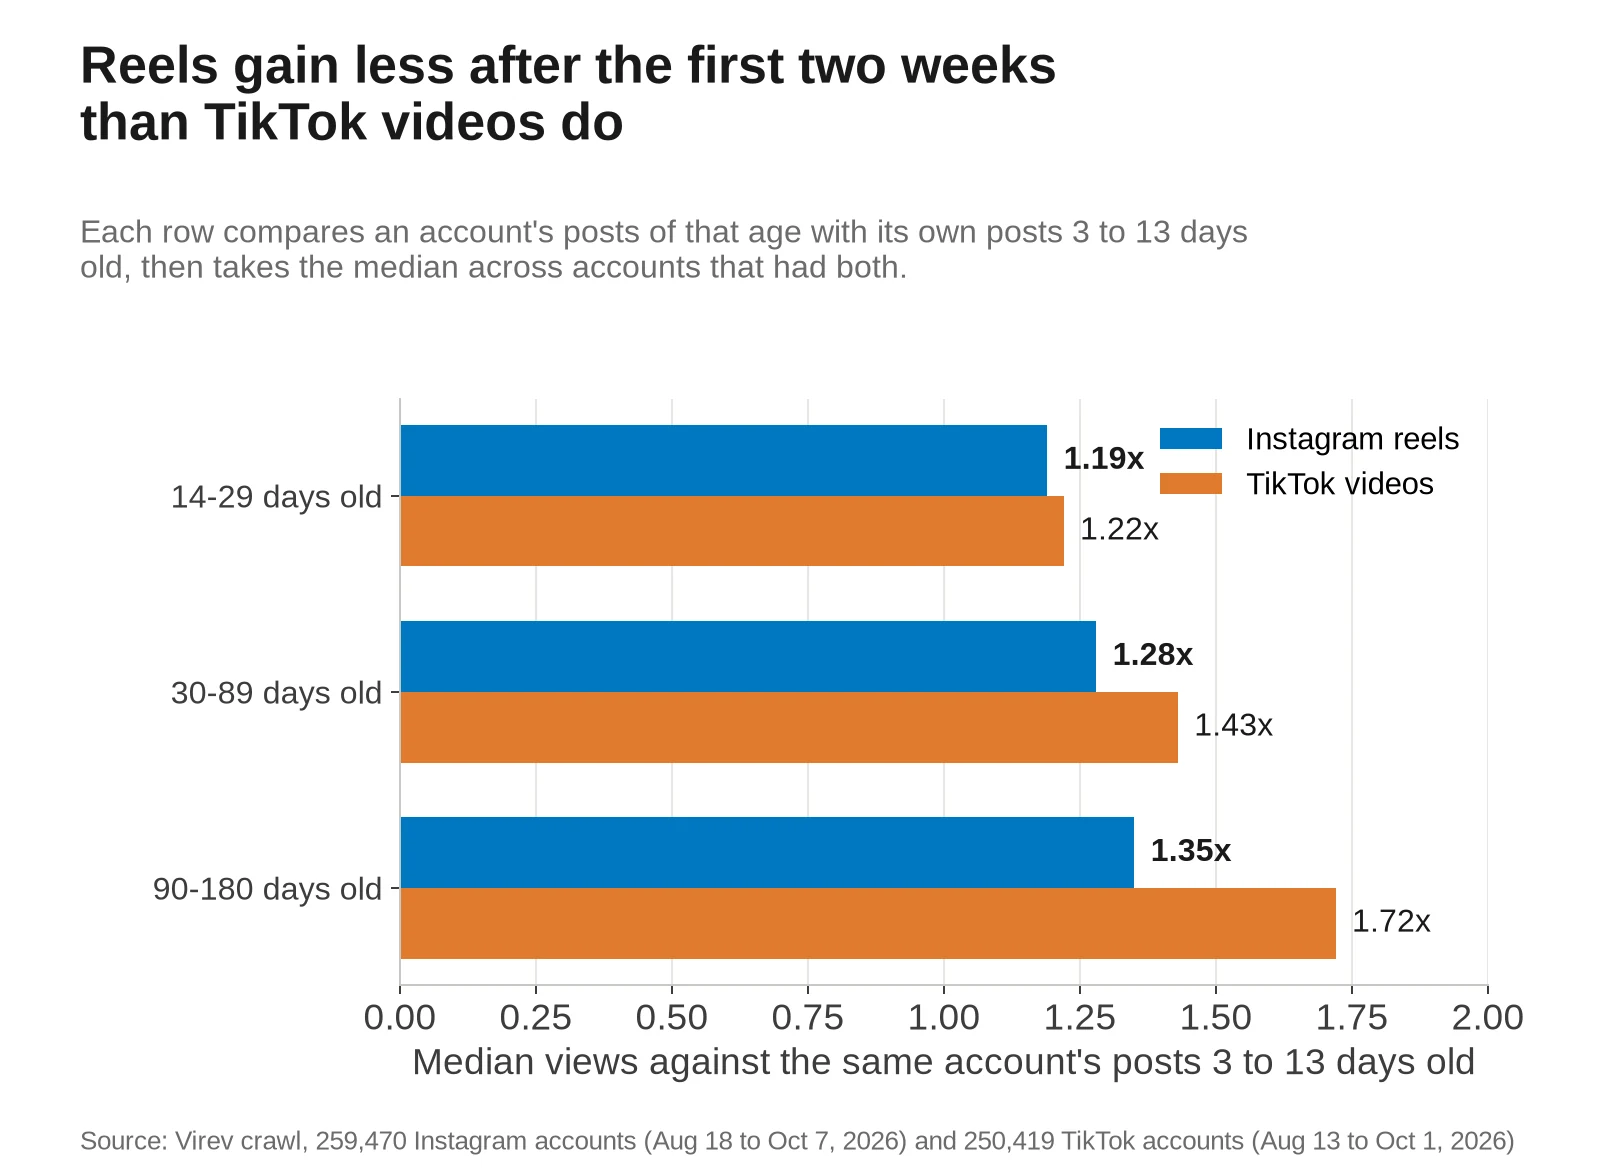
- A reel 30 to 89 days old had 1.28 times the views of the same account's reels 3 to 13 days old, and a reel 90 to 180 days old had 1.35 times.
- Reels gain less after the first two weeks than TikToks do. A TikTok 90 to 180 days old had 1.72 times the views of the same account's new videos.
- Across all accounts, the median reel 90 to 180 days old got fewer views (7,783) than the median reel 3 to 13 days old (11,507). Only accounts that post rarely still have such old reels among their latest 12, so compare reels inside one account.
- To compare two creators, use reels of about the same age, and leave out reels under a week old.
Views by Instagram category
Instagram lets a creator or business show a category on the profile, such as Digital creator or Athlete. 68,571 accounts in the sample show one. Those accounts get 1.24 times the median of all accounts in the same band, so we compare each category with category accounts of the same size, and give the median reel for accounts with 10,000 to 100,000 followers.
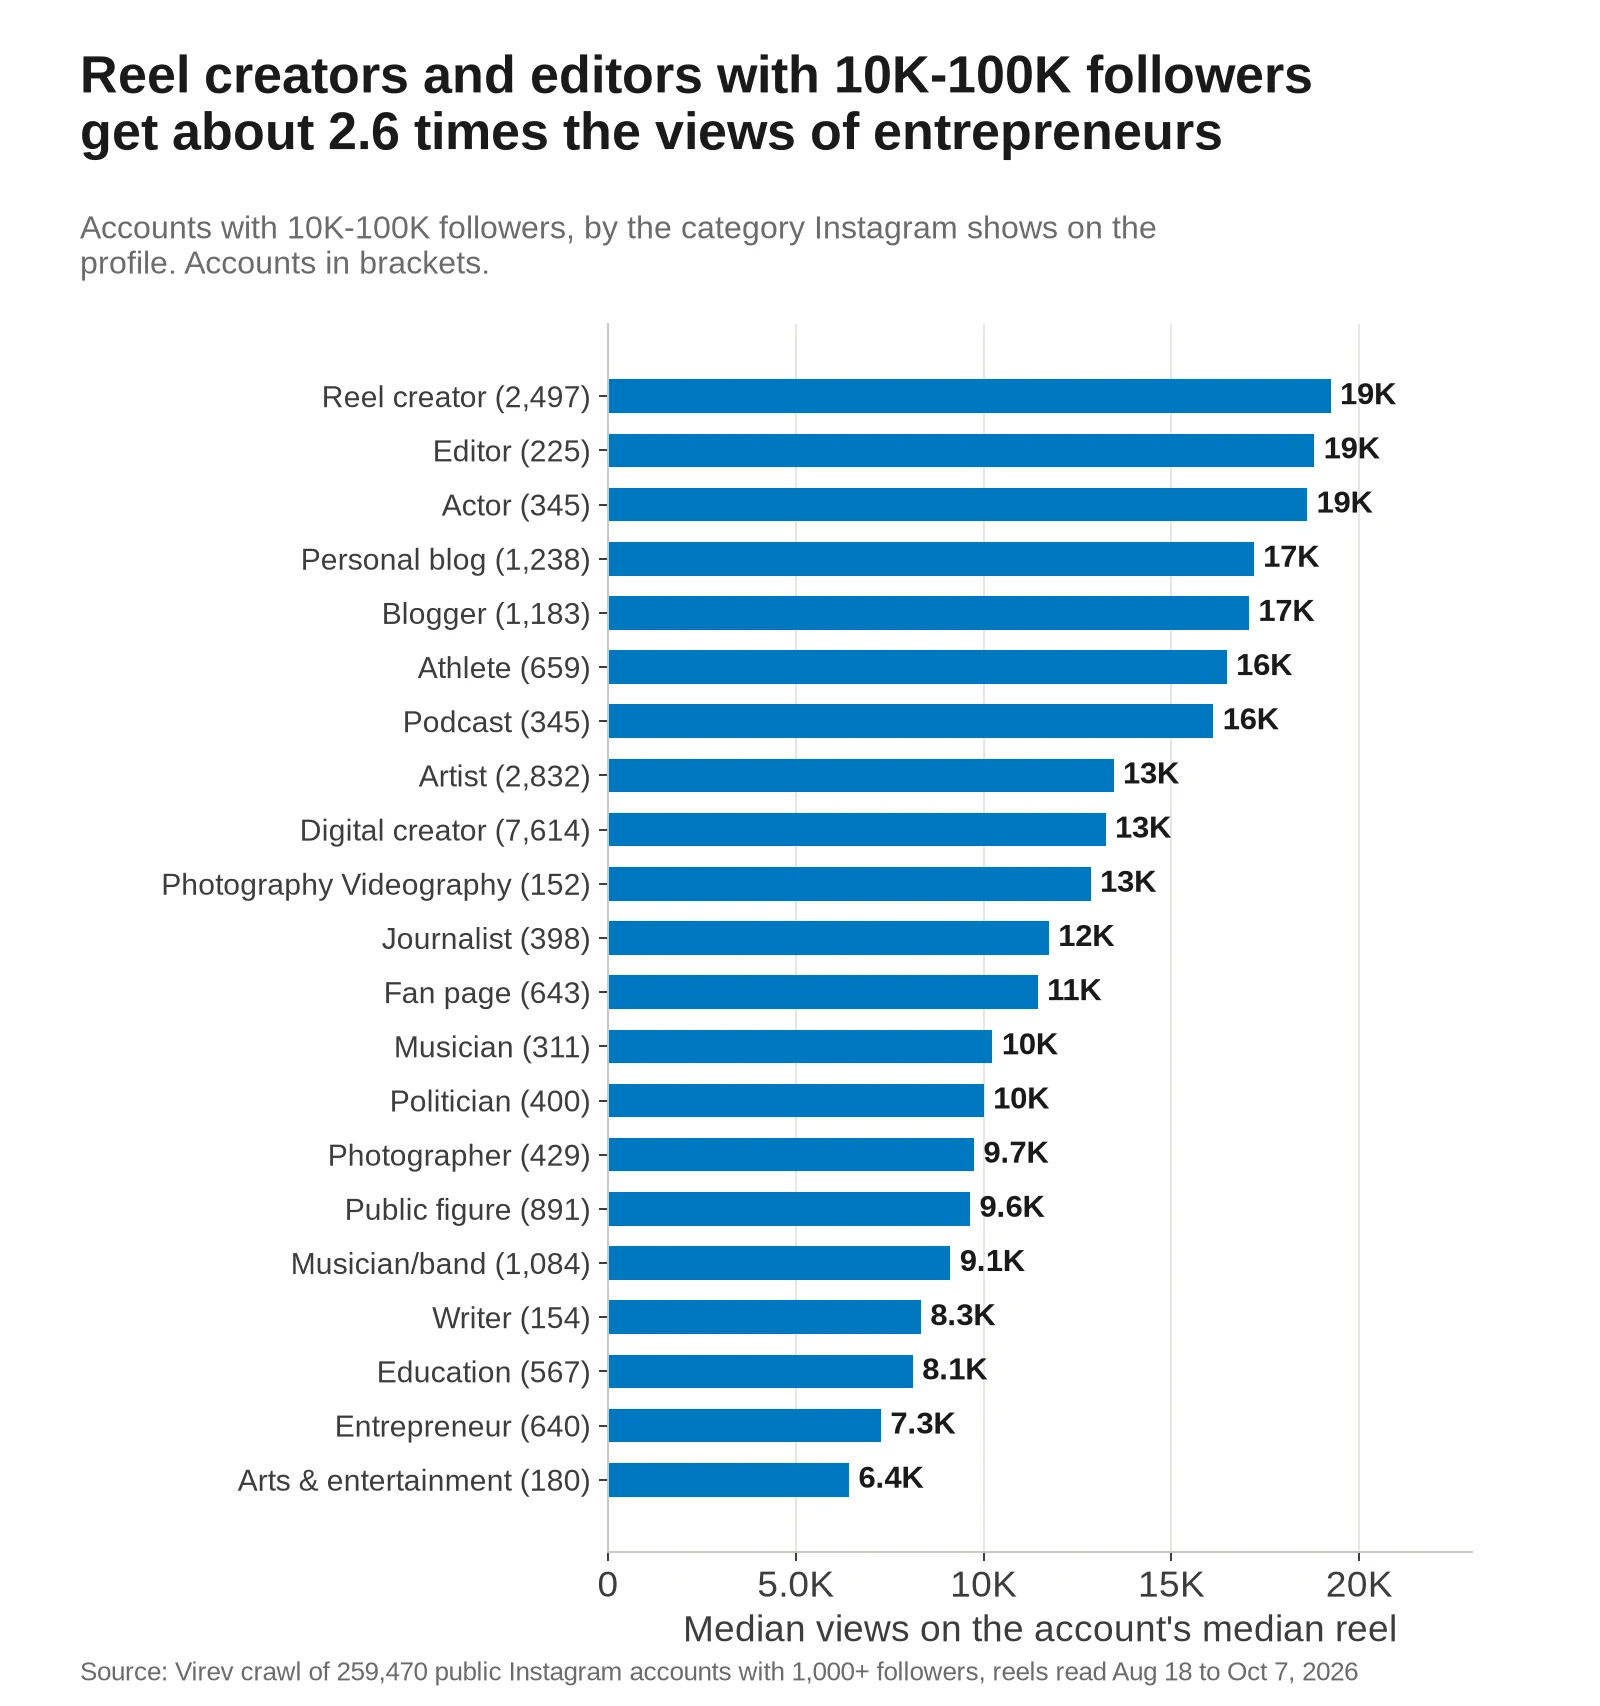
- Accounts labelled Reel creator with 10,000 to 100,000 followers had a median reel of 19,236 views, and Entrepreneur accounts 7,267, about 38% of that.
- Against category accounts of the same size, Editor accounts got 1.82 times the median, Reel creator and Blogger 1.43 times, and Entrepreneur 0.68 times.
- Fan page accounts got 6.24 likes per 100 views, about twice the rate of most categories, and Education accounts 2.51.
- The verified badge made no difference once size was taken out: verified accounts got 0.99 times their band median and unverified accounts 1.01 times. Verified accounts have lower views per follower (24.8% against 42.1%) only because they are larger.
Views by creator country
Virev's creator profile names the creator's country for 33,797 of the accounts. This is where the creator is based, and it says nothing about where the viewers are. Profiled accounts get 1.15 times the median of all accounts of the same size, so the table compares each country with profiled accounts of the same size. It shows every country with at least 400 profiled accounts.
| Creator country | Profiled accounts | Median reel at 10K-100K followers | Against profiled accounts of the same size | Median views per follower |
|---|---|---|---|---|
| Turkey | 543 | 24,167 | 2.21x | 78.7% |
| Iran | 478 | 15,153 | 1.82x | 65.7% |
| Germany | 558 | 23,115 | 1.65x | 60.8% |
| Italy | 469 | 18,858 | 1.56x | 53.3% |
| Spain | 411 | 17,861 | 1.54x | 51.9% |
| India | 5,864 | 16,978 | 1.53x | 67.1% |
| France | 541 | 17,445 | 1.51x | 58.4% |
| Indonesia | 881 | 10,776 | 1.15x | 45.0% |
| Argentina | 653 | 10,845 | 0.98x | 34.6% |
| Canada | 976 | 9,396 | 0.96x | 44.8% |
| Australia | 1,010 | 8,063 | 0.86x | 45.5% |
| United Kingdom | 1,422 | 8,092 | 0.83x | 36.0% |
| Mexico | 742 | 8,082 | 0.83x | 31.9% |
| Brazil | 4,395 | 8,204 | 0.75x | 29.0% |
| United States | 7,431 | 6,474 | 0.67x | 32.6% |
- Creators in Turkey got 2.21 times the median for their size, and the median Turkish account got views equal to 78.7% of its followers on a typical reel.
- Creators in India, the second-largest group, got 1.53 times the median for their size.
- Creators in the United States got 0.67 times the median for their size, and a US creator with 10,000 to 100,000 followers had a median reel of 6,474 views. Brazil was at 0.75 times.
Which view count you read matters
Instagram renamed Reels plays to views in August 2024 and said repeat views count, as replays did for plays. The number on the Reels tab and the views in a creator's insights both use that definition. Some public data carries a second count. The JSON that Instagram's web profile page loads gives each reel a field named video_view_count, and it reads well below the Reels tab.
We read both for four of @instagram's own reels, each posted at least 13 days before the first read. Virev's crawler read the JSON field on October 21, 2026, and we read the Reels tab on October 27. Likes on the same reels rose by 0.2% to 1.5% between those days, so growth explains little of the gap.
| Reel | video_view_count, Oct 21 | Reels tab, Oct 27 | Reels tab over field |
|---|---|---|---|
| Dd9RyBWBVih | 50,220,994 | 193M | 3.8x |
| Dd7CJkhPvHf | 29,779,247 | 108M | 3.6x |
| DePb6WLuVae | 24,916,921 | 101M | 4.1x |
| DeKPYgBhbUz | 11,525,173 | 70.1M | 6.1x |
Instagram does not document the field, and the gap changes from reel to reel, so it cannot be converted into views. Every number in this study uses Instagram's play count, the number on the Reels tab. We checked it on the Reels tabs of the seven named accounts. All 79 of their sampled reels that we found there showed our stored count or more, allowing for Instagram's rounding, and the 15 that were already 60 days old at our read showed a median of 1% more. Before you compare a tool's "average views" with this table, check which count it reads.
How to calculate average reel views
- Open the account's Reels tab and take its latest 12 reels that are at least 7 days old. Skip pinned reels, which Instagram shows first whatever their date.
- Write down the view count on each reel. Instagram rounds counts above 10,000, such as 45.3K.
- Sort the 12 counts. The median is the middle value, or the mean of the two middle values for an even count.
- The average is the sum divided by 12. Divide it by the median. Above 2, the average rests on one or two reels.
- Divide the median by the follower count to get views per follower, and compare both numbers with the band tables above.
Tools do not agree on which number they call average views. Sup averages the last 12 reels and shows the median beside it. Modash takes the mean of reels from the last 60 days. HypeAuditor removes outliers and takes the median of what is left. The calculator on this page reports both and places the median against 259,470 accounts. For one account's engagement rate and reel views per follower in one step, use the Instagram engagement rate calculator.
How these numbers compare with other benchmarks
- Sup's calculator page gives a median view rate of 112% of followers at 10,000 to 50,000 followers and 47% at 100,000 to 500,000, from 223 creators in its own directory. Our medians for those sizes are 29% to 36% and 19% to 23%.
- Modash's "Average" range is 663 to 3,000 views at 1,000 to 5,000 followers and 105,000 to 747,000 above 1 million. HypeAuditor's runs from 700 to 3,500 under 10,000 followers to 92,000 to 509,000 above 1 million. Neither page gives a sample size. Our medians for those sizes are 1,811 at 1,000 to 5,000 and 219,733 at 1 million to 5 million.
- Blogging Wizard relays Metricool's mean of 16,153 views per reel over more than 1.6 million reels, and 9,000 at 10,000 to 50,000 followers. That is a mean of all reels, which sits above our typical account (9,479) and far below our mean of all reels (148,105), because the means depend on which large accounts are in the sample.
- Socialinsider's 2026 benchmarks give mean reel views for brand business accounts of 580 at 1,000 to 5,000 followers and 2,460 at 10,000 to 50,000. We removed brand accounts, and our accounts got 1,811 and 5,675 to 10,150 at those sizes.
- Highviz measured 346 reels from 108 mostly small accounts and found a median of 344 views. Our sample starts at 1,000 followers.
Our own earlier studies used reels from the same crawl with fewer bands. The Instagram algorithm study put the median creator's reel at 64% of followers at 1,000 to 10,000 and 14% above 1 million, with reels up to a year old. With reels 3 to 180 days old and ten bands, this study finds 74.5% and 46.1% for the two halves of that first band, and 13.2% and 6.9% above 1 million.
What to do with this
For creators
- Track the median of your last 12 reels. One hit can raise your average many times over and tells you little about the next reel.
- Compare your median with the band table. A median above the 75th percentile for your follower count is a top-quarter account.
- Expect most reels to get fewer views than you have followers once you pass 25,000 followers. That is the normal case.
- Wait a week before you judge a reel, and compare it with your own reels of the same age.
- For when a reel counts as a breakout, see how many views is viral. For length, see how long a reel should be.
For brands
- Plan a sponsored reel on the creator's median, and treat the average as an upper bound. About 7 in 10 reels miss the average.
- If a creator's average is more than 2 times the median, ask which reel carries it and when it was posted. 30.1% of accounts have that shape.
- Check likes per 100 views. About 3 is normal, and a rate far below 1 points to reels run as ads.
- A large account with a median in the low thousands needs the creator's own insights before a booking.
- Search Instagram creators with 10,000 to 100,000 followers in Virev. Virev creator search covers 180M+ creators and shows each one's recent posts, so you can check a shortlist's views before you contact anyone.
Questions about average Instagram reel views
What are average reel views on Instagram?
The typical Instagram account with 1,000 or more followers gets 9,479 views on its median reel, in Virev's 2026 study of 259,470 accounts. Its average over the latest 12 reels is 1.47 times the median. Across all 2,839,920 reels the mean is 148,105, pulled up by viral reels, and the median reel got 10,302.
What is a good views to followers ratio on Instagram?
The median account's typical reel gets views equal to 34% of its followers. The share falls with size, from 74.5% at 1,000 to 5,000 followers to 25.9% at 50,000 to 100,000 and 13.2% at 1 million to 5 million. A ratio above the 75th percentile in the second table is a top-quarter account.
What are average reel views for 10K followers?
For accounts with 10,000 to 25,000 followers, the median reel of the median account got 5,675 views. The middle half of those accounts ran from 2,493 to 14,002, and the average of the latest reels for the median account was 10,826.
What percent of Instagram followers see your post?
Instagram shows reach only to the account owner. From outside, a reel's views divided by followers gives an upper bound: 34% for the typical account, 74.5% at 1,000 to 5,000 followers and 6.9% above 5 million. Views include replays and viewers who do not follow the account, so the share of followers who saw the reel is lower.
Is there a free Instagram average views calculator?
The calculator on this page runs in your browser, with no sign-up, and nothing you type leaves the page. Type the view counts of the latest reels and the follower count, and it shows the median, the average and where the median sits among accounts of the same size.
How we measured, and what can be wrong
- The sample is every public Instagram account with 1,000 or more followers in the export behind our Instagram algorithm study that had at least 6 reels 3 to 180 days old at the read. Virev's crawler read the reels between August 18 and October 7, 2026. That is 259,470 accounts.
- View counts come from an export on October 3, 2026 and the age at the read from one on October 7, so a reel read again between those days has its age a little overstated.
- For each account we kept up to the 12 latest reels posted 3 to 180 days before the read. Reels were posted February 19 to September 29, 2026. That is 2,839,920 reels.
- We removed accounts that Virev's profile model labels as brands, businesses, media, organizations or government, and accounts with no profile whose Instagram category names a business, such as a shop, restaurant or media outlet. Some brands with neither label stay in.
- An account's median is the middle of its reels' view counts, and its average is their mean. Band figures are percentiles across accounts, never a mean across accounts.
- The held-out test compares every reel with the median and the average of the same account's other reels, and counts each account once.
- The age comparison takes, for each account, the median views of its reels in an age group and divides it by the median of its own reels read 3 to 13 days after posting. The median reel in the sample was 25 days old at the read.
- Views are Instagram's play count for each reel, the number on the Reels tab, which counts replays. Follower counts come from Virev's account reads of August 6 to October 1, 2026, so views per follower runs a little high for accounts that grew after that read.
- Instagram shows views above 10,000 rounded on the Reels tab, and the counts we store are exact.
- Instagram categories are the label on the profile. Countries come from Virev's creator profile and cover 33,797 accounts, which lean toward accounts brands search for, so we compare them with profiled accounts of the same size.
- The named accounts were opened in a browser on October 27, 2026, on their Reels tabs. Their counts for the same reels matched our read, plus the views added since.
- Our crawler collects accounts for creator marketing, so the sample holds more active creators than Instagram as a whole, and no account under 1,000 followers.
Download the data
The tables behind every chart are in one CSV: average-instagram-reel-views-2026.csv. Each row has a table name and a group. The tables are views_by_follower_band (percentiles of account median views, the median account's average, average over median, views per follower, the shares under followers, and likes and comments per 100 views), next_video_vs_own_median_and_average, views_by_age_at_read_same_account, instagram_category, country and verified_badge. Please cite "Virev, October 2026" and link this page.
Sources
- Instagram Average Views Calculator (Free, Live)
- Free Instagram Average Views Calculator
- Instagram Average Views Calculator
- 17 Instagram Reels Statistics You Need To Know For 2026
- 2026 Instagram Organic Engagement Benchmarks
- Instagram Reels Report 2026: Benchmarks From 346 Reels
- Instagram Reels Views: What Counts (We Measured 425 Posts)
- Only 3.5% of Followers See Your Instagram Posts
- What's a Good IG Story View Rate?
- Instagram Updates Metrics to Focus Creators on Views
- Instagram (@instagram), reels
- Ashton Hall (@ashtonhall), reels
- Virginia (@virginia), reels
- Claire Grand-Clement (@danslacuisinedeclaire), reels
- Prakaash Bhardwaaj (@prakashbhardwaaj), reels