



About 1 in 4 Instagram accounts with 10,000 or more followers trips at least one of the red flags that bought followers and bought likes tend to leave. We ran the six checks of our Instagram fake follower checker over a random tenth of the Instagram accounts in Virev's census, 425,859 accounts with 10,000+ followers, and 23.3% tripped at least one red flag. Two or more red flags at once are rarer, at 2.3%.
A red flag is not a count of fake followers. Virev's crawler does not read follower lists, so nobody here can count fake followers one by one. Each check compares one public number, such as likes per follower or comments per 100 likes, with accounts of the same size, and flags the account when it sits at the far end. The lines sit far enough out that only 1 in 6 accounts of the set they came from trips one. In the wider census nearly 1 in 4 does, because the census holds more accounts that get few likes for their size, such as stores and quiet personal accounts.
The pages that rank for this question are free checker tools and articles that repeat numbers from 2019 to 2022, such as "1 in 4 influencers bought fake followers" or "15% of followers are fake". None of them prints the lines behind its verdicts, and only SociaVault splits its rate by follower count. None splits it by country or account type. This study does both, names six accounts that look odd but pass every red flag, and shares the tables as a CSV.
23.3%
1+ red flag
2.3%
2+ red flags
12.8%
Creators
Red flag checker
Type an account's numbers from its Instagram profile and its latest posts. Each check compares them with the same lines our fake follower checker uses for that follower tier. Nothing leaves this page.
Each check, the account's number and the tier's lines appear here.
How many fake followers do influencers have?
No public number answers this, because only Instagram can see every follower of an account. Every published figure comes from one of two methods, and the two answer different questions.
Follower list tools such as HypeAuditor and Modash read a sample of an account's followers and score each one as real or suspicious. Modash's 2019 country posts, for example, put about 24% of the 95 million followers of Poland's top influencers in the fake group. A large account collects bot followers whether or not it paid for them, so this share counts bots that followed on their own too.
Signal studies like this one score each account as a whole. They ask whether an account's public numbers look like those of an account that bought followers or likes.
The often quoted figures come from older pages. "1 in 4 influencers bought fake followers" is IMAI in a 2022 Forbes council post with no sample size and a one-sentence method. "15%" is from the 2019 CHEQ and University of Baltimore report, where 15% is the share of ad spend lost to fraud. SociaVault's 2026 "37.2% fake or suspicious" is the share of 100,000 accounts that scored 25 or more on its own model, so it is a share of accounts. Instagram's 2018 post on inauthentic activity gives no prevalence number.
Our number is a share of accounts too. 23.3% of accounts with 10,000+ followers trip at least one red flag. It measures how common the signs are and says nothing about how many followers are fake.
The six checks and where each line sits
The checks are the ones our free checker runs on a single account, with lines taken from 431,496 public accounts that Virev's crawler read up to October 1, 2026. The method page explains each line. A red flag sits at the far end of the tier, and a "look" sits in the band before it.
| Check | What it reads | Red flag line, 10K-50K tier | Look line, 10K-50K tier | Reference set past the red flag line |
|---|---|---|---|---|
| Engagement rate | (average likes + comments) / followers, latest 12 posts | Under 0.13% (5th percentile) | Under 0.60% (25th) | 5.0% |
| Comments per 100 likes | Average comments / average likes x 100 | Under 0.62 (10th percentile) | Under 1.34 (25th) | 10.0% |
| Follower jump | Largest rise between two reads 1 to 30 days apart | +20% or more | +10% or more | 1.0% |
| Likes evenness | Spread of likes across 8 to 12 posts (standard deviation / mean) | Under 0.27 (1st percentile) | Under 0.49 (10th) | 1.1% |
| Top post share | The best post's share of all likes and comments in 12 posts | Never a red flag | Over 61% (90th) | none |
| Following ratio | Accounts followed / followers | Over 0.50 (99th percentile) | Over 0.17 (90th) | 1.0% |
The follower jump share comes from the 375,540 accounts our checker measured with two reads inside 30 days. Each tier has its own lines, because a 1,000-follower account and a 1-million-follower account live on different scales. The checker above holds the lines for all six tiers.
How often each red flag trips
| Check | Accounts checked | Red flag | Look | Reference set, red flag |
|---|---|---|---|---|
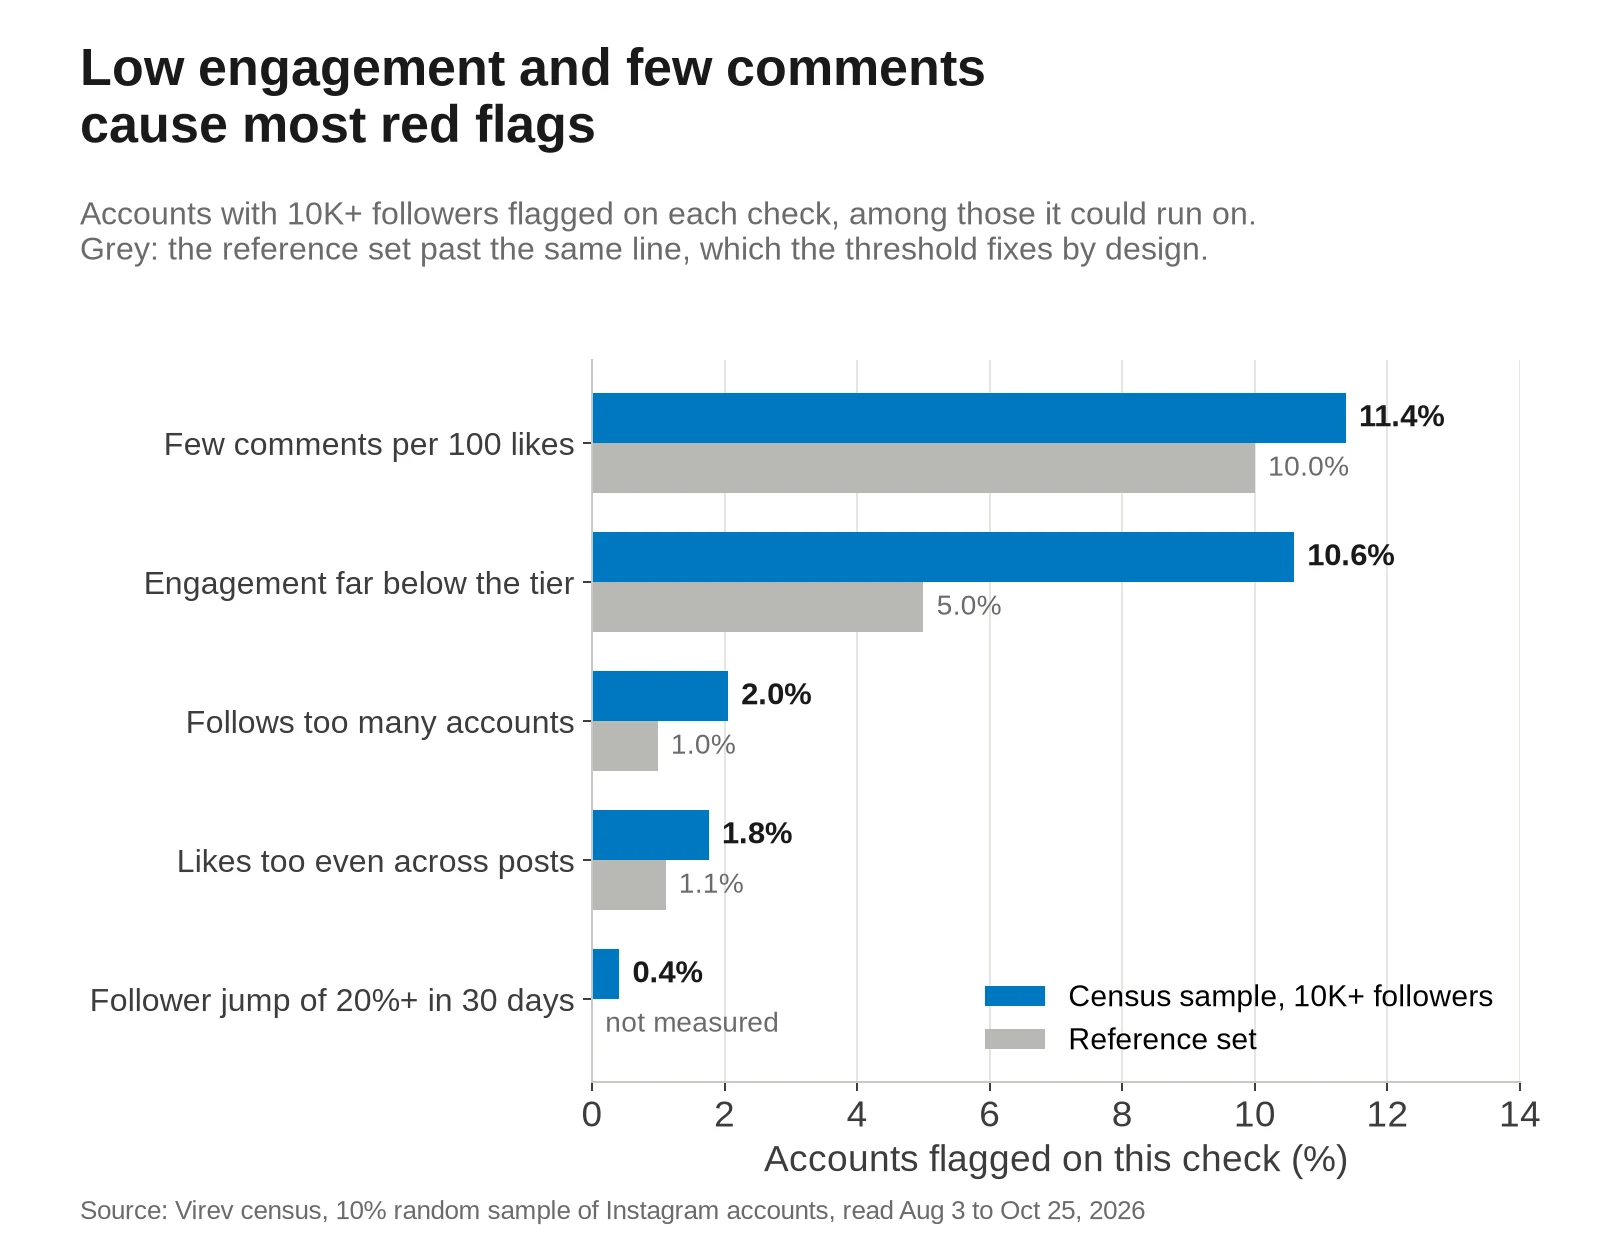
| Comments per 100 likes | 425,859 | 11.4% | 12.0% | 10.0% |
| Engagement rate | 425,859 | 10.6% | 24.0% | 5.0% |
| Following ratio | 425,797 | 2.0% | 12.1% | 1.0% |
| Likes evenness | 365,231 | 1.8% | 11.9% | 1.1% |
| Follower jump | 202,669 | 0.4% | 0.6% | 1.0% (375,540 accounts) |
| Top post share | 214,852 | none | 11.1% | none |
Low engagement drives the gap. 10.6% of accounts in the census sit under the 5th percentile of their tier's engagement, twice the reference set. The census reaches more accounts that Virev does not track as creators, such as stores, quiet personal accounts and pages that stopped posting, and those accounts get fewer likes per follower. The comments check moves least, from 10.0% to 11.4%.
The way the census reads posts adds almost none of the gap. 94,777 accounts with 10,000+ followers sit in both the reference set and our census reads. On the five checks the reference set has, 16.1% of them trip a red flag in the census read and 16.3% in the reference read. On the same five checks the census sample trips 23.1%, and the follower jump check adds the last 0.2 points.
The follower jump check could run on 47.6% of the sample, the accounts we read twice 1 to 30 days apart. For half of those accounts the reads sat 6 days apart or less on average, so a jump had less time to build, and 0.4% of them crossed +20%. Among profiled accounts, which we read more often, 1.1% did, close to the 1.0% our checker measured on 375,540 accounts. Our follower growth study found 3.1% for reads up to 30 days apart, and it shows what a real spike looks like.
Red flags by follower count
| Followers | Accounts | 1+ red flag | 2+ red flags | Engagement flag | Comments flag | Reference set, 1+ red flag |
|---|---|---|---|---|---|---|
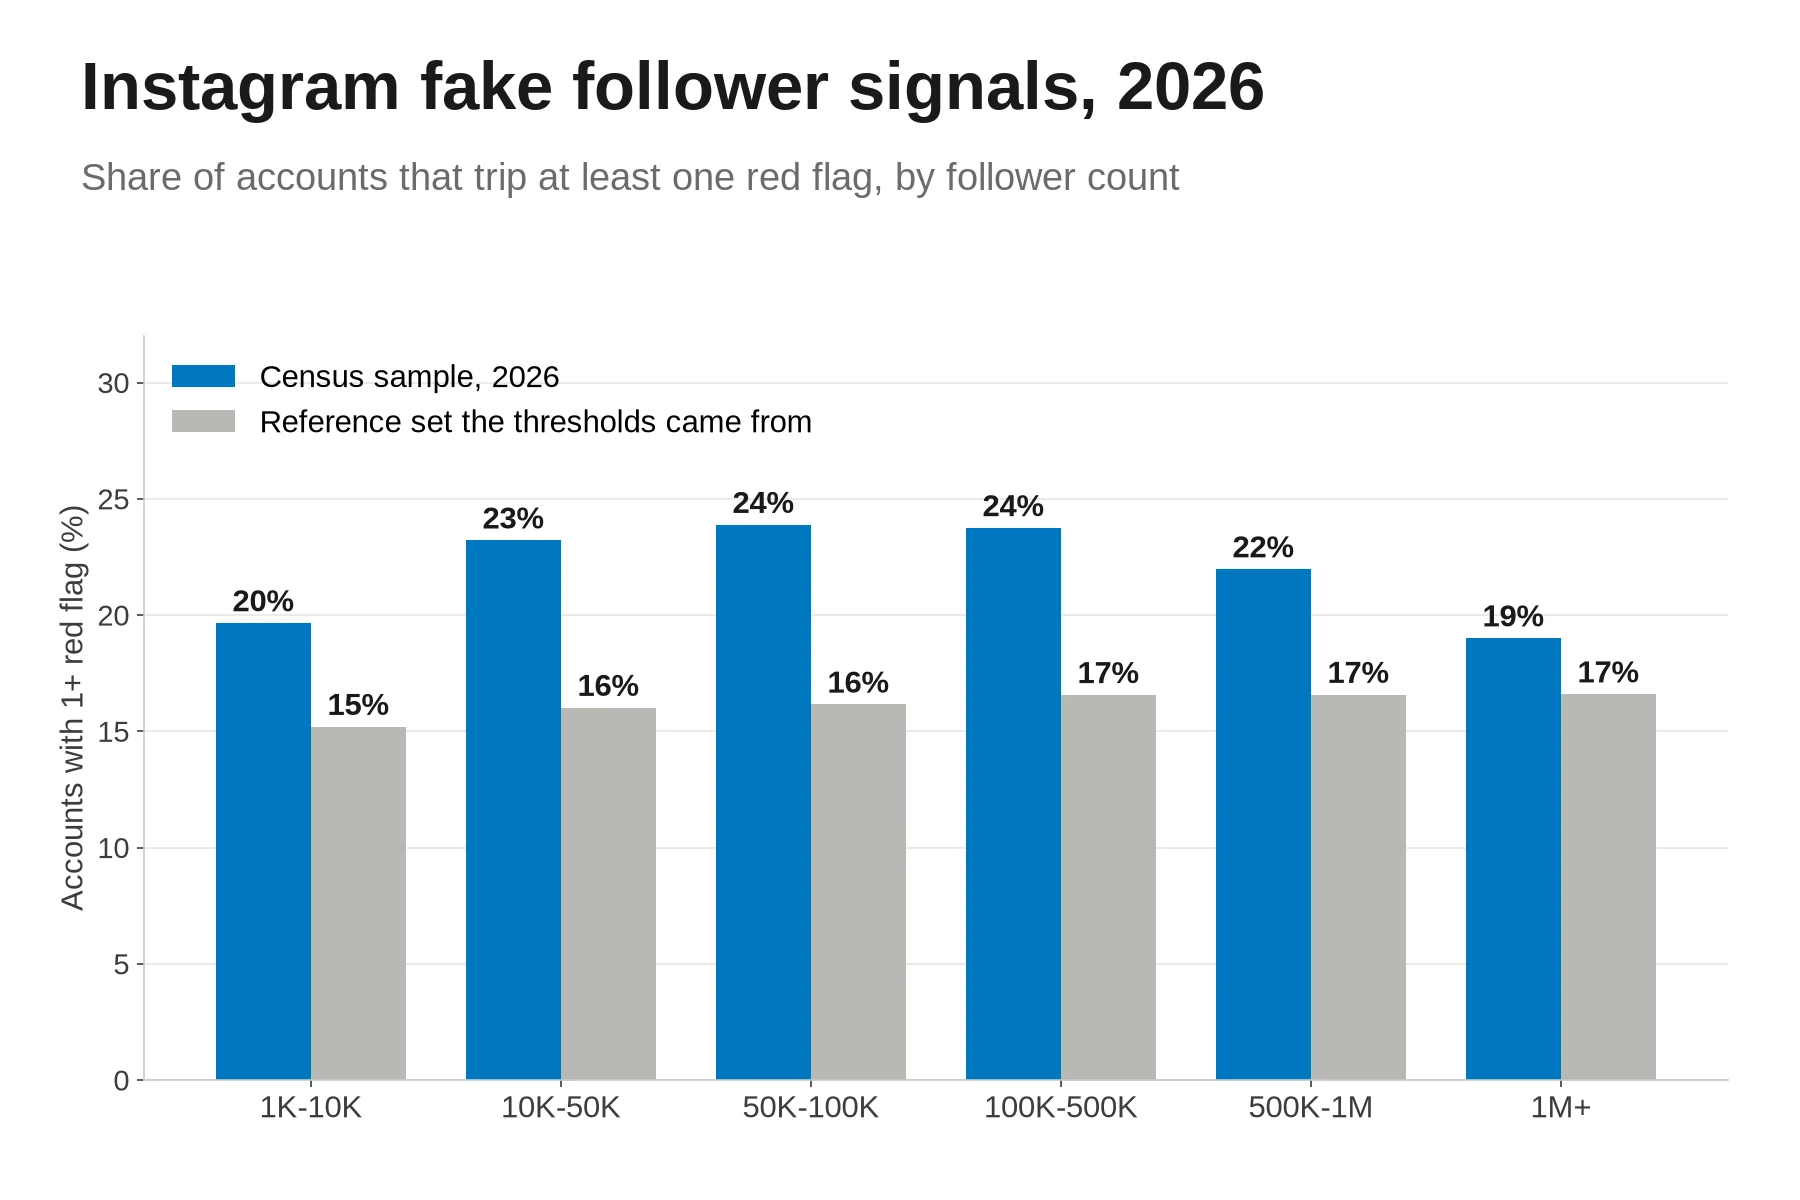
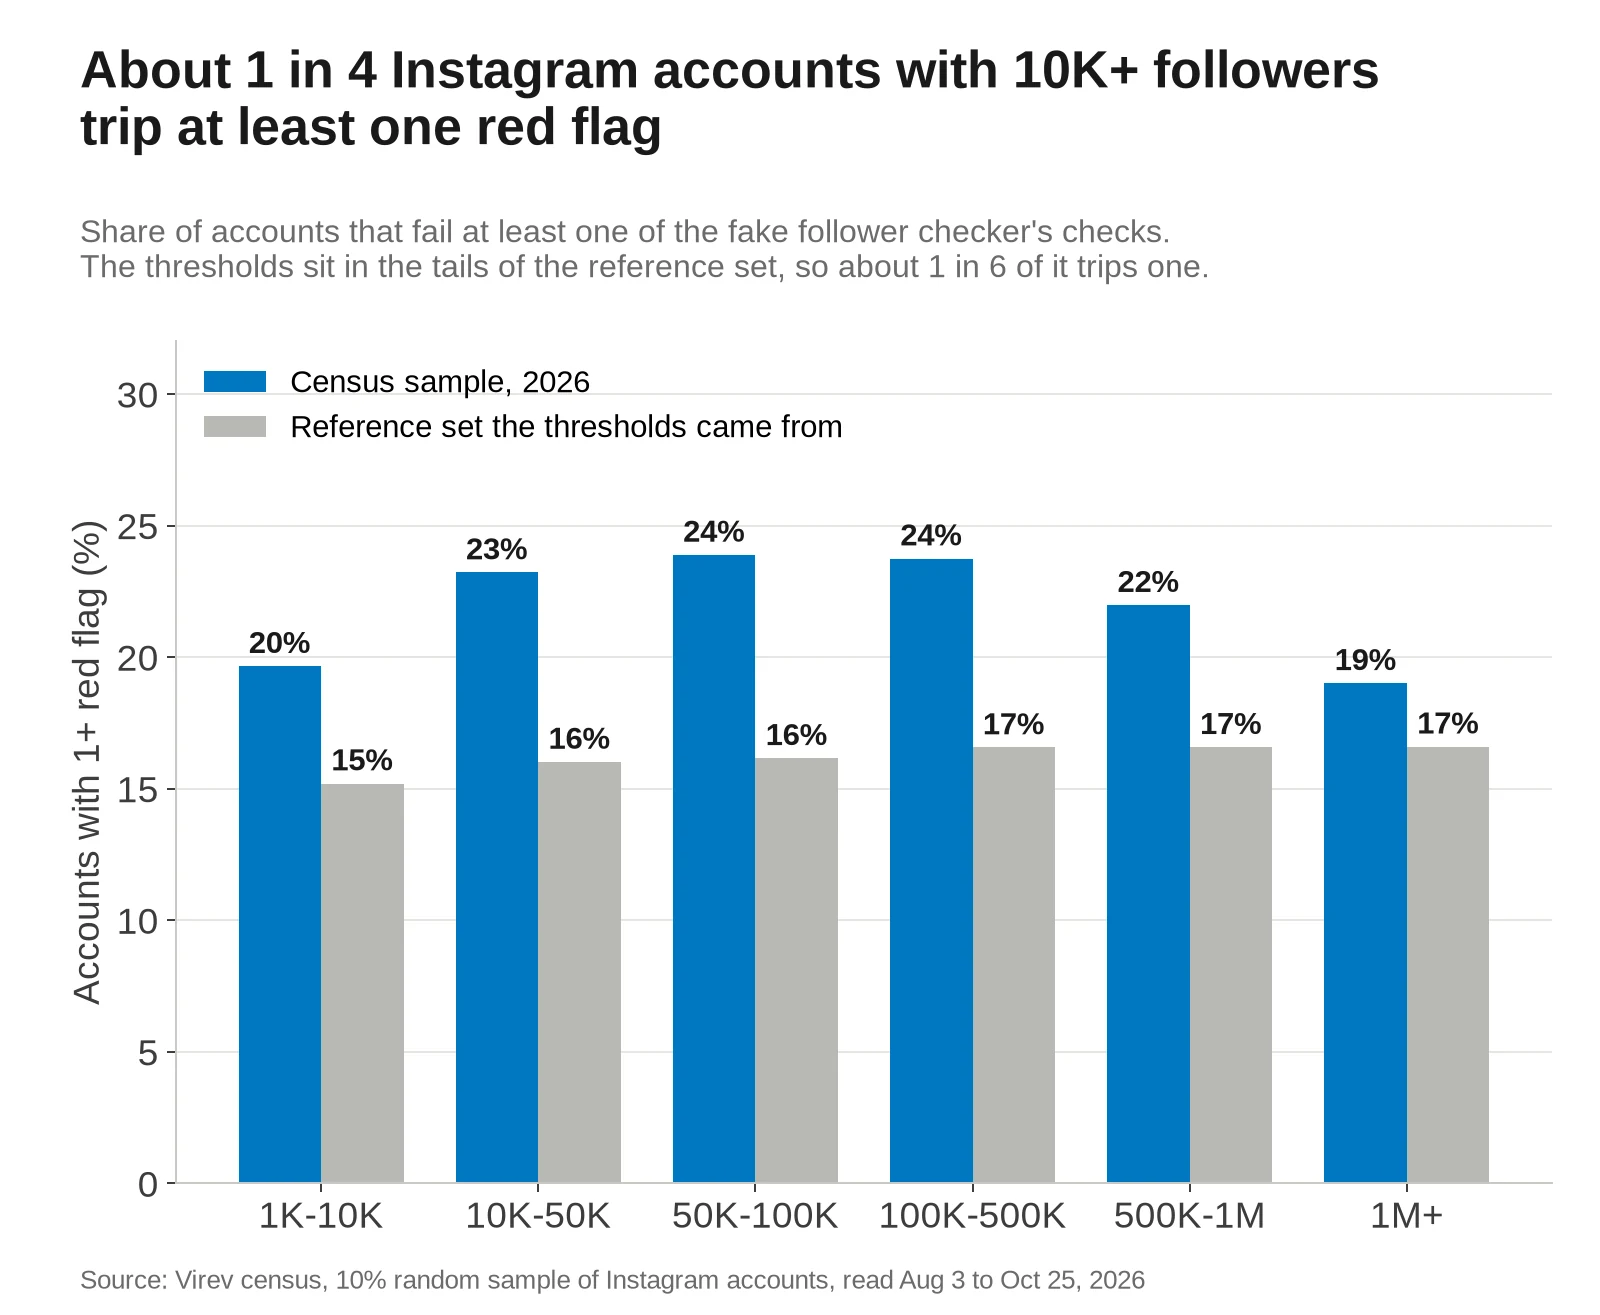
| 1K-10K | 1,232,507 | 19.7% | 2.4% | 5.5% | 10.4% | 15.2% |
| 10K-50K | 297,363 | 23.2% | 2.6% | 10.3% | 11.5% | 16.0% |
| 50K-100K | 56,999 | 23.9% | 2.0% | 11.8% | 11.2% | 16.2% |
| 100K-500K | 59,197 | 23.8% | 1.6% | 11.4% | 11.1% | 16.6% |
| 500K-1M | 7,098 | 22.0% | 1.2% | 10.0% | 10.0% | 16.6% |
| 1M+ | 5,202 | 19.0% | 1.1% | 6.2% | 11.3% | 16.6% |
The share is highest at 50,000 to 500,000 followers, where about 24% trip a red flag. Two red flags at once fall with size, from 2.6% at 10,000 to 50,000 followers to 1.1% above 1 million. Small accounts trip the likes evenness and following checks most. 3.0% of accounts with 1,000 to 10,000 followers have likes that are too even, and 3.1% follow too many accounts for their size.
Two red flags at once are rare
Most flagged accounts trip one check. Of the 425,859 accounts with 10,000+ followers, 9,858 (2.3%) tripped two or more and 383 (0.09%) tripped three. In the reference set, 0.7% trip two or more.
| Red flags tripped, 10K+ followers | Accounts | Share of all accounts |
|---|---|---|
| Comments only | 40,295 | 9.5% |
| Engagement only | 36,608 | 8.6% |
| Following only | 7,173 | 1.7% |
| Engagement and comments | 6,711 | 1.6% |
| Likes evenness only | 4,627 | 1.1% |
| Engagement and following | 753 | 0.2% |
| Follower jump only | 707 | 0.2% |
| Engagement and likes evenness | 675 | 0.2% |
| Comments and likes evenness | 633 | 0.1% |
The pairs tell different stories. Low engagement with few comments fits an audience that does not interact, which bought followers cause and brand pages show too. Even likes with few comments fit bought likes, because a like package raises the likes and leaves the comments where they were. One account in the sample, with 32,000 followers, shows that pattern. Its 12 latest posts each held between 2,608 and 2,664 likes, and the 12 posts drew 7 comments in total. Its engagement rate sat at the 82nd percentile of its tier, so the engagement check passed. The evenness and comments checks caught it. We do not name it, because a pattern is not proof of who bought what.
Brand accounts trip more red flags than creators
| Account type | Accounts | 1+ red flag | 2+ red flags | Engagement flag | Comments flag |
|---|---|---|---|---|---|
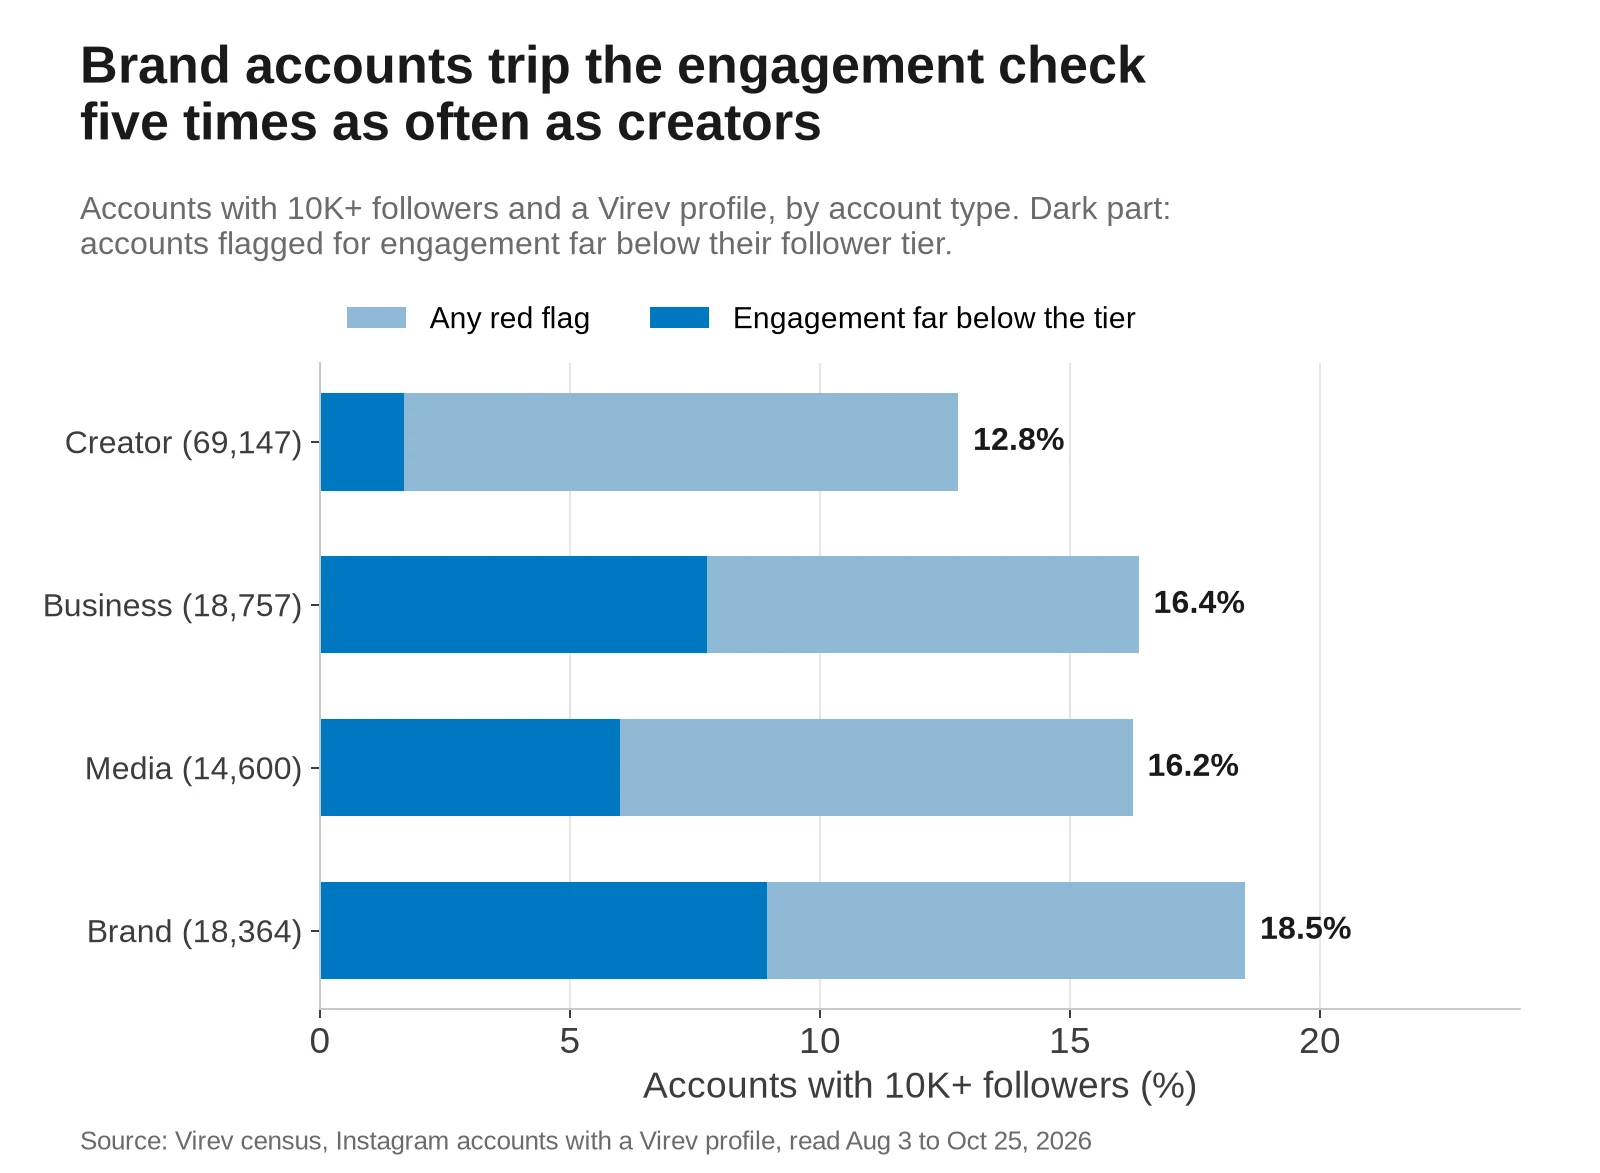
| Creator | 69,147 | 12.8% | 0.5% | 1.7% | 7.0% |
| Business | 18,757 | 16.4% | 1.0% | 7.7% | 7.4% |
| Media | 14,600 | 16.2% | 0.8% | 6.0% | 8.2% |
| Brand | 18,364 | 18.5% | 1.0% | 8.9% | 9.0% |
Creators trip the fewest red flags, 12.8%, and only 1.7% fall under the engagement line. Brand accounts trip the engagement check on 8.9%, five times as often. A brand page gets fewer likes per follower than a creator of the same size, so it looks like an account with idle followers. Our engagement rate benchmarks show brand accounts at less than half of creator rates in the same tier. When you vet a creator, the creator rate is the one that matters.
Red flags by country
| Country | Accounts | Share of profiled accounts | 1+ red flag | Comments flag | Median comments per 100 likes |
|---|---|---|---|---|---|
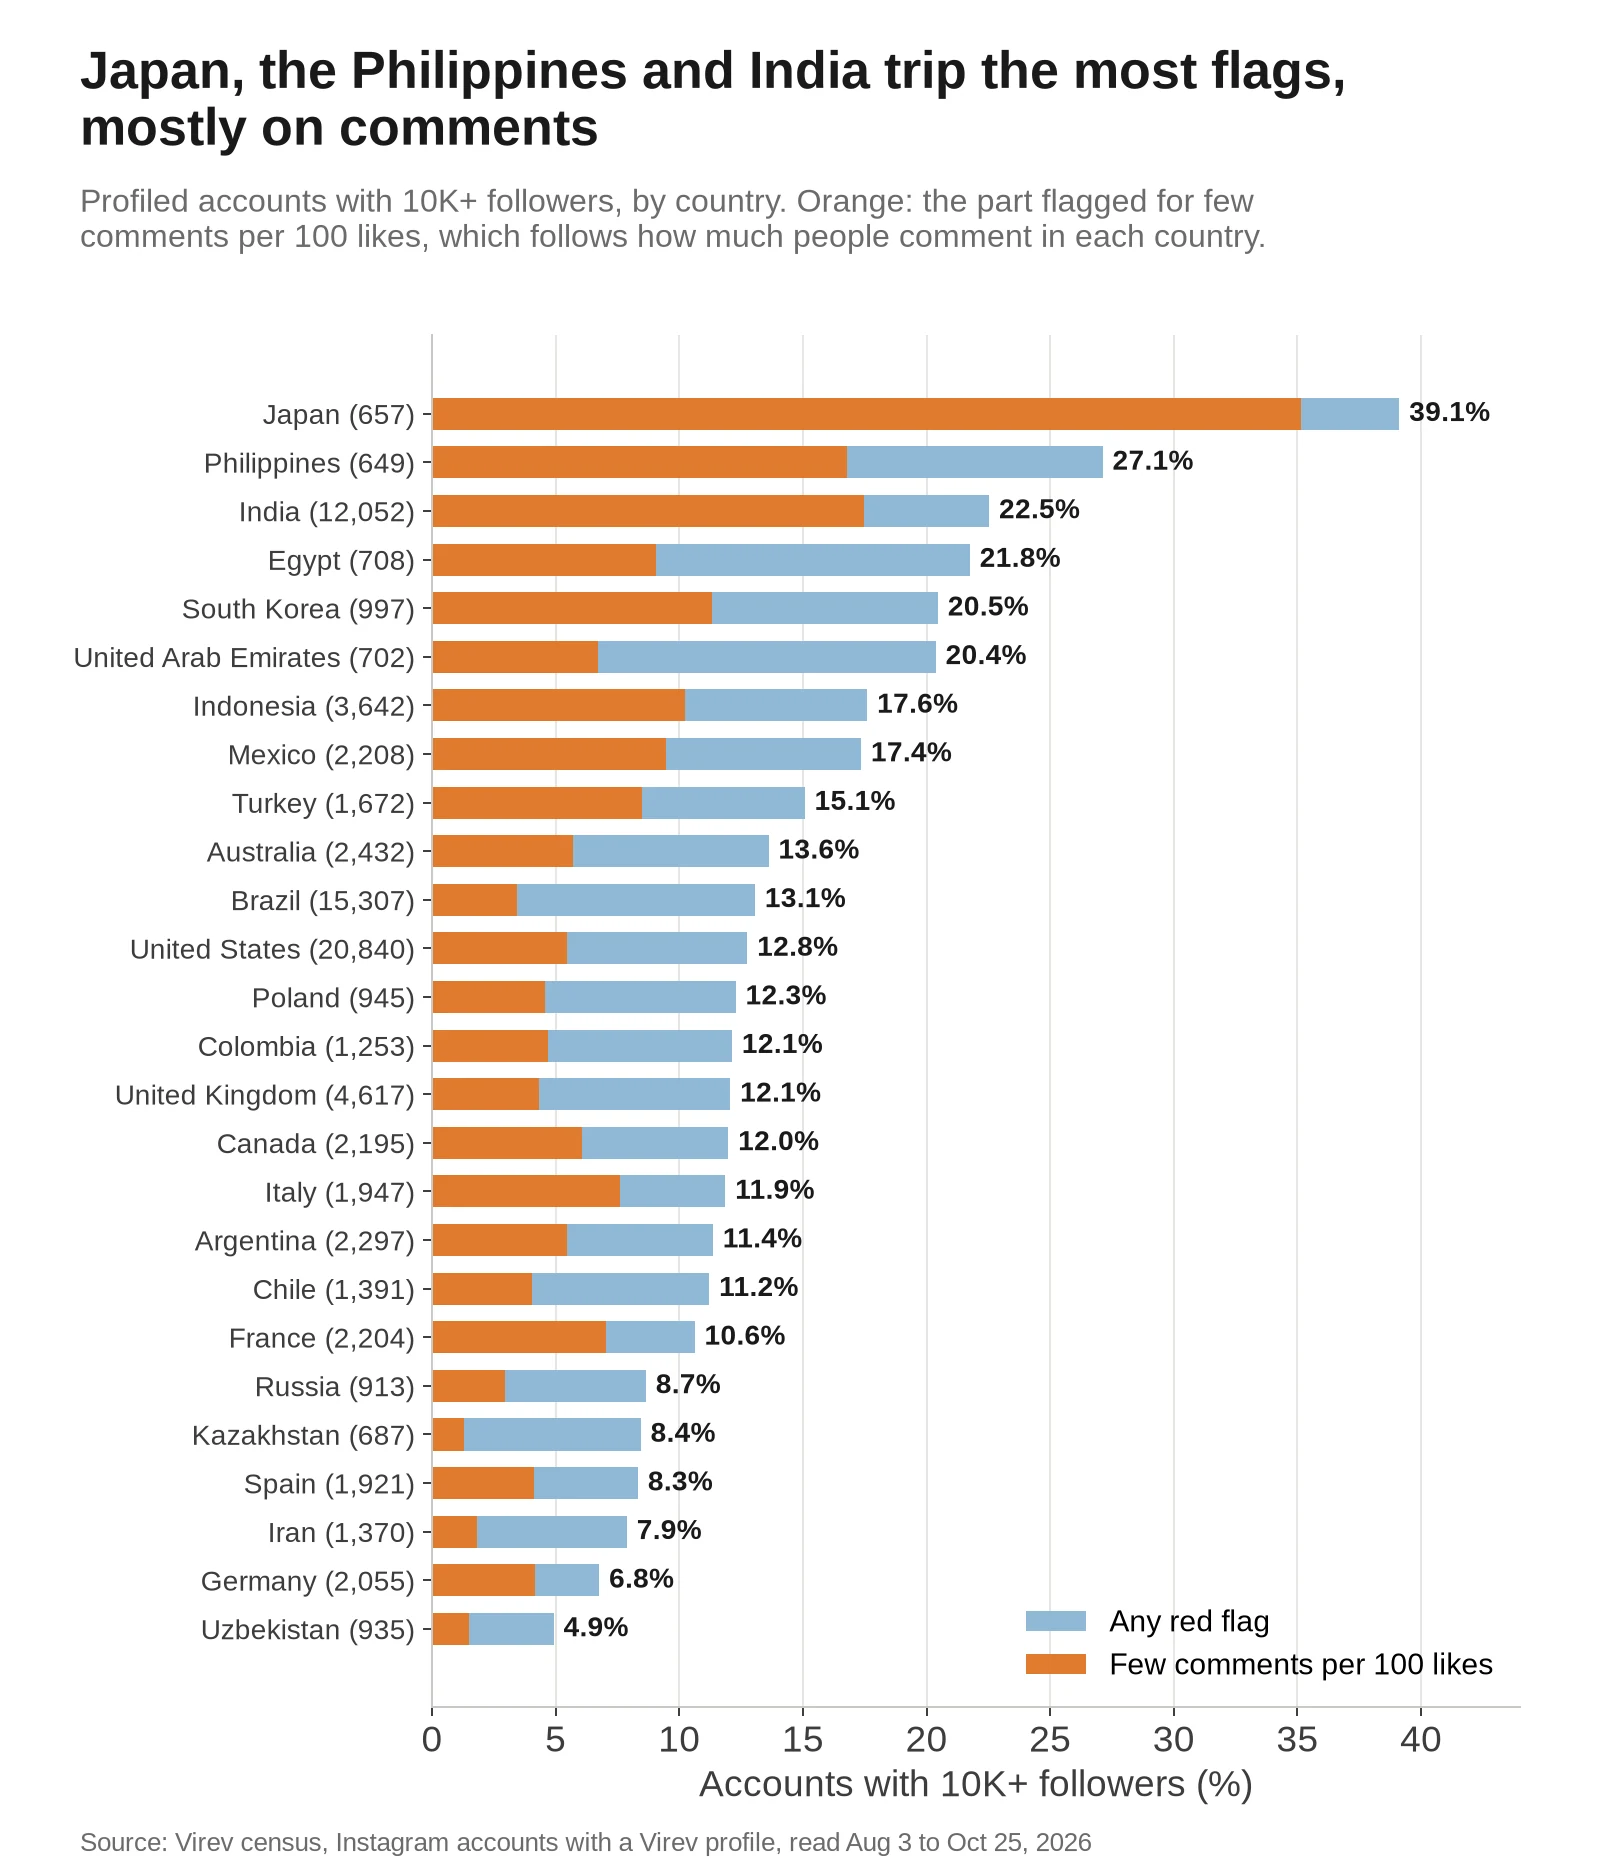
| Japan | 657 | 0.6% | 39.1% | 35.2% | 0.87 |
| Philippines | 649 | 0.6% | 27.1% | 16.8% | 1.63 |
| India | 12,052 | 10.4% | 22.5% | 17.5% | 1.66 |
| Egypt | 708 | 0.6% | 21.8% | 9.0% | 2.79 |
| South Korea | 997 | 0.9% | 20.5% | 11.3% | 2.37 |
| United Arab Emirates | 702 | 0.6% | 20.4% | 6.7% | 4.20 |
| Indonesia | 3,642 | 3.1% | 17.6% | 10.2% | 2.19 |
| Mexico | 2,208 | 1.9% | 17.4% | 9.5% | 2.10 |
| Turkey | 1,672 | 1.4% | 15.1% | 8.5% | 2.54 |
| Australia | 2,432 | 2.1% | 13.6% | 5.7% | 3.31 |
| Brazil | 15,307 | 13.2% | 13.1% | 3.4% | 4.90 |
| United States | 20,840 | 17.9% | 12.8% | 5.4% | 3.29 |
| Poland | 945 | 0.8% | 12.3% | 4.5% | 3.27 |
| Colombia | 1,253 | 1.1% | 12.1% | 4.7% | 3.48 |
| United Kingdom | 4,617 | 4.0% | 12.1% | 4.3% | 3.36 |
| Canada | 2,195 | 1.9% | 12.0% | 6.1% | 3.74 |
| Italy | 1,947 | 1.7% | 11.9% | 7.6% | 2.29 |
| Argentina | 2,297 | 2.0% | 11.4% | 5.4% | 3.42 |
| Chile | 1,391 | 1.2% | 11.2% | 4.0% | 3.14 |
| France | 2,204 | 1.9% | 10.6% | 7.0% | 2.83 |
| Russia | 913 | 0.8% | 8.7% | 3.0% | 2.90 |
| Kazakhstan | 687 | 0.6% | 8.4% | 1.3% | 5.16 |
| Spain | 1,921 | 1.6% | 8.3% | 4.1% | 3.10 |
| Iran | 1,370 | 1.2% | 7.9% | 1.8% | 6.03 |
| Germany | 2,055 | 1.8% | 6.8% | 4.2% | 2.99 |
| Uzbekistan | 935 | 0.8% | 4.9% | 1.5% | 4.41 |
Country covers 116,365 profiled accounts with 10,000+ followers, so each share above is a share of profiled accounts. Japan trips the most red flags, 39.1%, and 35.2 points of that come from the comments check. The median Japanese account gets 0.87 comments per 100 likes, against 3.29 in the United States. Followers of Japanese accounts comment far less per like. The comments line is set per follower tier for all countries at once, so it flags quiet comment cultures. Read a comments flag on an account from Japan, India or the Philippines with that in mind, and look at its other checks first.
Red flags by Instagram category
| Instagram category | Accounts | 1+ red flag | Engagement flag | Comments flag |
|---|---|---|---|---|
| Clothing (Brand) | 3,294 | 38.8% | 28.6% | 13.8% |
| Product/service | 3,149 | 33.0% | 23.9% | 10.2% |
| Reel creator | 15,777 | 26.5% | 7.5% | 18.6% |
| Entrepreneur | 5,691 | 23.9% | 14.0% | 7.0% |
| (no category shown) | 233,873 | 23.6% | 11.3% | 11.3% |
| Education | 3,166 | 23.0% | 11.7% | 11.2% |
| Digital creator | 32,804 | 21.2% | 7.0% | 11.5% |
| Photographer | 3,352 | 20.5% | 3.8% | 10.9% |
| Public figure | 5,224 | 20.4% | 7.1% | 8.7% |
| Personal blog | 8,569 | 20.0% | 4.8% | 10.9% |
| Artist | 18,759 | 18.4% | 4.6% | 10.3% |
| Blogger | 6,515 | 18.2% | 5.7% | 9.1% |
| Musician/band | 4,128 | 16.3% | 5.3% | 7.6% |
| Athlete | 3,641 | 16.1% | 1.7% | 11.0% |
The category is the label an account picks on its Instagram profile, and 233,873 of the 425,859 accounts show none. Store pages trip the most. 38.8% of "Clothing (Brand)" accounts and 33.0% of "Product/service" accounts trip a red flag, most of them on engagement. Athletes and musicians trip the fewest. "Reel creator" accounts trip the comments check on 18.6%, which fits reels, where many viewers like a post and few comment.
The verified badge makes no difference
Verified accounts tripped red flags at the same rate as unverified ones. Of 54,818 verified profiled accounts with 10,000+ followers, 17.0% tripped at least one, against 17.1% of 87,516 unverified ones, and two or more on 0.7% and 0.9%. The badge confirms who runs the account and says nothing about who follows it. Our verified accounts study has more on what the badge does and does not tell you.
Six accounts that look odd and pass every red flag
These accounts look strange on one number and trip no red flag. We read each one again signed out on Instagram on October 26, 2026. None of them is named for bought followers, and none of them tripped a red flag.
Three follower spikes with a viral reel behind them
Alan and Kat (@thegilliamfam) run a family account that went from 138,670 followers on September 4 to 202,215 on October 7, a 46% rise. A reel posted on September 29 had 1,552,986 likes and 18.6 million plays when we read it on October 9, and Instagram showed 1.7 million likes on October 26. The other 11 recent posts got 65 to 6,878 likes each. The jump fell between two reads 33 days apart, so the 30-day check did not see it, and the reads inside 30 days show +1.8%.
Mukul Soman (@mukul.soman) is a photographer who went from 357,970 followers on October 19 to 392,793 on October 21. That is +9.7% in two days, under the 10% look line. A hummingbird reel of October 18 had 1,798,217 likes on October 21 and 3.1 million on October 26, while the other recent posts got 448 to 4,321. The account had about 419,000 followers on October 26.
Eärendil Aragorn Steen (@earendilsteen) is a comic from Norway who went from 66,755 followers on September 8 to 80,073 on October 7. That is +19.95% in 29 days, 0.05 points under the red flag line. A reel of September 29 had 64,043 likes and 451,844 plays when we read it on October 10, and 92,000 likes on October 26. The other recent posts got 130 to 4,953 likes.
In all three, one post holds most of the engagement, so the top post share check says "look". That check never raises a red flag, because a viral post is real engagement and can cause a spike on its own.
Two large brands with low engagement
@chatgpt had 7,766,764 followers and follows 8 accounts. Its 12 latest posts averaged 6,980 likes and 229 comments, an engagement rate of 0.09%, at the 8th percentile of accounts with 1 million or more followers. The red flag line there is 0.05%, so it gets a "look" and no red flag. It gained 667,376 followers from September 1 to October 21. Most of that came between two reads 36 days apart, which the 30-day check skips, and the reads inside 30 days show +1.2% at most.
@jeep had 8,178,714 followers and an engagement rate of 0.10%, at the 9th percentile. Its follower count fell by 30,000 from September 2 to October 21.
Both pass the comments, evenness and following checks. Big brand accounts often get few likes for their size, and the engagement line at the 5th percentile sits below both of them.
One creator close to an old line
Jessica Secrest (@applesauceandadhd) had 1,633,027 followers at our read and 1.6 million on October 26. When we built the checker on October 2, her likes had an evenness of 0.40, under that tier's 5th percentile of 0.43, so a first draft that set the line at the 5th percentile flagged her. Six checks with a 5% tail each would flag about one real account in four, so the line moved to the 1st percentile. In October her evenness was 0.71 and her engagement sat at the 24th percentile, one "look" and no red flag.
What a red flag can and cannot prove
- A red flag shows that one number sits at the far end of accounts of the same size.
- A red flag cannot show who bought followers, or whether anyone did, because brand pages, accounts that stopped posting and quiet comment cultures land in the same tails.
- By design, about 1 in 6 accounts in the reference set trips at least one red flag, so one red flag on its own is a reason to look at the posts.
- Two red flags that fit together, such as even likes with almost no comments, are rarer, with 0.15% of accounts tripping that pair and no other flag, and worth a direct question to the creator.
- None of these checks reads comment text, follower lists or audience country, so they cannot see bot comments or a follower base from the wrong country.
Our guide on how to audit suspicious engagement without making fraud claims covers what to write down and what to ask the creator.
What to do with this
For brands and agencies
- Run the account through the fake follower checker and read each check with the account's own numbers next to the verdict.
- Treat one red flag as a reason to open the posts.
- Look for a viral reel behind a spike and for comments that answer the post.
- Discount a comments flag on accounts from Japan, India and the Philippines, where accounts get fewer comments per like in our data.
- Ask the creator for their own Instagram insights when two red flags fit together.
Virev creator search covers 180M+ creators and shows each one's follower count and engagement rate, so you can compare a shortlist before you contact anyone. To start with mid-size accounts, search Instagram creators with 10,000 to 100,000 followers in Virev.
For creators
- If a brand asks about a spike, point to the post that caused it, as the three accounts above could.
- A low comments ratio on reels is common, and 18.6% of accounts labelled "Reel creator" trip the comments check.
- Bought likes make the likes too even, and the evenness check is built to see that.
Questions about fake Instagram followers
How many fake followers are on Instagram?
Instagram does not publish a number for fake followers. Follower list tools estimate that a share of each large account's followers are bots, and many of those bots follow big accounts on their own. In Virev's 2026 data, 23.3% of accounts with 10,000+ followers trip at least one red flag for bought followers or likes, and 2.3% trip two or more.
What percentage of influencers have fake followers?
Nobody can measure that from the outside without each account's full follower list. What can be measured is how many accounts show the signs. 12.8% of profiled creators with 10,000+ followers tripped at least one red flag in our data, and 0.5% tripped two or more.
How do I know if an influencer has fake followers?
Compare the account with accounts of the same size. The six checks above cover engagement, comments per like, follower jumps, how even the likes are, how much one post carries and how many accounts it follows. The checker on this page runs them in your browser, and the free fake follower checker runs them on any public account we can read.
Do verified accounts have fewer fake followers?
Not by these signals. Verified and unverified profiled accounts with 10,000+ followers tripped red flags at 17.0% and 17.1%.
How we measured, and what can be wrong
- The main sample is every Instagram account in Virev's census whose Instagram id ends in 3, a random tenth of the census, with 1,000 or more followers at its latest read.
- Followers and following come from each account's latest read between August 3 and October 26, 2026, in Virev's ClickHouse census tables.
- For each account we took its 12 latest posts that were at least 3 days old when read and posted within 180 days of the read, using the latest read of each post.
- We left out accounts with fewer than 6 such posts, which left 1,670,154 accounts.
- We also left out 11,788 accounts (1,476 with 10,000+ followers) whose posts all showed 3 or fewer likes, because that is how hidden like counts reach our crawler.
- The checks and their lines are the fake follower checker's in apps/search, built on 431,496 public accounts that Virev's crawler read between July 1 and October 1, 2026.
- The engagement and comment lines come from the engagement benchmarks of that same set, and we ran the same check code on that set to get the reference rates.
- Our census has no pinned post flag, so an account that posts rarely can have a recent pinned post in its 12-post window.
- 8,871 accounts with 10,000+ followers had no comments on any of their latest posts, which happens when comments are off or nobody comments, and they make up 18.3% of the comments flags.
- The follower jump check uses the last read of each day and the largest rise between two reads 1 to 30 days apart.
- The follower jump check skips accounts read only once, and it misses a jump that falls between reads more than 30 days apart.
- The second set, for country, account type and the verified badge, is every account with a Virev profile or in the October 1 export, read the same way, and it holds 413,062 accounts with 1,000+ followers, 244,891 of them with 10,000+.
- Country and account type come from the Virev profile and cover 116,365 and 124,362 of those 244,891 accounts.
- The verified badge comes from the October 1 export and covers 142,334 of them.
- Profiled accounts lean toward accounts that brands search for, which is one reason they trip fewer red flags than the random sample, 16.0% against 23.3%.
- Virev's crawler reads public pages only, so it does not read follower lists, comment text or audience country.
- We read the named accounts again on October 26, 2026, signed out in a browser, and contacted nobody.
Download the data
The tables behind every chart are in one CSV, instagram-fake-follower-signals-2026.csv. Each row has a table name and a group. The tables are summary, by_follower_tier, reference_by_follower_tier, by_check_10k_plus, flag_combinations_10k_plus, instagram_category_10k_plus, account_type_10k_plus, country_10k_plus and verified_badge_10k_plus. Please cite "Virev, October 2026" and link this page.
Sources
- New Study: One In Four Influencers Bought Fake Followers
- Fake Follower Study 2026
- State of Influencer Marketing 2020
- The Economic Cost of Bad Actors on the Internet, Influencer Marketing 2019
- Poland's top influencers have 23 million fake followers
- Influencer marketing fraud revealed in study of 700,000 Instagram posts
- Reducing inauthentic activity on Instagram
- Alan & Kat (@thegilliamfam)
- Mukul Soman (@mukul.soman)
- Eärendil Aragorn Steen (@earendilsteen)
- ChatGPT (@chatgpt)
- Jeep (@jeep)
- Jessica Secrest (@applesauceandadhd)