



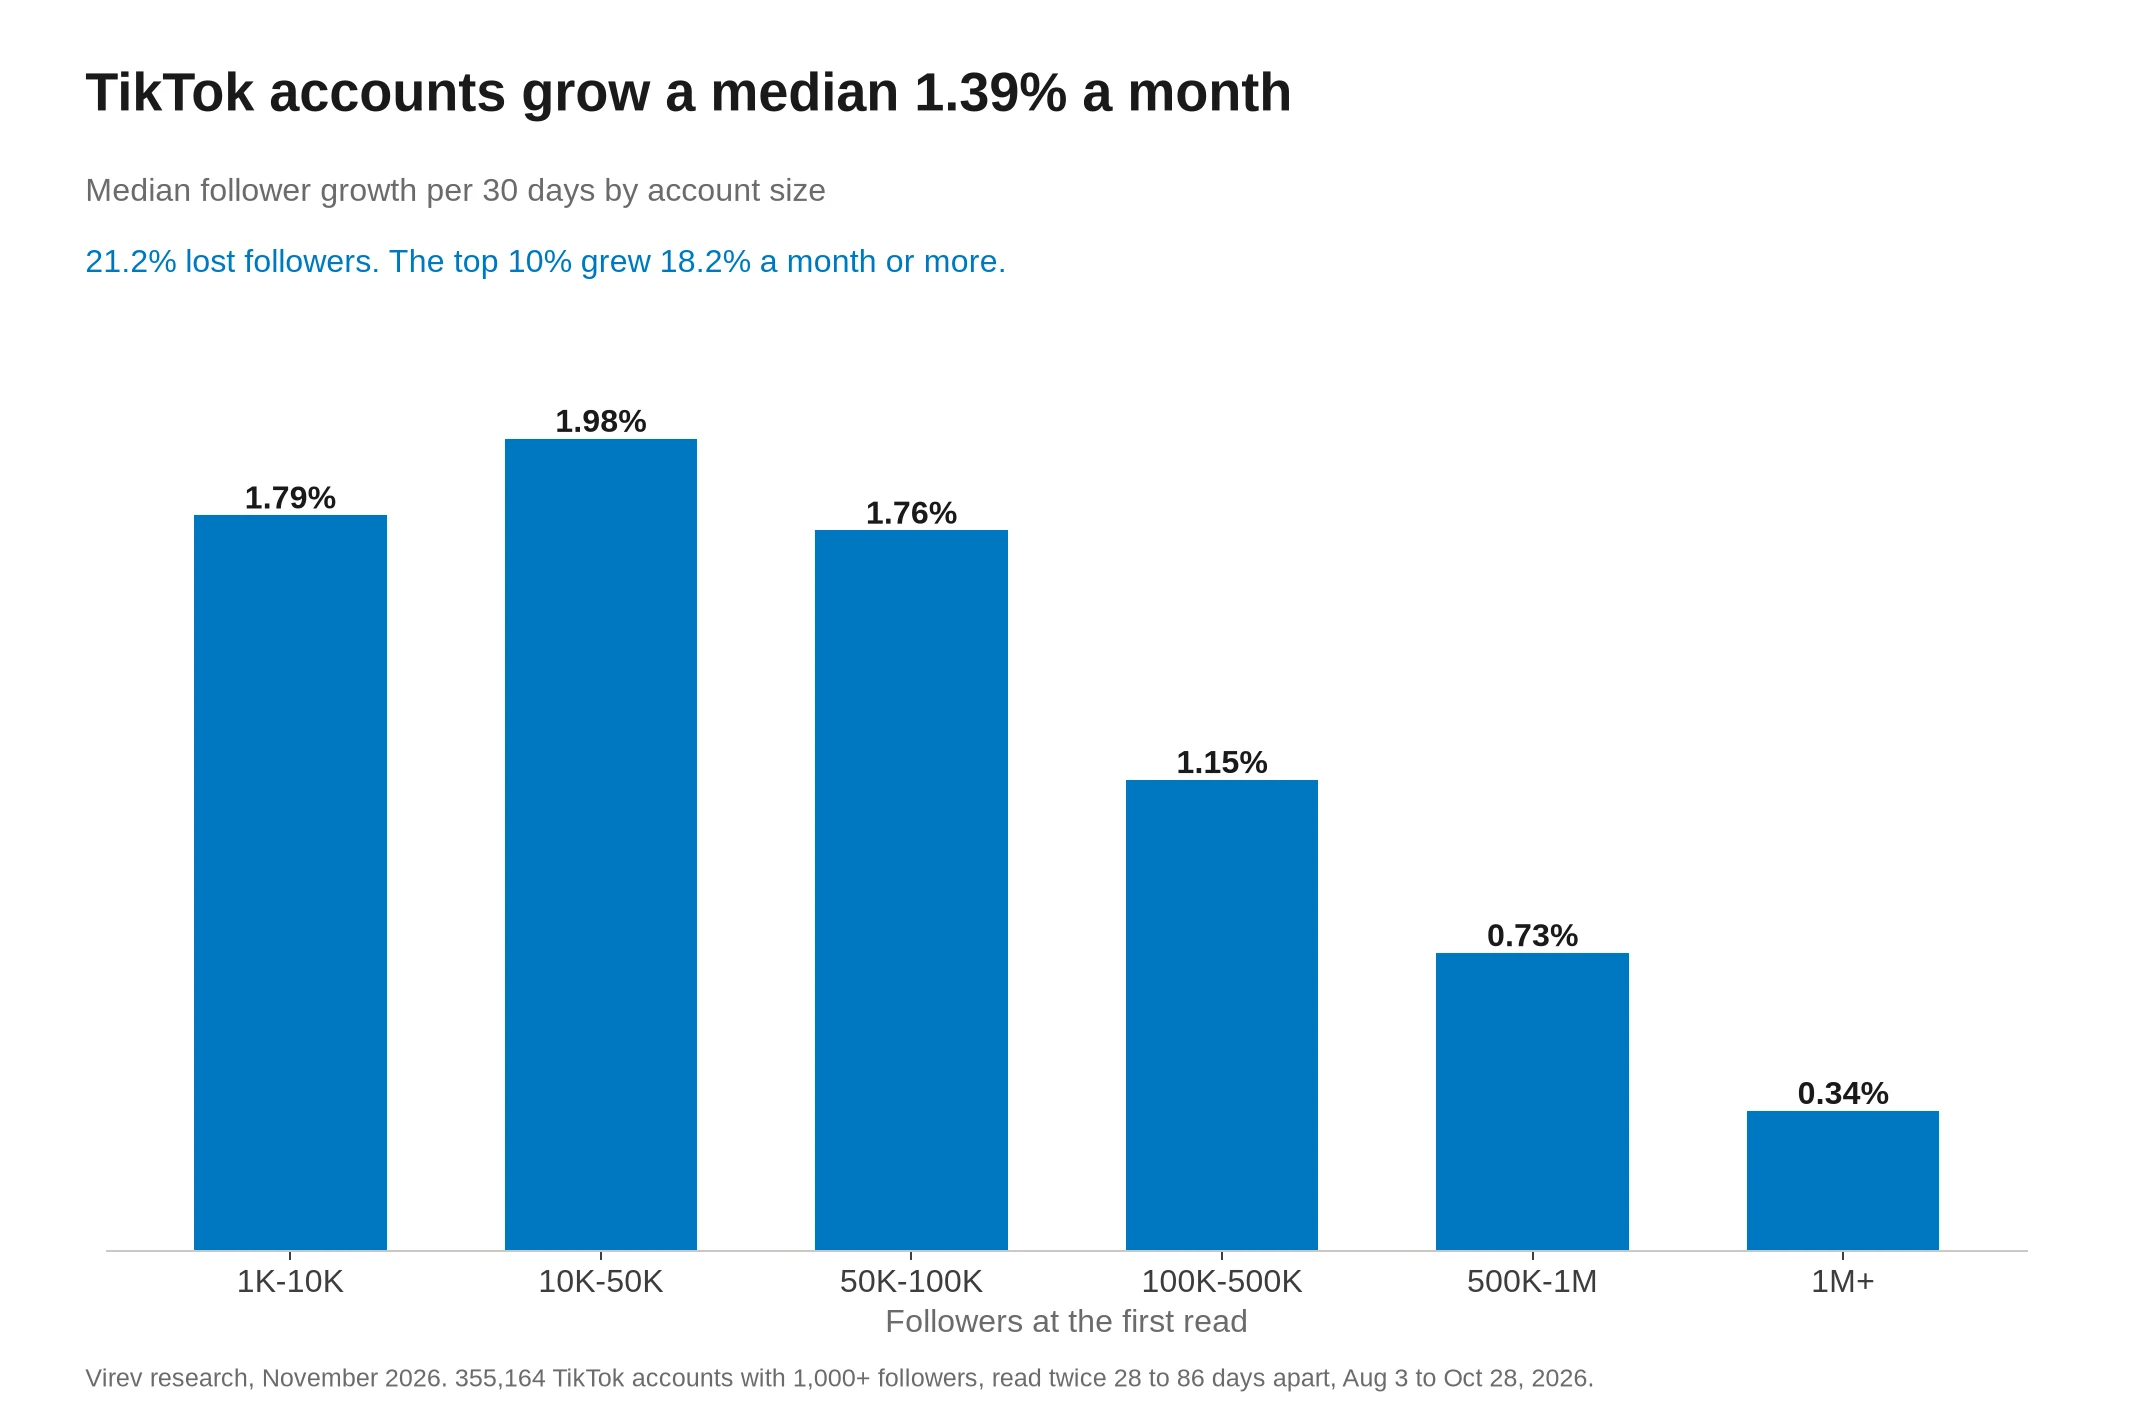
The median TikTok account with 1,000 or more followers grows 1.39% a month. We read the follower counts of 355,164 public TikTok accounts twice, 28 to 86 days apart (median 53 days), between August 3 and October 28, 2026. One in five accounts (21.2%) had fewer followers at the second read. The top 10% grew 18.2% a month or more, and the top 1% grew 86.7% a month or more. Accounts with 10K to 50K followers grew fastest in percent, at 1.98% a month, and accounts with 1M+ followers grew 0.34%.
Most pages that rank for this question quote a mean from brand accounts. Dash Social reports 3.4% a month for the brand accounts in its September 2025 benchmark. Socialinsider gives yearly growth by page size, such as 150% in 2025 for brand accounts with 1K to 5K followers. Hootsuite lists an overall TikTok weekly follower growth of 197.37%. A mean lets a few accounts that double pull the number up. In our data the mean is 7.12% a month and the median is 1.39%. This study reports medians for creator and brand accounts together, by size and by habit, and counts the accounts that shrink.
1.39%
Median account
21.2%
Lost followers
18.2%
Top 10%
The median account grows 1.39% a month
We took every TikTok account our crawler read twice, at least 28 days apart, and turned the change into a 30-day rate. An account read 53 days apart that went from 20,000 to 20,500 followers grew 2.5% in 53 days, or 1.4% per 30 days.
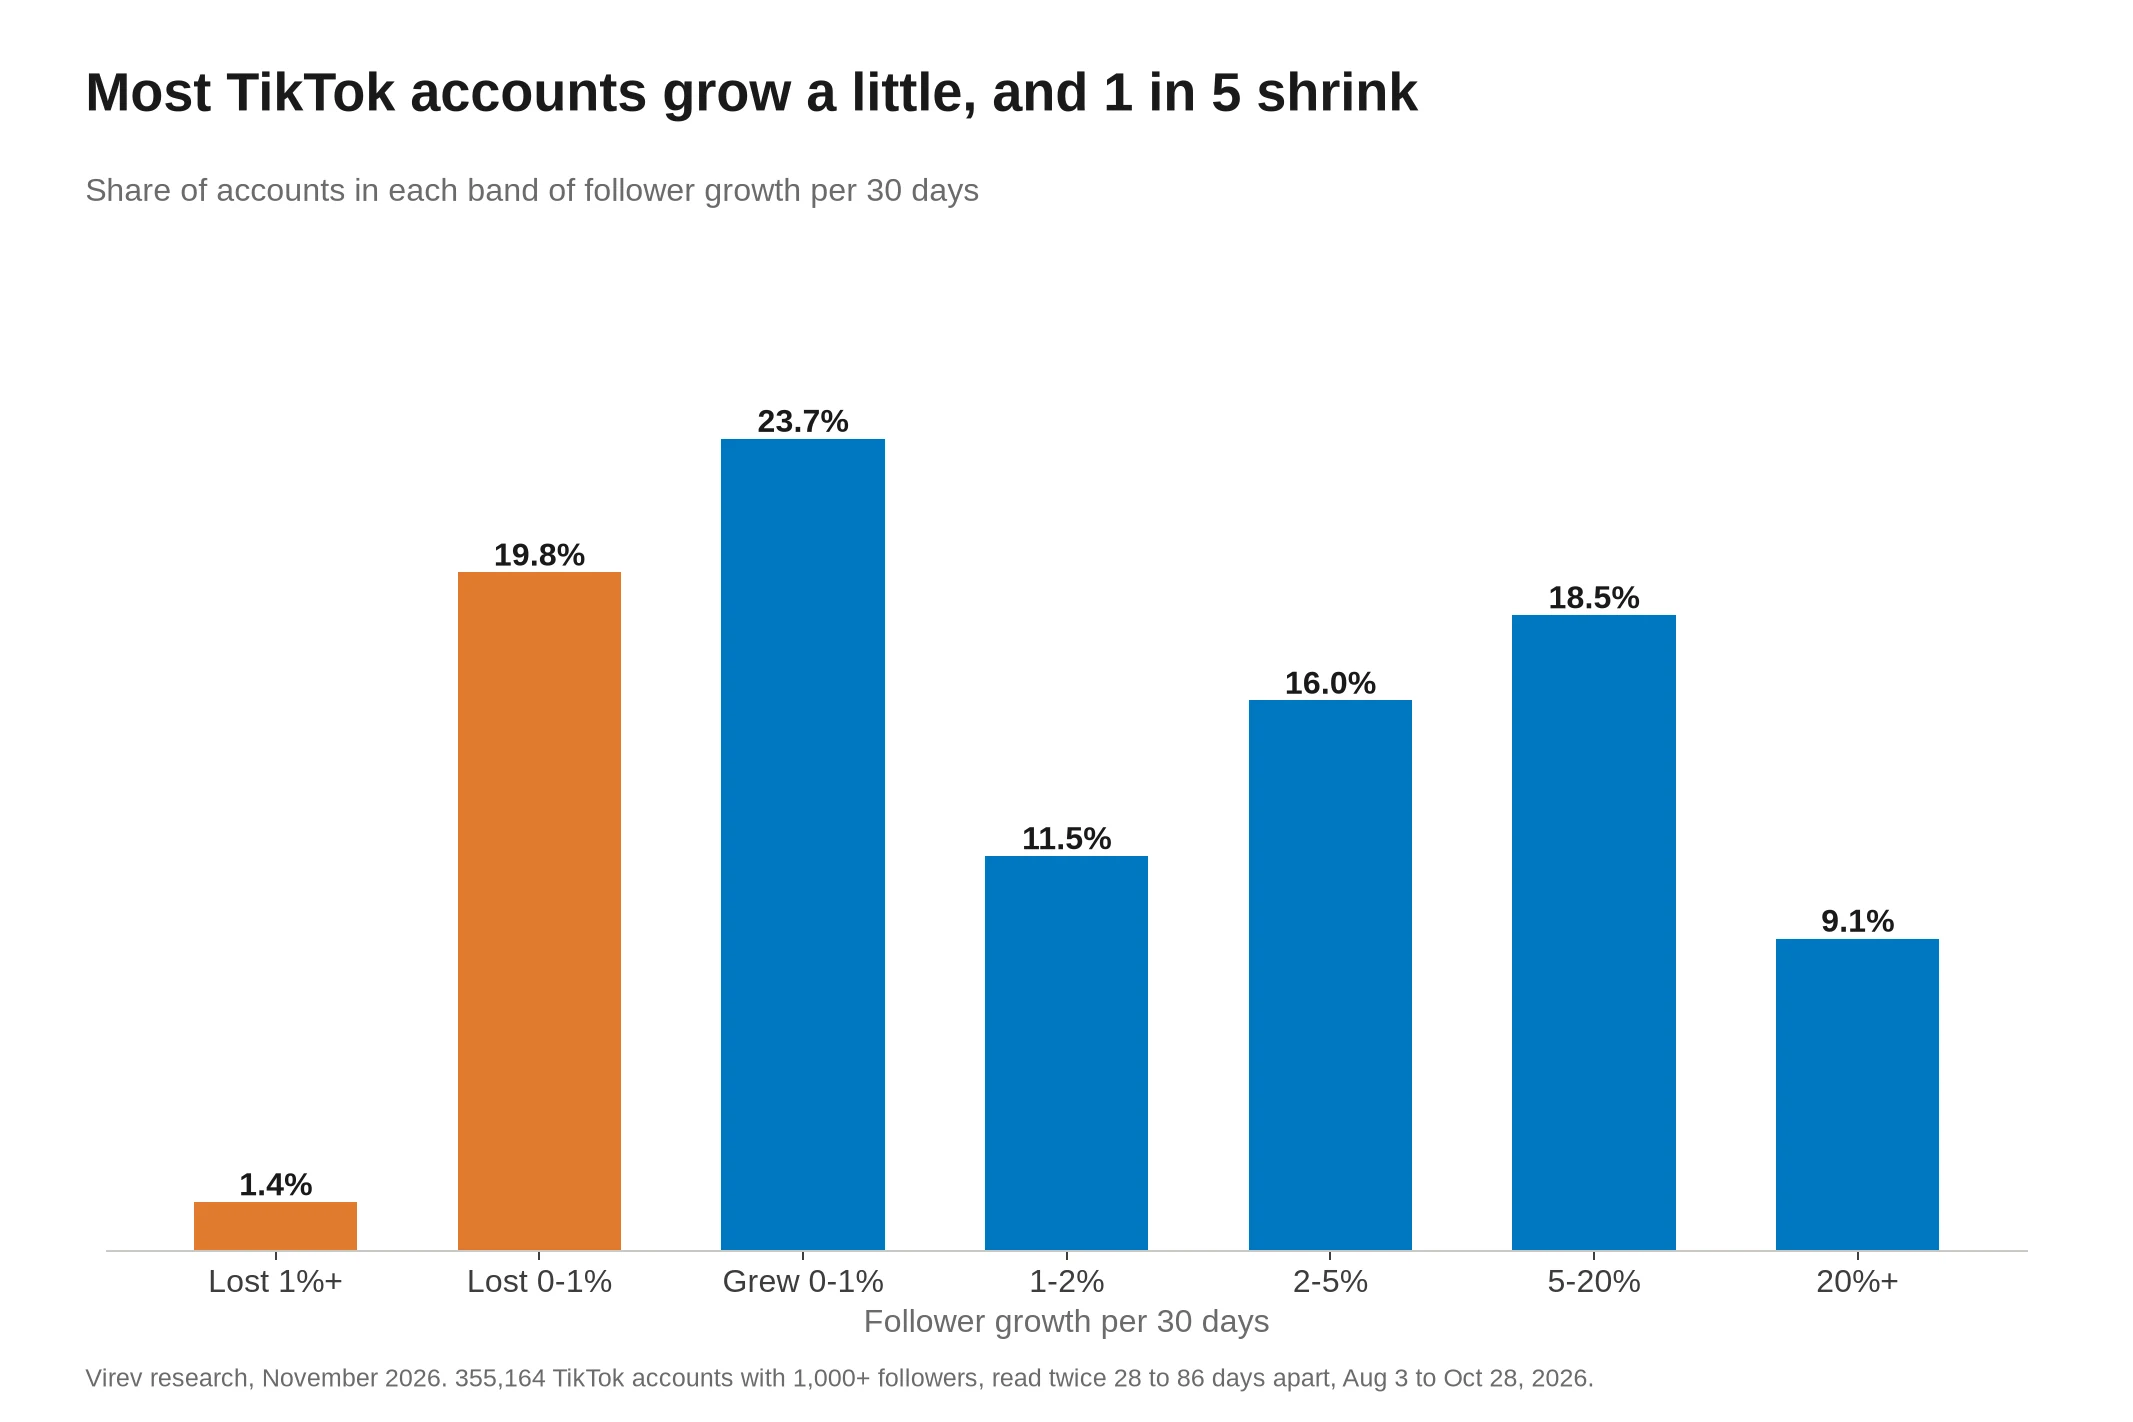
43% of accounts sit between a 1% loss and a 1% gain. 78.4% grew between the reads, 21.2% shrank and 0.4% did not move. Losses are small. Only 1.4% of accounts lost more than 1% a month, and 0.01% lost 10% or more. Gains have a long tail. The top 25% grew 5.9% a month or more, and 9.1% of accounts grew 20% or more. That tail is why the mean (7.12%) is five times the median.
In followers, the median account gained 314 followers per 30 days. The median account in the sample has 23,424 followers.
Accounts with 10K to 50K followers grow fastest
| Followers | Accounts | Median growth, 30 days | Top 10% | Top 1% | Shrank | Followers gained |
|---|---|---|---|---|---|---|
| 1K to 10K | 131,297 | 1.79% | 26.4% | 113.9% | 20.0% | 51 |
| 10K to 50K | 85,111 | 1.98% | 23.5% | 92.1% | 21.1% | 437 |
| 50K to 100K | 33,051 | 1.76% | 16.5% | 64.5% | 19.6% | 1,227 |
| 100K to 500K | 64,114 | 1.15% | 9.5% | 37.6% | 20.5% | 2,448 |
| 500K to 1M | 18,335 | 0.73% | 5.3% | 18.3% | 23.1% | 5,059 |
| 1M+ | 23,256 | 0.34% | 2.9% | 9.3% | 31.0% | 7,325 |
| All | 355,164 | 1.39% | 18.2% | 86.7% | 21.2% | 314 |
"Top 10%" is the growth an account needs to be in the top 10% of its tier, and "Top 1%" the same for the top 1%. "Followers gained" is the median gain per 30 days.
Growth in percent is about the same from 1K to 100K followers, between 1.76% and 1.98% a month. Above 100K it falls, to 1.15% for 100K to 500K, 0.73% for 500K to 1M and 0.34% for 1M+. In followers, the median 1M+ account still gained 7,325 a month. The share that shrank stays near one in five up to 1M followers and rises to 31.0% above it.
The spread inside each tier is wide. A 1K to 10K account in the top 10% grew 26.4% a month or more, while the median one grew 1.79%. A brand that compares two small creators by growth should expect large gaps between normal accounts.
What is a good follower growth rate on TikTok
A good rate depends on size. The median is normal, the top 25% is good, and the top 10% is fast.
| Followers | Median growth, 30 days | Top 25% grew at least | Top 10% grew at least |
|---|---|---|---|
| 1K to 10K | 1.79% | 8.51% | 26.42% |
| 10K to 50K | 1.98% | 8.30% | 23.51% |
| 50K to 100K | 1.76% | 6.32% | 16.49% |
| 100K to 500K | 1.15% | 3.86% | 9.55% |
| 500K to 1M | 0.73% | 2.30% | 5.27% |
| 1M+ | 0.34% | 1.26% | 2.88% |
For a 5,000-follower account, normal is about 90 new followers a month, and the top 25% gains about 425. For a 500,000-follower account, normal is about 3,630 a month. Fast growth goes with posting often. 45% of the accounts above the top 10% mark for their tier posted 7 or more videos a week, against 19% of the other accounts.
Accounts that post more grow faster
We counted the videos each account added between the two reads, from the video count on its profile, and turned it into videos per week. 25,972 accounts had a lower video count at the second read, because they deleted or hid videos, so this table leaves them out.
| Videos per week | Accounts | Median growth, 30 days | Top 25% | Shrank |
|---|---|---|---|---|
| None | 38,354 | -0.09% | 0.45% | 57.5% |
| Under 1 | 68,177 | 0.59% | 2.98% | 29.3% |
| 1 to 3 | 79,476 | 1.43% | 5.36% | 17.1% |
| 3 to 7 | 72,090 | 2.28% | 7.83% | 10.9% |
| 7 to 14 | 39,626 | 3.47% | 10.90% | 6.9% |
| 14+ | 31,469 | 5.19% | 15.06% | 3.6% |
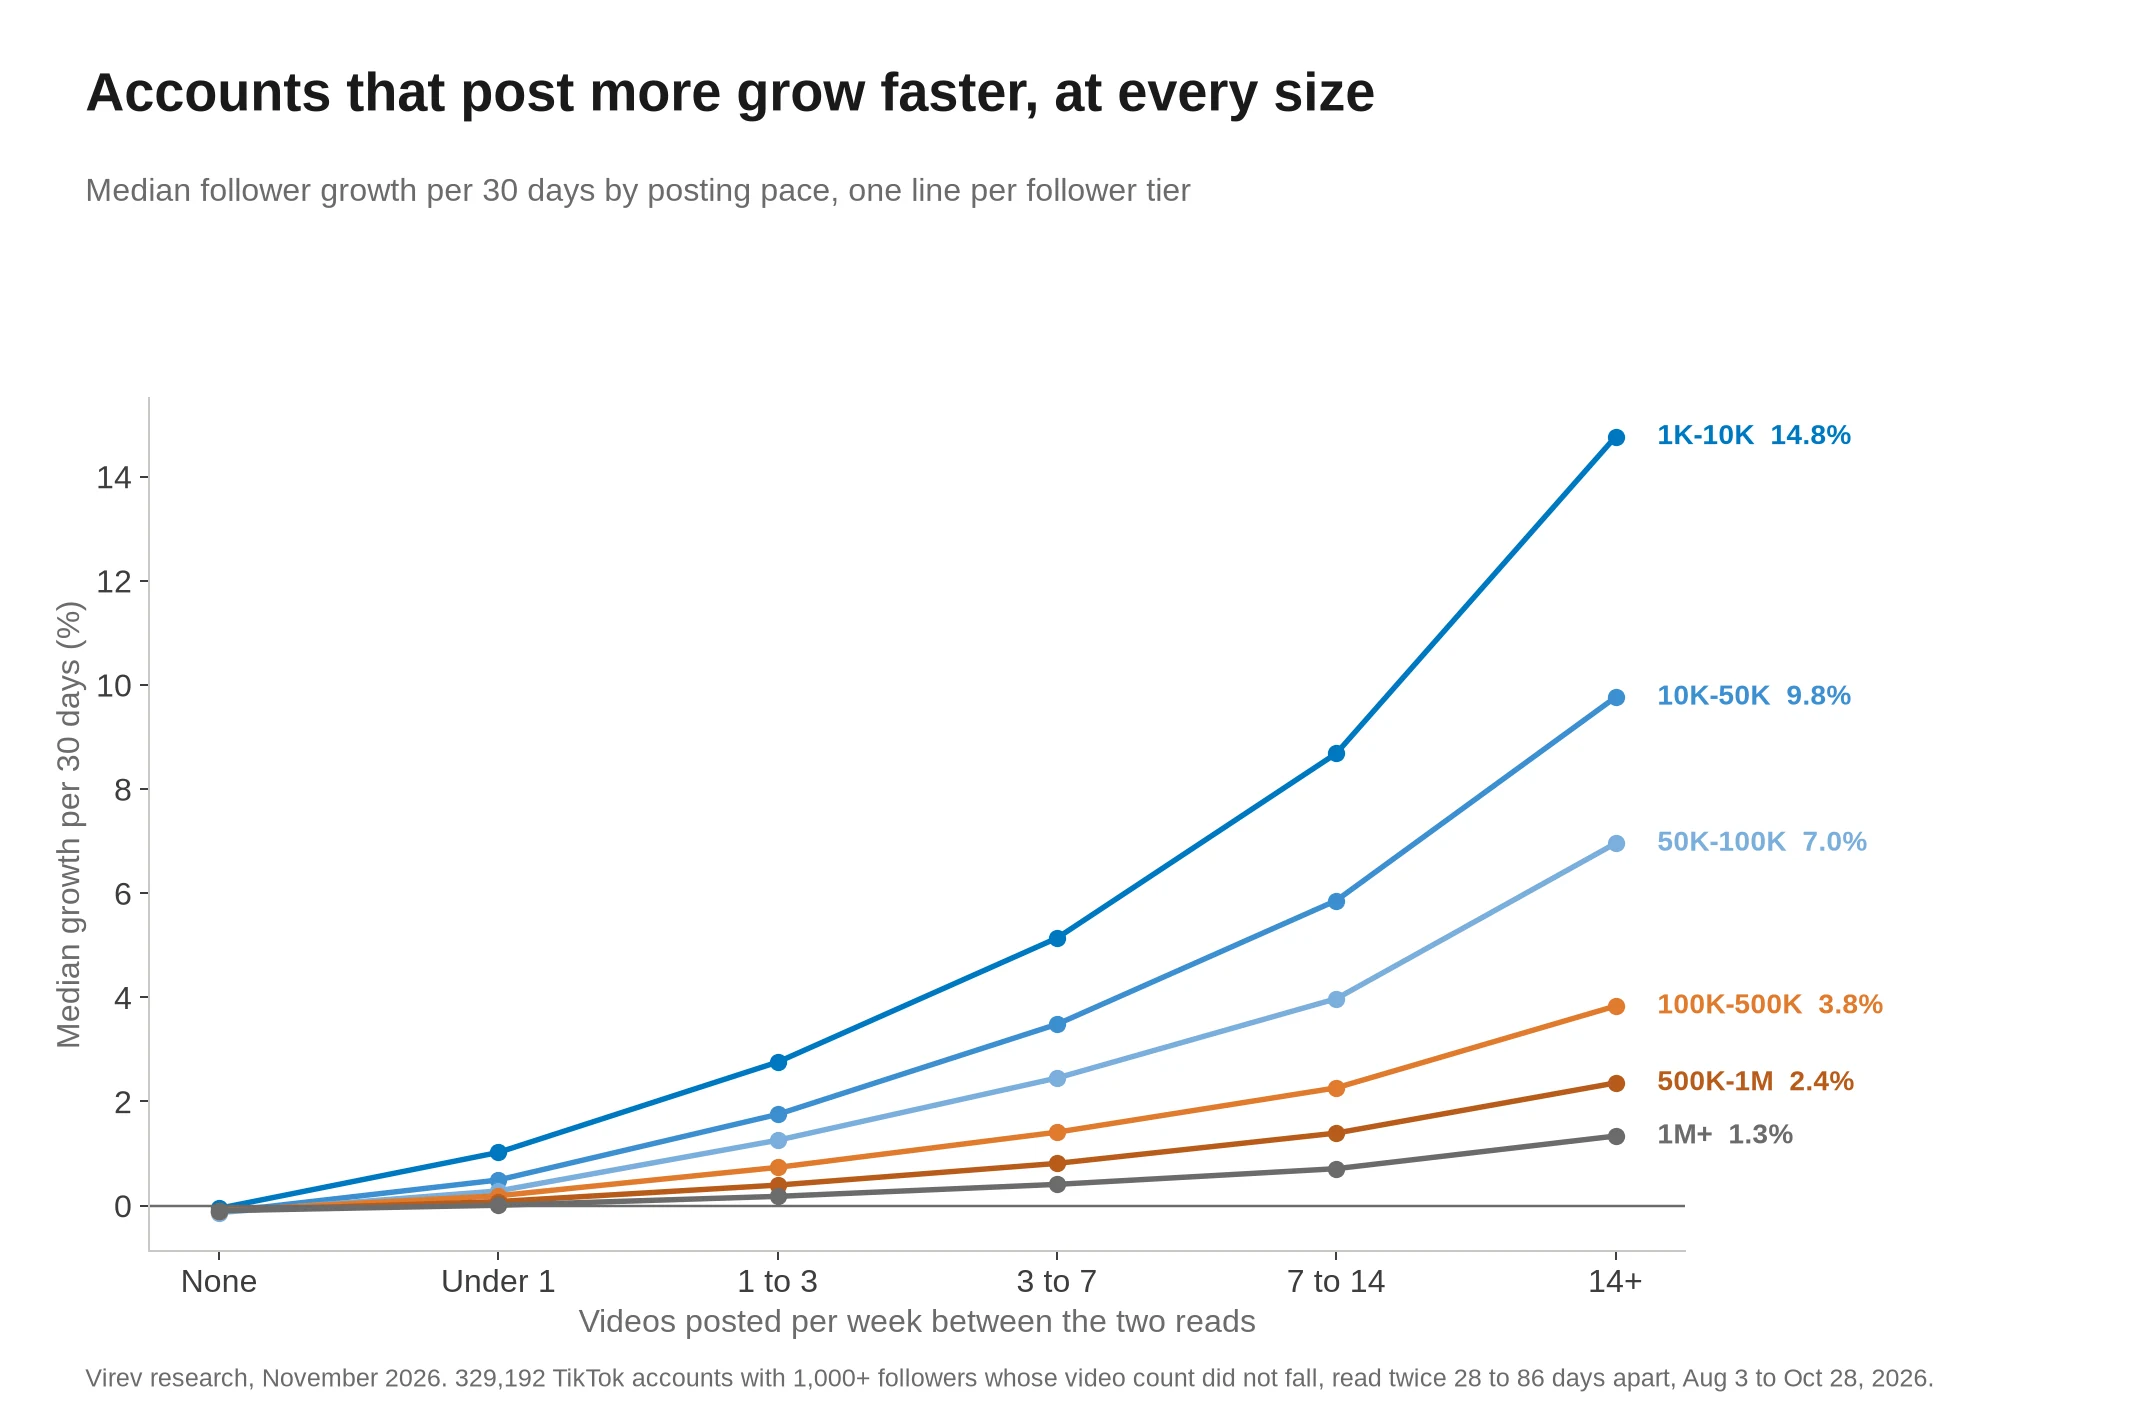
Accounts that posted no video between the reads shrank more often than not: 57.5% lost followers, and the median lost 0.09% a month. Growth rises with every step in pace, up to 5.19% a month for accounts that posted 14 or more videos a week.
The order holds inside every tier. Among 1K to 10K accounts, growth goes from -0.05% with no videos to 1.02%, 2.76%, 5.14%, 8.68% and 14.76% at 14+ videos a week. Among 1M+ accounts it goes from -0.10% to 1.34%. So the pattern does not come from big accounts posting more.
This is a correlation. A growing account has a reason to post more, and an account that posts twice a day often has a team. Our posting frequency study compares the same account's busy and quiet weeks, and it also found that weeks with more posts brought more total views.
Growth by creator category
Virev writes a creator profile for part of the accounts it crawls, and 71,229 accounts in this sample are profiled as individual creators. We grouped their niches into categories by keyword. Among categories with 300 or more accounts:
| Creator category | Accounts | Median growth, 30 days | Shrank | Median followers |
|---|---|---|---|---|
| Tech | 473 | 6.18% | 10.1% | 47,846 |
| Religion and faith | 1,453 | 4.18% | 8.7% | 41,156 |
| Gaming | 2,682 | 3.48% | 14.2% | 22,386 |
| Cars | 1,264 | 3.32% | 11.5% | 8,984 |
| Pets and animals | 861 | 2.95% | 13.2% | 16,248 |
| Comedy and entertainment | 23,647 | 2.87% | 15.0% | 41,170 |
| Education and books | 1,391 | 2.83% | 14.6% | 24,181 |
| Fitness and sports | 2,812 | 2.61% | 15.3% | 27,221 |
| Business and finance | 553 | 2.61% | 13.9% | 31,088 |
| Health and wellness | 592 | 2.34% | 12.2% | 39,753 |
| Family and parenting | 1,992 | 2.19% | 14.6% | 25,879 |
| Art and photography | 1,297 | 2.11% | 19.0% | 22,662 |
| Travel | 961 | 1.82% | 15.7% | 14,490 |
| Music and dance | 6,587 | 1.82% | 17.0% | 50,461 |
| Food | 2,097 | 1.74% | 12.3% | 104,578 |
| Lifestyle | 10,989 | 1.50% | 20.9% | 8,622 |
| Fashion | 1,769 | 1.38% | 20.4% | 50,225 |
| Beauty | 3,862 | 1.32% | 21.7% | 61,953 |
Tech, religion, gaming and car creators grew fastest, at 3.3% to 6.2% a month. Beauty, fashion and lifestyle creators grew slowest, at 1.3% to 1.5%, and about one in five of them shrank. Size explains part of it, because the median beauty creator here has 61,953 followers, against 22,386 for gaming. The 5,947 creators whose niche fit no category grew 3.39% a month and are not in the table.
Profiled accounts grew faster than the full sample (2.34% against 1.39%), because Virev profiles accounts that brands look at, and those lean toward active creators. Compare categories with each other, not with the overall median.
Growth by country
Virev's creator profiles name a country for 73,335 accounts in the sample, 20.6% of it. Among countries with 1,000 or more of those accounts:
| Country | Accounts | Share of profiled | Median growth, 30 days | Shrank |
|---|---|---|---|---|
| United States | 5,196 | 7.1% | 1.24% | 18.1% |
| Indonesia | 4,529 | 6.2% | 2.87% | 15.9% |
| Brazil | 4,099 | 5.6% | 3.17% | 12.4% |
| Russia | 3,799 | 5.2% | 1.90% | 12.6% |
| Vietnam | 3,003 | 4.1% | 3.00% | 19.6% |
| Mexico | 2,884 | 3.9% | 1.91% | 18.1% |
| Philippines | 2,837 | 3.9% | 2.34% | 17.7% |
| Pakistan | 2,249 | 3.1% | 3.93% | 14.5% |
| Turkey | 2,196 | 3.0% | 2.76% | 18.7% |
| Thailand | 2,169 | 3.0% | 2.80% | 11.2% |
| Saudi Arabia | 1,359 | 1.9% | 2.22% | 15.9% |
| Nigeria | 1,176 | 1.6% | 4.37% | 10.1% |
| South Africa | 1,176 | 1.6% | 3.54% | 6.4% |
| Japan | 1,165 | 1.6% | 1.76% | 18.9% |
| Egypt | 1,146 | 1.6% | 2.96% | 10.5% |
| Colombia | 1,146 | 1.6% | 2.00% | 16.8% |
| Argentina | 1,130 | 1.5% | 2.00% | 15.0% |
| Iraq | 1,122 | 1.5% | 3.44% | 11.1% |
| United Kingdom | 1,100 | 1.5% | 1.75% | 15.4% |
| Myanmar | 1,054 | 1.4% | 5.35% | 9.8% |
| Ukraine | 1,034 | 1.4% | 2.41% | 11.1% |
| France | 1,009 | 1.4% | 2.94% | 12.6% |
"Share of profiled" is the country's share of the 73,335 accounts with a country. US accounts grew 1.24% a month, close to the UK (1.75%), Japan (1.76%) and Mexico (1.91%). Accounts in Nigeria (4.37%), Pakistan (3.93%), Myanmar (5.35%) and South Africa (3.54%) grew faster, and fewer of them shrank. Smaller countries outside the table grew faster still, such as Bangladesh (6.10%, 776 accounts) and India (7.53%, 402 accounts). South Korea had 710 accounts with a median of 3.07%.
Country growth mixes in size and pace. The median US account in this table has 69,259 followers, against 22,131 for Indonesia. And like the category table, the country table covers profiled accounts, which grew faster than the full sample.
TikTok accounts grow faster than Instagram accounts
We ran the same rule on 672,503 Instagram accounts with 1,000+ followers, read at least 28 days apart in the same months. The median Instagram account grew 0.82% a month, and 25.0% shrank.
| Followers | Instagram median | TikTok median | Instagram top 10% | TikTok top 10% | Instagram shrank | TikTok shrank |
|---|---|---|---|---|---|---|
| 1K to 10K | 1.17% | 1.79% | 8.5% | 26.4% | 16.7% | 20.0% |
| 10K to 50K | 0.96% | 1.98% | 7.8% | 23.5% | 23.3% | 21.1% |
| 50K to 100K | 0.78% | 1.76% | 6.9% | 16.5% | 26.8% | 19.6% |
| 100K to 500K | 0.48% | 1.15% | 4.9% | 9.5% | 32.7% | 20.5% |
| 500K to 1M | 0.26% | 0.73% | 3.3% | 5.3% | 37.9% | 23.1% |
| 1M+ | 0.04% | 0.34% | 1.9% | 2.9% | 47.3% | 31.0% |
| All | 0.82% | 1.39% | 6.8% | 18.2% | 25.0% | 21.2% |
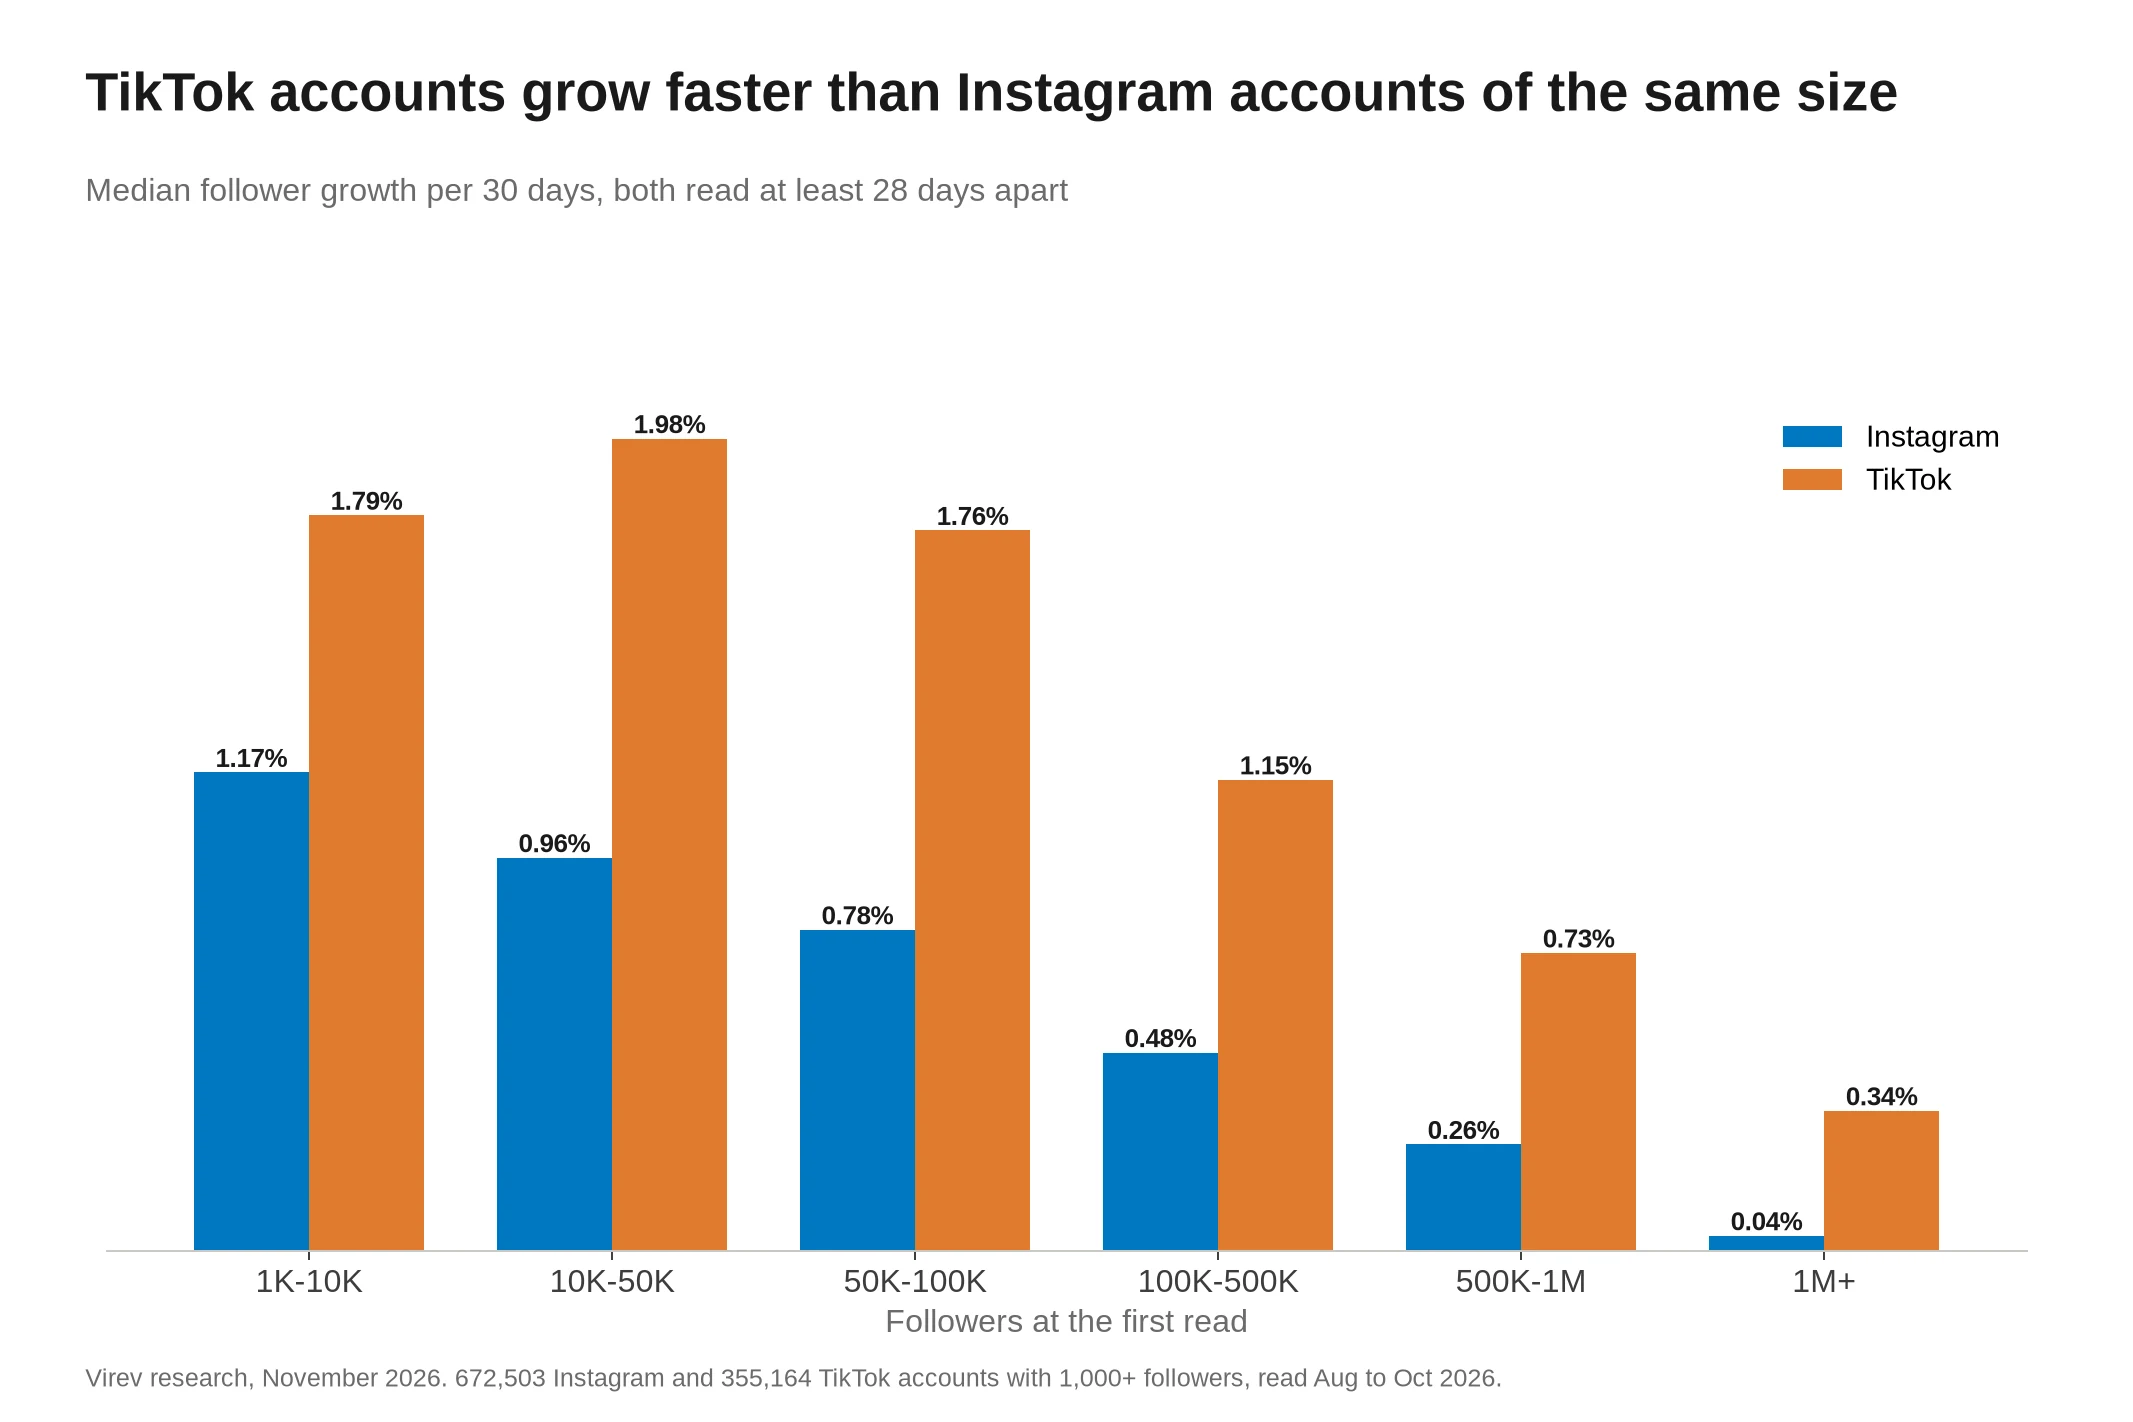
The median TikTok account grew 1.7 times as fast as the median Instagram account, and the gap is wider for bigger accounts. TikTok's top 10% grew 18.2% a month or more, against 6.8% on Instagram, so a fast month is much more common on TikTok. Above 10K followers, fewer TikTok accounts shrank than Instagram accounts of the same size. Below 10K it is the other way round: 20.0% of small TikTok accounts shrank, against 16.7% on Instagram.
Our Instagram follower growth study reports 0.93% a month for Instagram, from reads a median of 18 days apart. With the 28-day rule used here, the Instagram median is 0.82%. For engagement by tier on TikTok, see our TikTok engagement rate benchmarks.
How long it takes to get from 1,000 to 10,000 followers
At the median pace of a 1K to 10K account, 1.79% a month, an account needs about 130 months, or 11 years, to go from 1,000 to 10,000 followers.
| Pace (growth per 30 days) | Rate | Months from 1K to 10K |
|---|---|---|
| Median 1K to 10K account | 1.79% | about 130 (11 years) |
| Median 1K to 10K account posting 3 to 7 videos a week | 5.14% | about 46 (4 years) |
| Median 1K to 10K account posting 7 to 14 videos a week | 8.68% | about 28 (2.3 years) |
| Top 25% of 1K to 10K accounts | 8.51% | about 28 (2.3 years) |
| Median 1K to 10K account posting 14+ videos a week | 14.76% | about 17 (1.4 years) |
| Top 10% of 1K to 10K accounts | 26.42% | about 10 (10 months) |
These months assume an account keeps the same rate every month, which no account does. Growth comes in bursts, and one video that travels can bring a small account a year of followers in a week. Read the table as the pace you need: to reach 10K in a year, a 1K account needs to grow about 21% a month, which puts it near the top 10% of small accounts.
A 20% jump in a month is common on small accounts
Follower spikes get attention because bought followers arrive in one block. On TikTok, a fast month is normal for small accounts.
| Followers | Accounts | Grew 10%+ | Grew 20%+ | Grew 50%+ |
|---|---|---|---|---|
| 1K to 10K | 131,297 | 22.6% | 13.1% | 4.4% |
| 10K to 50K | 85,111 | 21.9% | 11.9% | 3.5% |
| 50K to 100K | 33,051 | 17.0% | 8.0% | 1.8% |
| 100K to 500K | 64,114 | 9.5% | 3.4% | 0.5% |
| 500K to 1M | 18,335 | 3.8% | 0.8% | under 0.1% |
| 1M+ | 23,256 | 0.8% | 0.1% | under 0.1% |
| All | 355,164 | 17.1% | 9.1% | 2.8% |
A share counts the accounts whose growth, as a 30-day rate, reached 10%, 20% or 50%. 13.1% of 1K to 10K accounts grew 20% or more a month, against 0.1% of 1M+ accounts. 0.7% of all accounts doubled or more per 30 days. On Instagram, measured the same way, 2.6% of accounts grew 20% or more a month.
So a TikTok spike alone is weak evidence of bought followers. Look for the video behind it: a post with many times the account's usual views explains most real spikes. Our guide to reading follower growth without treating every spike as fraud walks through the checks.
Verified accounts
6.6% of the accounts in the sample have TikTok's verified badge, from 0.5% at 1K to 10K followers to 40.4% at 1M+.
| Followers | Verified share | Verified median growth | Unverified median growth |
|---|---|---|---|
| 1K to 10K | 0.5% | 1.93% | 1.79% |
| 10K to 50K | 2.6% | 1.31% | 2.01% |
| 50K to 100K | 5.5% | 1.02% | 1.82% |
| 100K to 500K | 9.5% | 0.71% | 1.22% |
| 500K to 1M | 17.9% | 0.49% | 0.80% |
| 1M+ | 40.4% | 0.21% | 0.46% |
Verified accounts grew slower than unverified accounts of the same size above 10K followers. At 1M+, the median verified account grew 0.21% a month against 0.46%. Verified accounts post less. At 1M+ followers, 51% of verified accounts posted 3 or more videos a week, against 61% of unverified accounts. At the same pace they still grew slower, and 1M+ accounts posting 3 to 7 videos a week grew 0.29% a month if verified and 0.48% if not. This data does not show the rest of the reason.
What to do with this
For brands and agencies
- Use the median and top 25% for the creator's tier as the baseline, because a 50K creator growing 1.8% a month is normal on TikTok and one at 6.3% is in the top 25%.
- Do not mark a large account down for a flat month, because 31.0% of 1M+ accounts lost followers between our reads.
- Check that a creator still posts, because accounts with no new videos between our reads shrank 57.5% of the time.
- When a creator shows a spike, find the video behind it before you judge it, because 13.1% of small TikTok accounts grow 20% or more in a month.
- Compare TikTok and Instagram growth only against each app's own medians, because a normal TikTok month is 1.7 times a normal Instagram month.
Virev keeps each creator's follower history. Find creators in Virev creator search, which covers 180M+ creators, save them to a list, and the creator card shows their recent follower counts, so you see a spike before you pitch. Sign up to search creators by niche and size.
For creators
- Compare yourself with the median for your tier, because 1.8% a month is the median at 1K to 10K and 8.5% puts you in the top 25%.
- Post every week, because accounts with no new videos lost followers and accounts with 3 to 7 videos a week grew 2.28% a month.
- Expect growth in bursts, because one video that travels can bring a small account a year of followers.
How we measured, and what can be wrong
- The sample is 355,164 public TikTok accounts with 1,000+ followers at the first read, whose follower count Virev's crawler read twice, 28 to 86 days apart, between August 3 and October 28, 2026.
- We use the first and last read of each account, the median gap is 53 days, and half of the gaps are 48 to 60 days.
- Growth per 30 days is (followers at the second read / followers at the first read) raised to the power of 30 / days, minus one, and the tables report the median across accounts.
- The tier is the follower count at the first read, the same as in our Instagram study.
- The Instagram comparison uses the same rule and the same months on 672,503 Instagram accounts, so its median (0.82%) differs from the 0.93% our Instagram study reports from shorter gaps.
- The sample holds accounts the crawler read twice, and when the crawler first found an account changes the result: accounts first read August 3 to 23 grew a median 3.56% a month, accounts first read August 24 to 30 grew 1.58%, and accounts first read August 31 or later grew 0.63%.
- That gap holds inside every tier and posting pace, and the early group holds more accounts with a Virev creator profile (60% against 8%).
- Most of the gap comes from which accounts the crawler found first, because over the same weeks different groups grew at different rates.
- Among 7,998 accounts with a third read near the middle of their gap, accounts first read August 24 to 30 grew a median 2.59% a month from about September 7 to October 21, while accounts first read August 31 or later grew 1.39% from about September 9 to 28 and 1.11% from September 28 to October 26.
- Part of the gap is a slowdown over time, because those 7,998 accounts grew 20% to 33% slower in the second half of their gap than in the first, and about two in three of them slowed.
- The 1.39% median mixes those groups as the crawler read them, so treat it as a range of about 0.6% to 3.6% a month for different sets of accounts, with the tier and pace patterns the same in each.
- Videos per week is the change in the profile's video count divided by the weeks between the reads, and 25,972 accounts (7.3%) whose count fell are left out of the pace tables.
- Posting pace and growth are a correlation, and this study cannot show that posting causes growth.
- Categories and countries come from Virev's creator profiles, which a language model writes from public profile text, and cover 71,229 creators and 73,335 accounts with a country.
- We grouped free-text niches into categories by keyword, and a hand check of 25 random profiled accounts found 22 in the right category, with two football accounts filed under comedy and entertainment.
- After we moved sports words ahead of entertainment words, 24 of the 25 were right, and the one miss was a reborn doll account filed under family and parenting.
- In that hand check, 15 of the 25 niches matched the account's TikTok bio, and the other 10 bios were empty or too short to tell, with no bio that contradicted its niche.
- The verified badge is the one TikTok showed at our most recent read of the account.
- We cannot see new follows and unfollows separately, only the net change, so a flat account may be gaining and losing at the same rate.
- We cannot see accounts under 1,000 followers in this sample, private accounts, or accounts that were deleted or banned before the second read.
- The time to 10K holds one month's rate constant, while real accounts grow in bursts and change pace.
For engagement on TikTok by tier, see our TikTok engagement rate benchmarks. For how often accounts post, see how often you should post on Instagram and TikTok.
Download the data
All tables are in one CSV: tiktok-follower-growth-2026.csv. Each row is one group in one table, such as a follower tier, a posting pace, a category or a country, with the platform, the number of accounts, the median growth per 30 days, the 25th, 75th, 90th and 99th percentile, the mean, the share that shrank and did not move, the median followers gained per 30 days and the median followers at the first read. Please cite "Virev, November 2026" and link this page.