



Most TikTok Shop products sell nothing. We read 1,914,354 products listed in 19,045 US TikTok Shop shops twice, once from October 13 to 19, 2026 and again from October 30 to November 4, and compared TikTok's own sold count between the two reads. 92.5% of the products did not sell a single unit in that time, a median of 15 days. The top 1% of products sold 93.2% of all the units.
The pages that rank for "TikTok Shop statistics" give platform totals and surveys. Capital One Shopping puts TikTok Shop's US sales at $15.82 billion for 2025, DemandSage says 15 million sellers worldwide, and Podbase repeats TikTok's figure of more than 70 million products. None says how much a typical product or shop sells. Agency pages answer that with their own clients, such as Social Tale's "five and six-figure monthly GMV within 60-90 days" for a well-run launch. This study counts units for every product in each shop it read.
92.5%
Products with no sale
93.2%
Units from the top 1%
$540
Median selling shop
How we counted sales
Every TikTok Shop product page and product card shows how many units the product has sold, such as "2.3K sold". TikTok's data behind it is an exact count of the product's lifetime sales, net of returns. Virev's crawler reads that count each time it sees the product.
For this study we took the shops whose whole catalog the crawler read from October 13 to 19, 2026, and kept the shops it read again from October 30 to November 4. For each product, we subtracted the first count from the last. The two reads were 11 to 22 days apart, 15 days for the median product, so we also give units per 30 days, which is the units divided by the days and times 30.
92.5% of products sold nothing in two weeks
| Units sold per 30 days | Products | Share of products | Share of all units |
|---|---|---|---|
| 0 | 1,770,857 | 92.5% | 0% |
| 1 to under 2 | 45,703 | 2.4% | 0.8% |
| 2 to under 5 | 43,761 | 2.3% | 1.4% |
| 5 to under 10 | 18,440 | 1.0% | 1.5% |
| 10 to under 30 | 17,972 | 0.9% | 3.6% |
| 30 to under 100 | 9,911 | 0.5% | 6.5% |
| 100 to under 1,000 | 6,532 | 0.3% | 24.3% |
| 1,000+ | 1,178 | 0.06% | 61.9% |
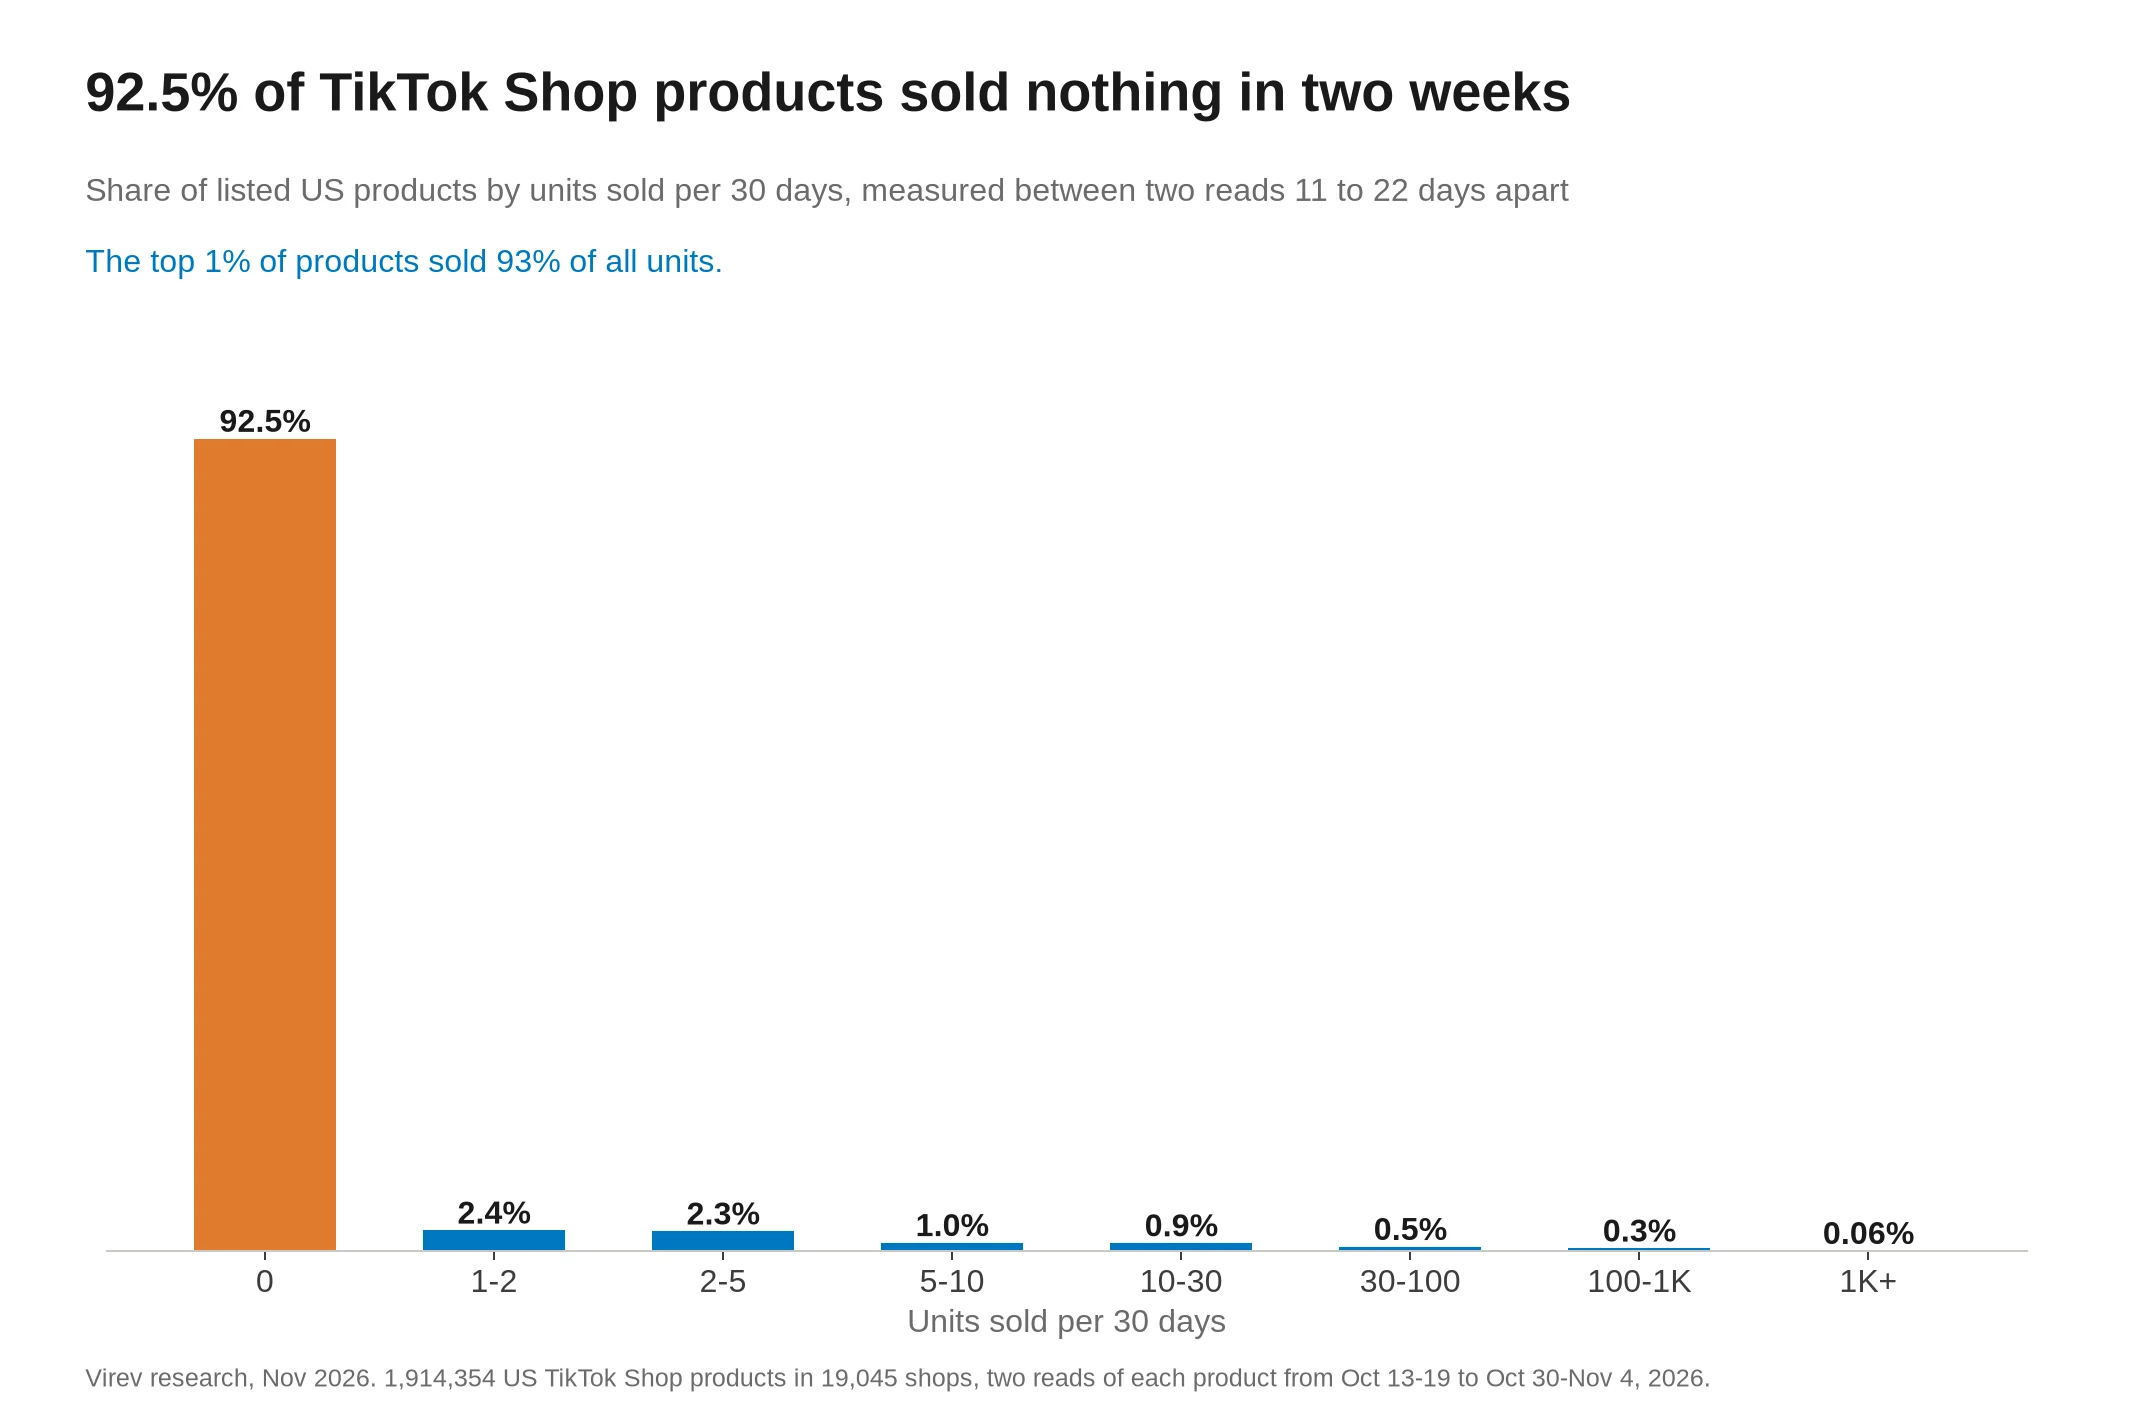
Only 7.5% of the products sold one unit or more. Most of the rest had never sold at all, because 78.8% of the products showed a sold count of 0 at the first read. The median product sold 0 units, and so did the product at the 90th percentile. One product in 100 sold 25.9 or more units per 30 days.
The products that did sell mostly sold a few. The median selling product sold 3 units per 30 days, a quarter sold 9.5 or more, and a tenth sold 39.5 or more.
Another 186,277 products, 8.9% of the products in the shops we read twice, were gone from their shop by the second read. 86.5% of them had never sold, so the 92.5% counts products that were still listed at the end, and the share with no sale among everything listed in mid-October is higher.
The top 1% of products sell 93% of the units
The 19,144 products in the top 1% sold 93.2% of all units in the window. The top 0.1%, 1,914 products, sold 69.1%. Half of all units came from 535 products, 0.03% of the total. The 1,178 products that sold 1,000 or more units per 30 days, 0.06% of the products, sold 61.9% of the units.
That is far steeper than the creator side that affiliate pages report. Hamster Garage says the top 0.5% of creators drive 38% of affiliate sales. On the product side, the top 1% hold nearly all of the sales.
Cheap products sell a little more often
The median listed product cost $19.74, and half cost between $11.39 and $34.99.
| Price | Products | Share of products | Sold nothing | Units per 30 days, median selling product | Share of all units |
|---|---|---|---|---|---|
| Under $10 | 411,664 | 21.5% | 90.0% | 2.9 | 10.1% |
| $10 to $20 | 582,836 | 30.4% | 92.6% | 2.9 | 26.0% |
| $20 to $50 | 603,521 | 31.5% | 93.3% | 3.8 | 42.6% |
| $50 to $100 | 160,585 | 8.4% | 92.7% | 4.1 | 15.1% |
| $100+ | 155,748 | 8.1% | 95.3% | 3.0 | 6.1% |
Products under $10 were the most likely to sell, and products over $100 the least, but the gap is 5 points. Products from $20 to $50 sold 42.6% of all units while making up 31.5% of the products.
40% of shops made no sale
We added up each shop's products. 40.4% of the 19,045 shops sold no unit between the two reads. The median shop sold 3.2 units and $71 in sales per 30 days. Among the 11,358 shops that sold, the median shop sold 24.5 units and $540 per 30 days, and in the median selling shop 24.1% of the products sold at least once.
| Products in the shop | Shops | Sold nothing | Units per 30 days, median shop | Sales per 30 days, median shop | Sales per 30 days, median selling shop | Share of units per 30 days |
|---|---|---|---|---|---|---|
| 1 | 1,711 | 73.1% | 0 | $0 | $152 | 0.6% |
| 2 to 9 | 5,789 | 52.3% | 0 | $0 | $324 | 9.8% |
| 10 to 49 | 6,381 | 35.2% | 5.2 | $113 | $562 | 31.3% |
| 50 to 199 | 3,478 | 26.1% | 11.6 | $245 | $628 | 34.5% |
| 200 to 999 | 1,341 | 15.8% | 38.3 | $687 | $1,098 | 15.7% |
| 1,000+ | 345 | 11.9% | 70.1 | $1,368 | $1,881 | 8.2% |
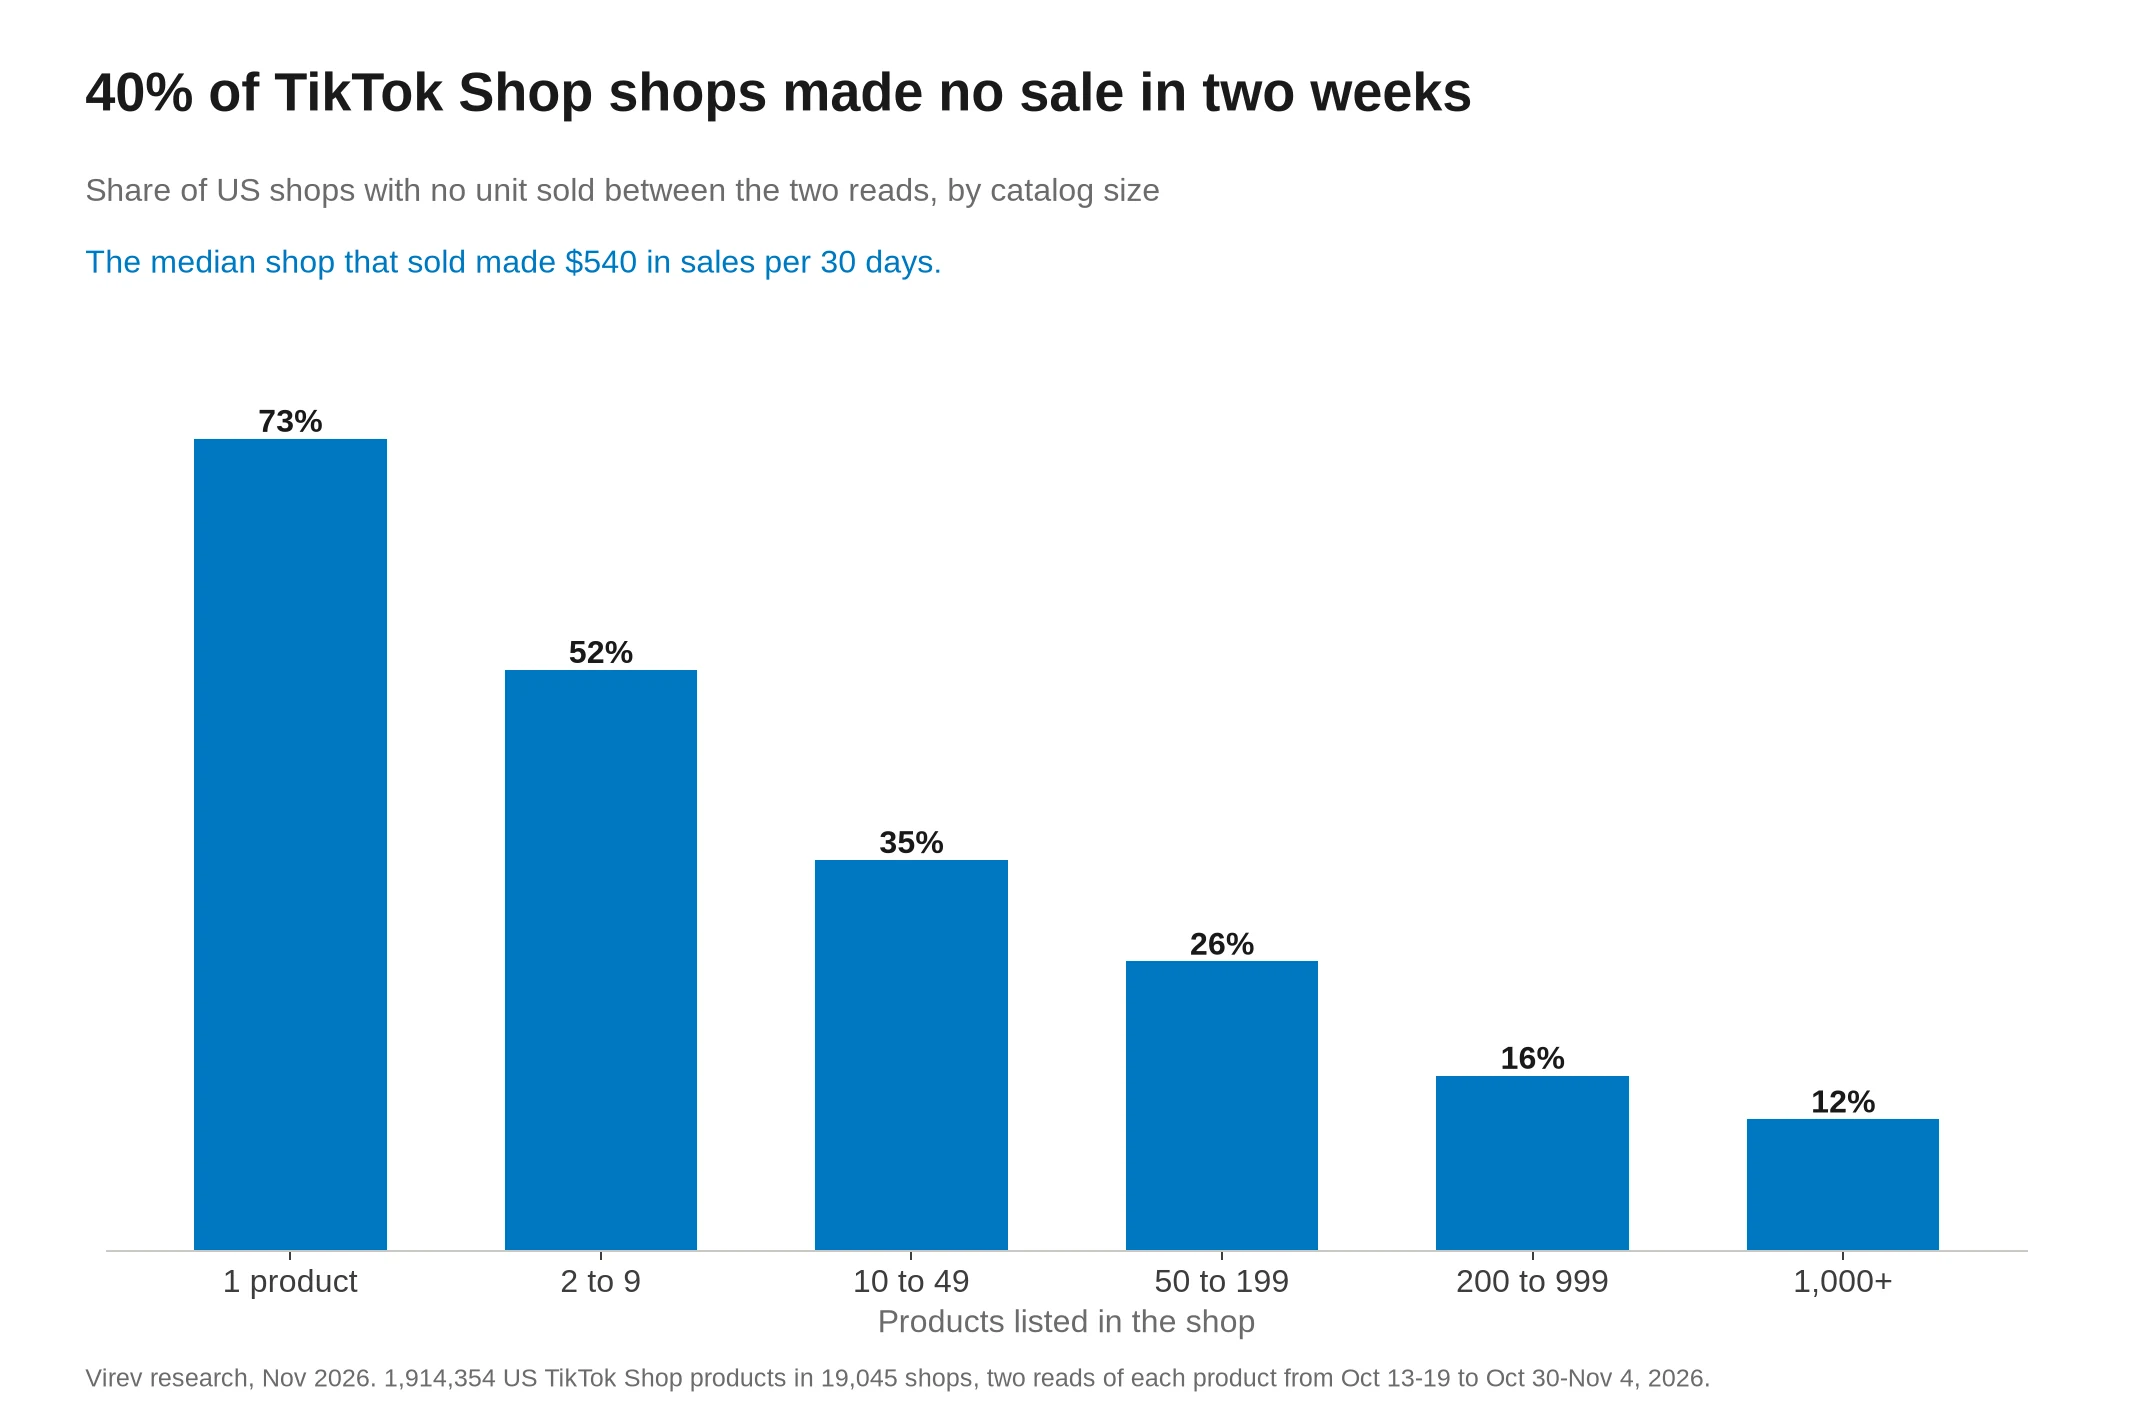
The median shop listed 15 products. Shops with one product made no sale in 73.1% of cases, and shops with 1,000 or more products in 11.9%. Bigger catalogs sell more often, but the median selling shop with 1,000+ products still made $1,881 per 30 days.
By sales per 30 days, 40.4% of shops made $0, 12.6% made under $100, 23.3% made $100 to $1,000, 15.1% made $1,000 to $10,000 and 8.7% made $10,000 or more. The top 1% of shops sold 64.8% of the units, counted per 30 days.
Products with creator videos sell more often, but less so once past sales are equal
TikTok shows up to 15 "videos featuring this product" on a product page, and creators can tag a product in their own videos. We counted the videos linked to each product up to November 4. Our crawler reads a product page only after a product shows a sale or a linked video, so this comparison uses the 405,767 products that had sold at least once before the first read and had a product page read.
Of those products, 30.6% had at least one creator video. 44.3% of them sold again in the window, against 21.0% of the products with no video, and the products with a video sold 90.8% of the units.
Most of that gap comes from past sales. A product that already sells probably gets more videos, and creators likely pick products that sell. Among products with the same past sales, the gap is much smaller:
| Units sold before the window | Products | Had a creator video | Sold in the window, with a video | Sold in the window, no video |
|---|---|---|---|---|
| 1 to 9 | 286,716 | 17.7% | 16.9% | 15.4% |
| 10 to 99 | 83,076 | 50.4% | 49.2% | 47.6% |
| 100 to 999 | 26,395 | 84.5% | 77.9% | 71.4% |
| 1,000+ | 9,580 | 96.3% | 91.7% | 75.0% |
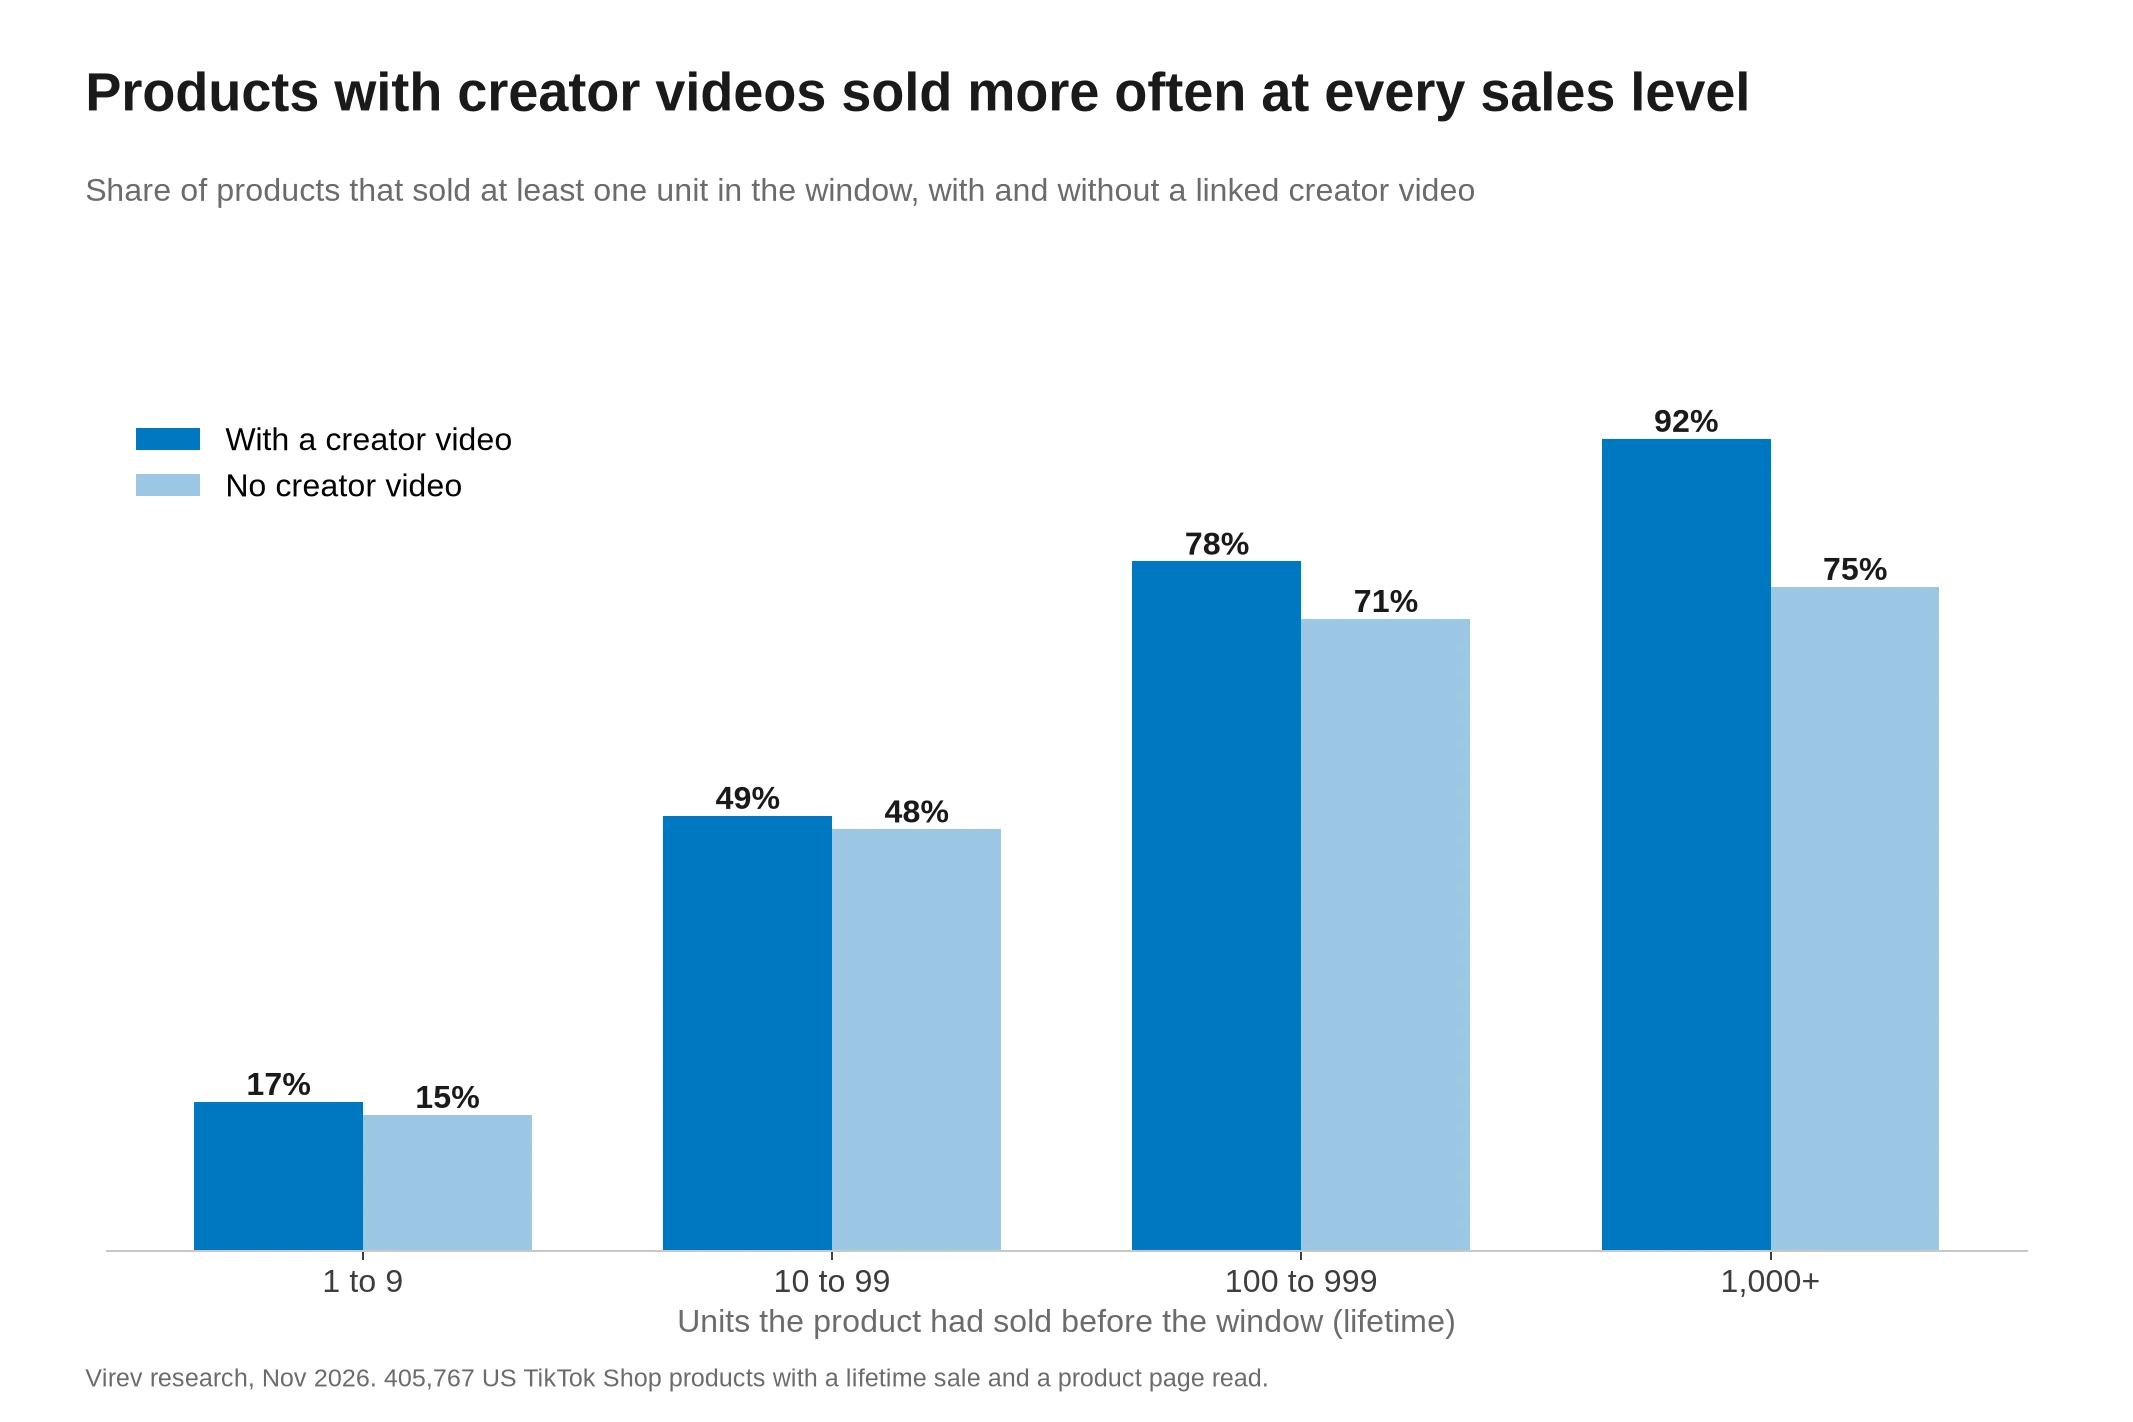
For products with fewer than 100 past sales, which is 91% of this group, a video went with 1.5 points more products selling. For products with 1,000+ past sales, it went with 16.7 points more.
The same pattern shows inside one shop. In 3,886 shops with at least 3 products on each side, the median shop sold 35.7% of its products with a video and 17.0% of those without, and the video side sold more often in 70.7% of the shops.
Products with more creators sold more often. This table is not split by past sales, and products with more past sales also have more creators.
| Creators with a video of the product | Products | Sold in the window | Units per 30 days, median |
|---|---|---|---|
| None | 281,739 | 21.0% | 0 |
| 1 | 57,430 | 28.4% | 0 |
| 2 to 4 | 31,695 | 43.8% | 0 |
| 5 to 14 | 21,678 | 62.8% | 2.7 |
| 15+ | 13,225 | 84.2% | 26.8 |
The videos are counted up to the end of the window, so some came after the sales, and this is an association, not a test of what a video does.
Sales by category
Our crawler stores a product's category only from its product page, so this table covers a random twelfth of the products in our sample that had a product page read, 35,683 products that had sold before or had a creator video.
| Category | Products | Sold in the window | Median price | Units per 30 days, median selling product |
|---|---|---|---|---|
| Womenswear & Underwear | 4,541 | 27.5% | $19.99 | 3.5 |
| Menswear & Underwear | 4,015 | 25.8% | $14.99 | 2.9 |
| Home Supplies | 3,836 | 28.3% | $12.84 | 2.9 |
| Fashion Accessories | 3,532 | 33.7% | $13.91 | 4.1 |
| Beauty & Personal Care | 3,354 | 41.0% | $17.47 | 5.5 |
| Sports & Outdoor | 2,667 | 33.1% | $13.99 | 2.9 |
| Phones & Electronics | 2,038 | 26.9% | $11.13 | 3.2 |
| Kitchenware | 1,211 | 27.9% | $15.38 | 2.9 |
| Shoes | 1,174 | 29.7% | $30.98 | 4.1 |
| Automotive & Motorcycle | 1,152 | 32.3% | $17.10 | 3.1 |
| Toys & Hobbies | 985 | 34.7% | $14.23 | 4.0 |
| Textiles & Soft Furnishings | 932 | 30.3% | $14.40 | 3.4 |
| Computers & Office Equipment | 835 | 32.2% | $11.69 | 2.9 |
| Luggage & Bags | 615 | 28.3% | $22.79 | 2.9 |
| Home Improvement | 588 | 30.8% | $18.56 | 4.3 |
| Tools & Hardware | 576 | 30.7% | $18.99 | 2.9 |
| Collectibles | 540 | 30.4% | $24.99 | 3.2 |
| Jewelry Accessories & Derivatives | 507 | 27.4% | $30.00 | 4.5 |
| Pet Supplies | 482 | 34.9% | $17.60 | 4.8 |
| Furniture | 467 | 19.7% | $134.88 | 2.7 |
| Food & Beverages | 437 | 39.4% | $17.45 | 4.3 |
| Health | 328 | 45.7% | $28.95 | 5.6 |
Health (45.7%), Beauty & Personal Care (41.0%) and Food & Beverages (39.4%) products sold most often, and Furniture (19.7%) least. Beauty and Health products that sold also sold the most units, a median 5.5 and 5.6 per 30 days. AfterShip puts Beauty & Personal Care at 22.5% of TikTok Shop sales, the largest category.
What to do with this
For sellers
- Expect most of your listings to sell nothing in a given two weeks, because 92.5% of listed products did and 78.8% had never sold a unit.
- Plan around a few products, because the top 1% of products sold 93% of the units, and in the median selling shop 24% of the products sold.
- Judge a new shop against the median, which was $540 per 30 days for shops that sold and $0 for shops with fewer than 10 products.
- Count the creators who post about a product, not only its videos, because products with 5 to 14 creators sold in the window 62.8% of the time and products with 15+ creators 84.2%.
For brands and creators
- Pick products that already sell when you choose what to promote, because past sales predicted the next two weeks far better than a video did.
- Check a product's sold count twice, some days apart, because a large lifetime count can belong to a product that has stopped selling, and only two reads show the difference.
Virev reads TikTok Shop products, shops and the creators who post about them, so you can see which creators already sell products like yours. Find creators in Virev creator search, which covers 180M+ creators, and sign up to save them to a list.
How we measured, and what can be wrong
- The sample is every product of a 10% random sample of the US TikTok Shop shops Virev's crawler read, picked by a hash of the shop id, which gave 22,141 shops with 2,663,510 listed products in the first read.
- A shop read pages through the shop's whole catalog, and we kept a shop only when the read listed at least 95% of the products the shop says it has on sale, which left out 680 shops with a short read and 67 with no product count.
- We kept the 19,141 shops that the crawler read again from October 30 to November 4, 2026, which left 2,100,631 products, and 1,914,354 of them were still listed at the second read.
- Units sold are the change in TikTok's lifetime sold count, net of returns, between the product's first read from October 13 to 19 and its last read from October 30 to November 4, 2026, and a fall (0.4% of products, from a refund or a relist) counts as 0.
- Units per 30 days are the units divided by the days between the two reads, 11 to 22 days, and times 30.
- Sales in dollars are units times the product's last listed price, and we give only medians, because a few product cards show a price far from the real one, such as $9,878.70 for a 30 ml serum.
- The shops are the ones Virev's crawler found through TikTok Shop search, categories, product pages and creator videos, so a shop that no one finds that way is missing, and these are more likely shops with some activity.
- The video comparison covers products with a past sale and a product page read, counts videos linked up to November 4, 2026, and cannot tell whether a video caused a sale.
- A product page lists at most 15 videos, so the creator counts in the 15+ row come from the product page and creators' own videos together.
- The category table is a random twelfth of the products with a product page read, by a hash of the product id, and categories with fewer than 300 such products are left out.
- The window runs from mid-October to early November 2026, before Black Friday, so holiday weeks may sell more.
For creator earnings on TikTok, see how much TikTok pays per 1,000 views. For views, see average TikTok views by followers.
Frequently asked questions
How many TikTok Shop products actually sell?
In our data, 7.5% of listed US TikTok Shop products sold at least one unit in about two weeks, and 21.2% had sold at least one unit in their life. The rest had never sold.
How much does a typical TikTok Shop product sell?
The median listed product sold 0 units. The median product that sold at all sold 3 units per 30 days, and about 1 product in 1,600 sold 1,000 or more.
How much does a TikTok Shop seller make?
The median US shop sold $71 per 30 days, and 40.4% sold nothing in about two weeks. Among shops that sold, the median made $540 per 30 days, 23.8% of all shops made $1,000 or more, and 8.7% made $10,000 or more. These are sales before TikTok's fees, affiliate commissions and product costs.
Do creator videos help TikTok Shop sales?
Products with a creator video sold more often, 44.3% against 21.0% among products that had sold before. Most of that gap comes from past sales, and among products with fewer than 100 past sales the gap was under 2 points. Products with 5 or more creators sold far more often.
What price sells best on TikTok Shop?
Products from $20 to $50 sold the most units, 42.6% of the total. Products under $10 sold at least once most often, 10.0% of them, against 4.7% of products over $100.
Download the data
All tables are in one CSV: tiktok-shop-statistics-2026.csv. Each row is one group in one table: all products, products by units per 30 days, price tiers, shop size tiers, shops by sales per 30 days, products with and without creator videos by past sales and by number of creators, the same-shop comparison, and categories. Please cite "Virev, November 2026" and link this page.
Sources
- TikTok Shop Statistics (2026): Revenue, Growth & Trends
- TikTok Shop Statistics (2026) - Revenue, Sellers & Growth Data
- TikTok Shop Statistics for 2026: Online Marketplace
- How Many TikTok Shop Sellers Are There? (2026 Statistics)
- TikTok Shop Statistics in 2026
- TikTok Shop Affiliate Statistics 2026: Benchmarks & ROI
- How Much Do TikTok Shop Sellers Actually Make?